4 AD Lines Hitting New Highs // SPY Surges with Gaps // Using CCI and StochRSI Together (XLI example) // QQQ Leads with Highest CCI Reading // 5 Sectors Spring to Life // 3 Industry Group Breakouts to Watch // XME and GDX Become Short-term Oversold // Oil & Gas Equip & Services SPDR Holds Support Bounce // Webinar Preview //// ....
4 AD Lines Hitting New Highs
The stock market continues to show broad strength as an array of AD Lines hit new highs on Friday. The chart below shows the S&P 1500 AD Line ($SUPADP) hitting a new high with a six day surge. The AD Lines for the S&P 500, S&P MidCap 400 and Nasdaq 100 also hit new highs. These AD Line represent the majority of the "stock market" and this is bullish overall. The S&P SmallCap AD Line ($SMLADP) is still lagging, but close to a new high.
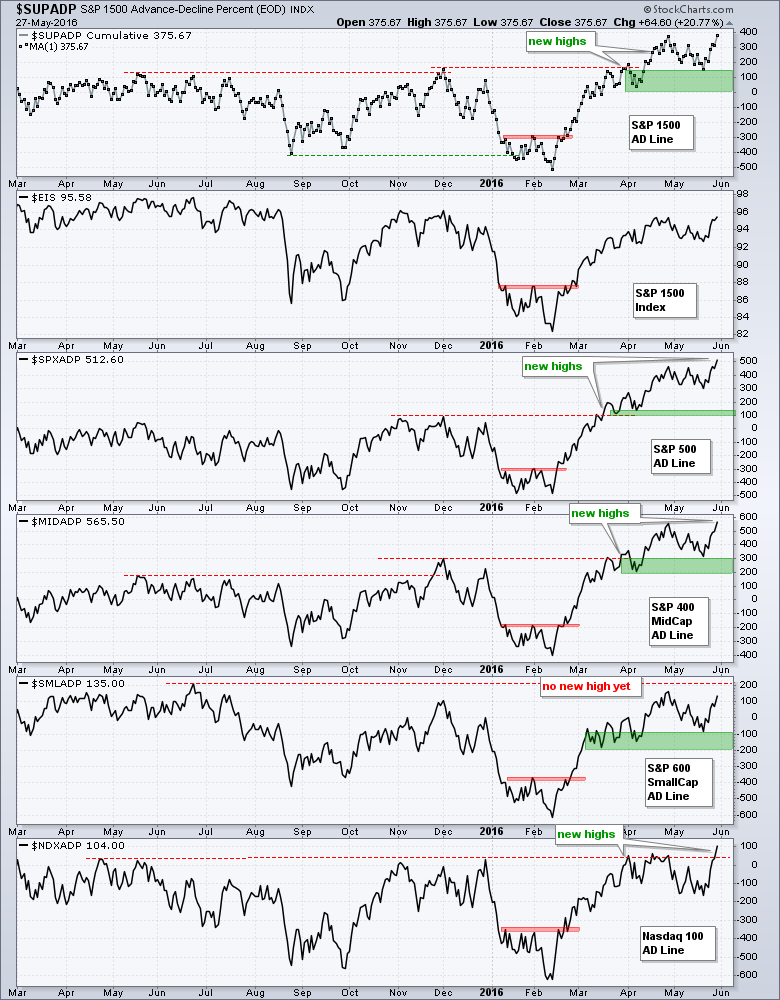
Short-term, the breakouts in SPY, QQQ and IWM held last week as the major index ETFs closed at their highs for the week. Basically, we have seen a strong surge over the last six days and this bodes well for continued strength. Last week's breakouts mean we are now out of pattern and currently in the midst of a move. There are basically two different price periods on the chart. Price is either "in pattern" with something developing or it is "in trend" with a directional move underway. For example, a security is "in pattern" when trading within a flag, channel and triangle. Last week's breakouts pushed many securities out of their patterns and into a directional move (in trend).
SPY Surges with Gaps
On the candlestick chart, SPY is up around 3% in six days with three gaps (20, 24 and 25 May). It may seem that the market is already short-term overbought, but the ability to become overbought is actually bullish because it reflects strong buying pressure. On the price chart, I would set my first watch level at 205 because a close below this level would fill the second gap.
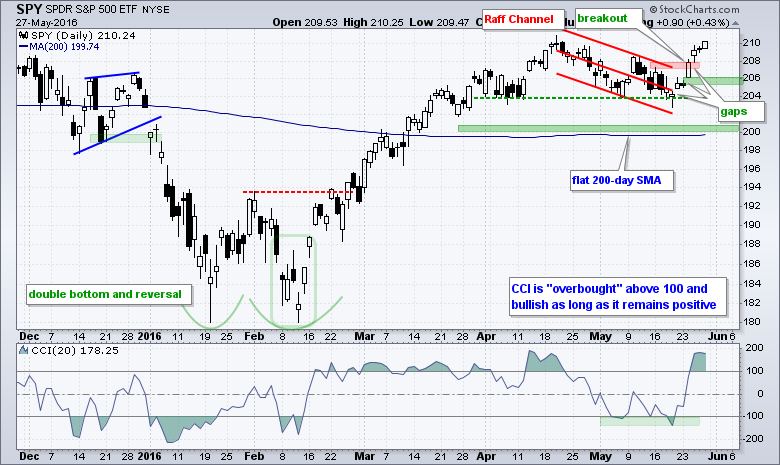
Chartists can also use CCI to identify signs of short-term weakness. Even at 20 days, CCI is still a pretty sensitive momentum oscillator that generates lots of signals. I would consider it a short-term indicator. CCI is currently near 180 and technically "overbought". While a move back below 100 would remove the overbought label, short-term momentum would still be net bullish as long as it remains positive.
Trading Strategy Using CCI and StochRSI (XLI example)
The Industrials SPDR (XLI) chart shows a trading strategy using CCI(20) and StochRSI(10). The bigger trend is up and a short-term setup materializes when CCI moves below -100 (oversold). This setup turns into a signal when StochRSI pops above .80 (dashed green line). The strategy is "in trade" right now and the 24-May gap is the first level to watch (call it 54.7). A close below this level would negate the signal.
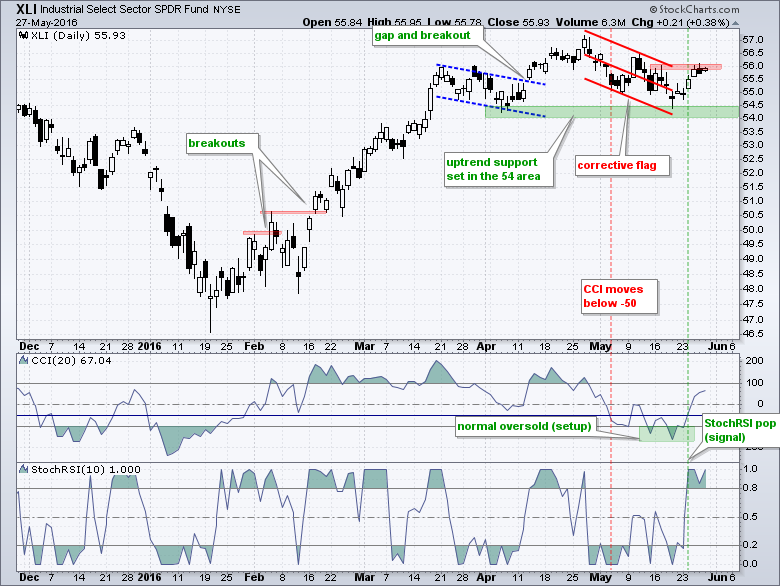
Short-term traders looking for a future exit signal can consider watching CCI, but only after it crosses above +100. I wait for a cross above +100 because this shows strong momentum. CCI is currently at 67 and needs to clear +100 before I would use it for an exit. There is no such thing as the perfect level, but I usually add a small buffer to prevent whipsaws around the zero line. For example, a move below -50 would suggest a pullback in the making and could be used for short-term exits. Notice that there was a gap-breakout on April 13th and this signal was valid until CCI moved below -50 on May 4th. Study the chart and see what works best for you!
QQQ Leads with Highest CCI Reading
QQQ retraced 38-50% of its February-April surge with a decline to the 104-105 area. The ETF was lagging in late April, but managed to firm in this area with two bounces. QQQ turned into a leader with last week's breakout and gaps. The middle gap is around 106.5 and I am marking my first watch level at 106. A close below this level would call for a re-evaluation of the breakout. Key support is set at 104.
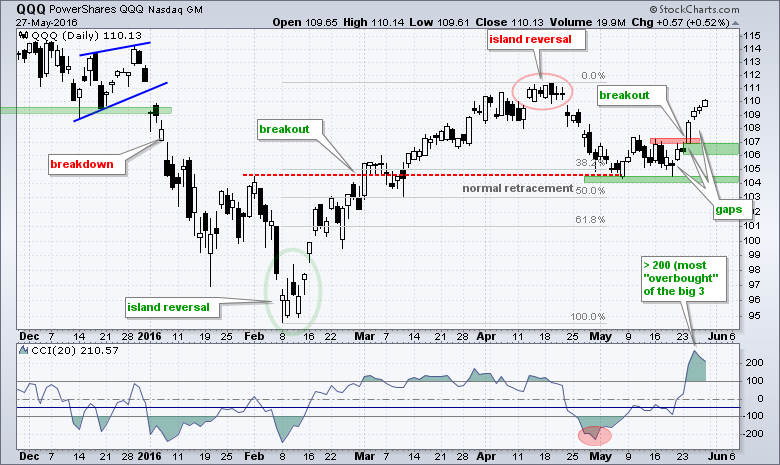
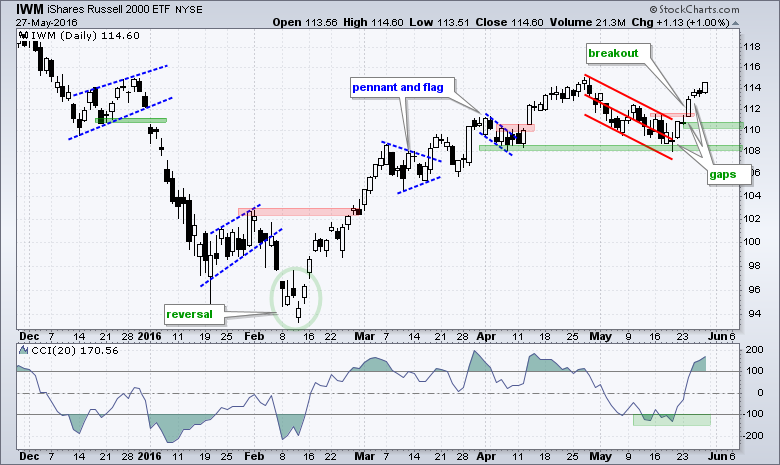
The indicator window shows CCI surging above +200 as QQQ became the most "overbought" of the big three (SPY, QQQ, IWM). This is also a sign of strength and I would consider momentum bullish as long as CCI holds above -50. The next chart shows IWM breaking out last week and closing above 114. First watch level is set at 110 and key support at 108.
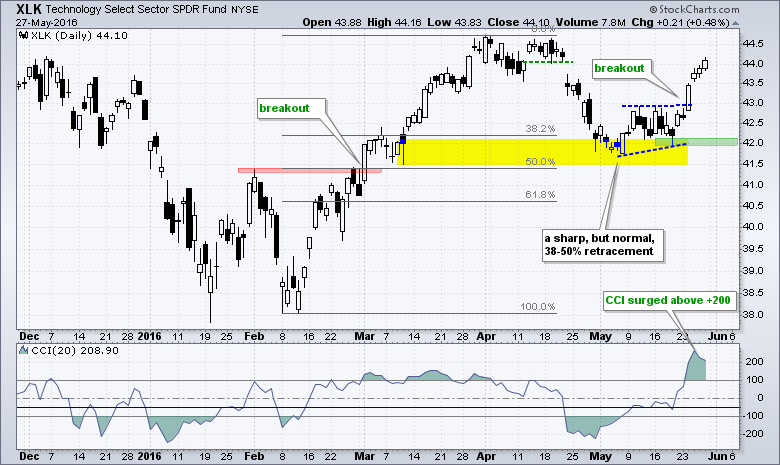
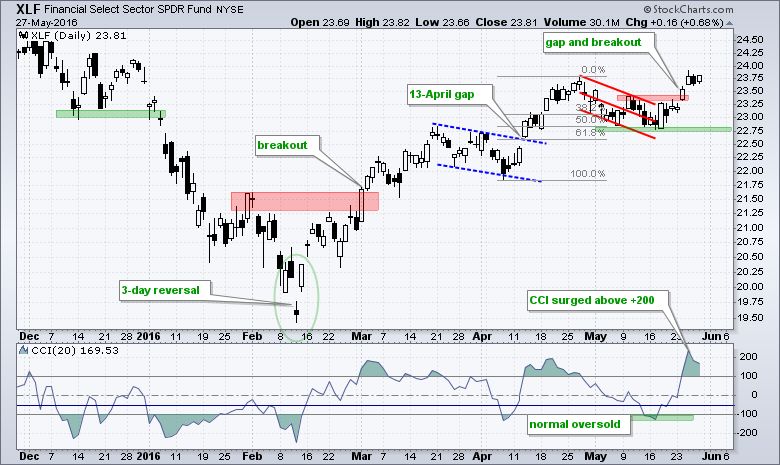
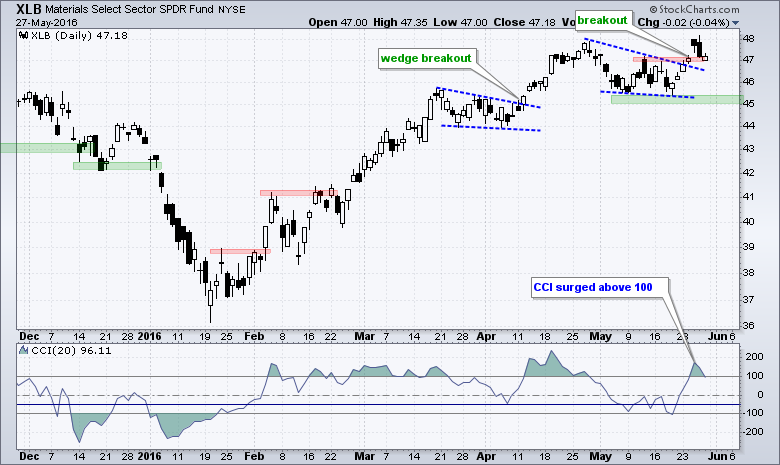
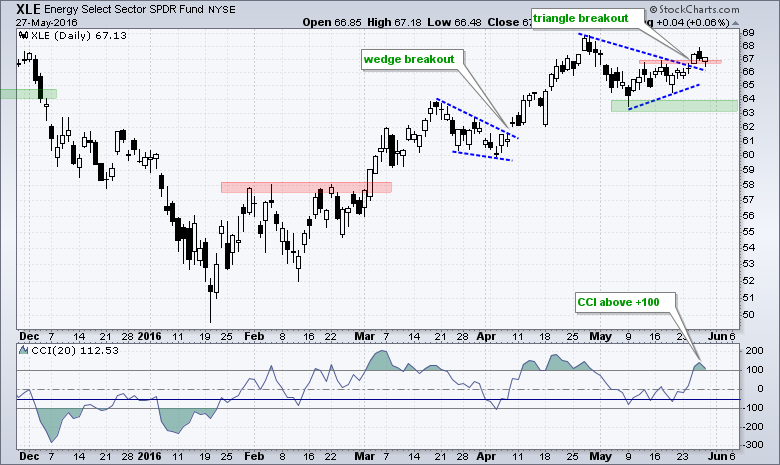
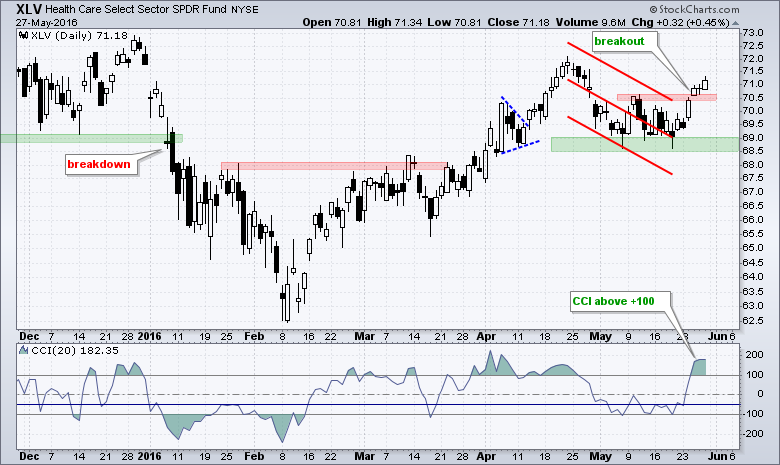
5 Sectors Spring to Life
There were quite a few sector breakouts backing up the broader market last week (XLK, XLF, XLV, XLB and XLE). This means five of the nine sectors, which account for 61% of SPY, have bullish signals working. XLI (10% of SPY) is close to a breakout. A breakout occurs when there is a corrective pattern and prices break above short-term resistance to reverse the short-term pullback. These breakouts signal a continuation of the bigger uptrend and green areas mark support. The next five charts show these breakouts and I am using CCI(20) for the first signs of weakness (move below -50).
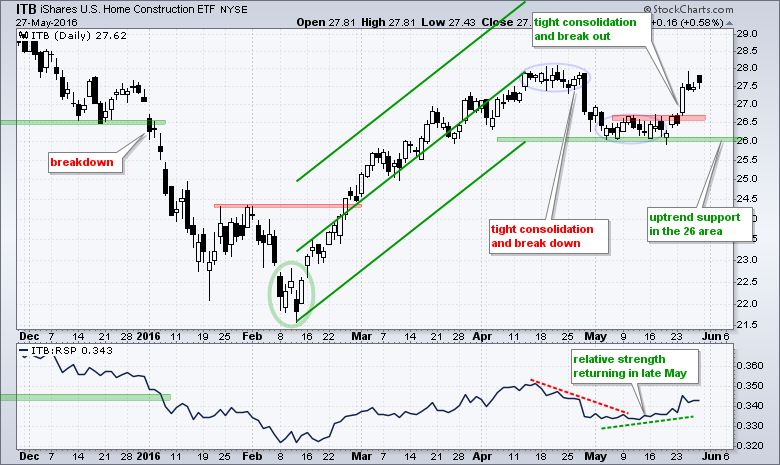
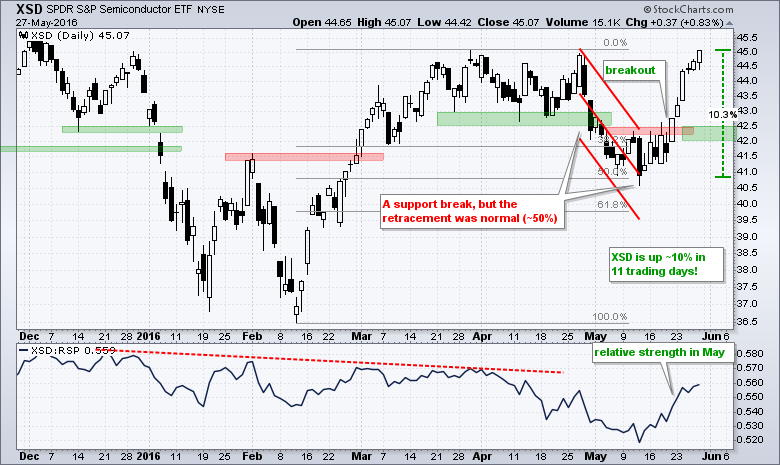
3 Industry Group Breakouts to Watch
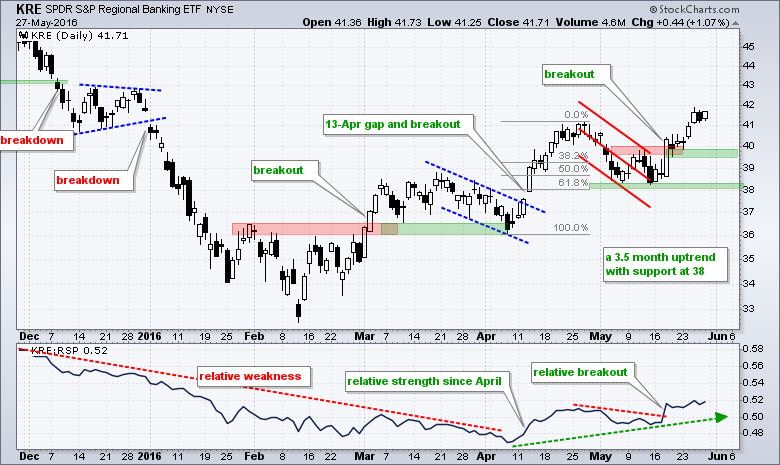
Recent breakouts in the Home Construction iShares (ITB), Semiconductor SPDR (XSD) and Regional Bank SPDR (KRE) are also bullish for the market overall. Even though the Retail SPDR (XRT) is dragging and the EW Consumer Discretionary ETF (RCD) is the weakest sector, I am impressed with the breakouts in ITB and XSD. Housing and semiconductors represent two cyclical groups. Strength in these two at least serves as a counter-weight to weakness in retail and the consumer discretionary sector. A breakout in KRE is good for the finance sector and this breakout suggests that Treasury yields are moving higher. I view rising yields as bullish for stocks because it means the economy is strong enough for yields to return to normal levels. I would be quite concerned if the bond market ignored Fed jawboning and Treasury bonds moved higher (yields lower).
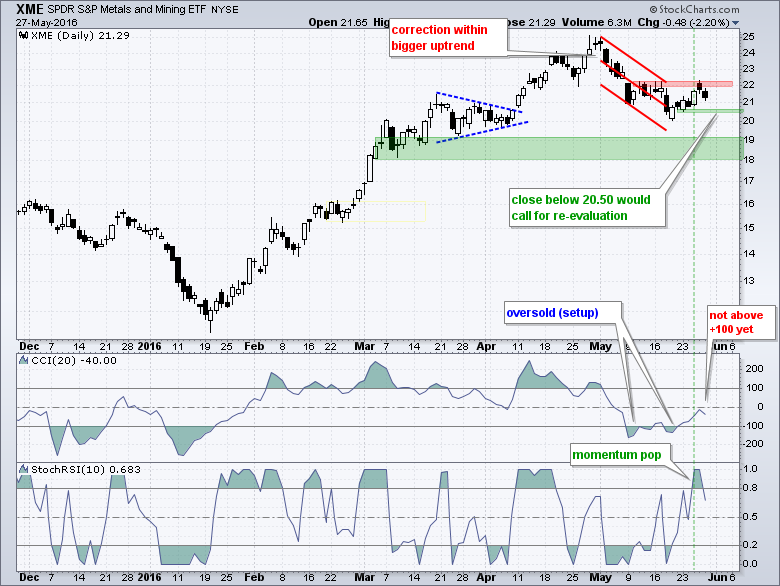
XME and GDX Become Short-term Oversold
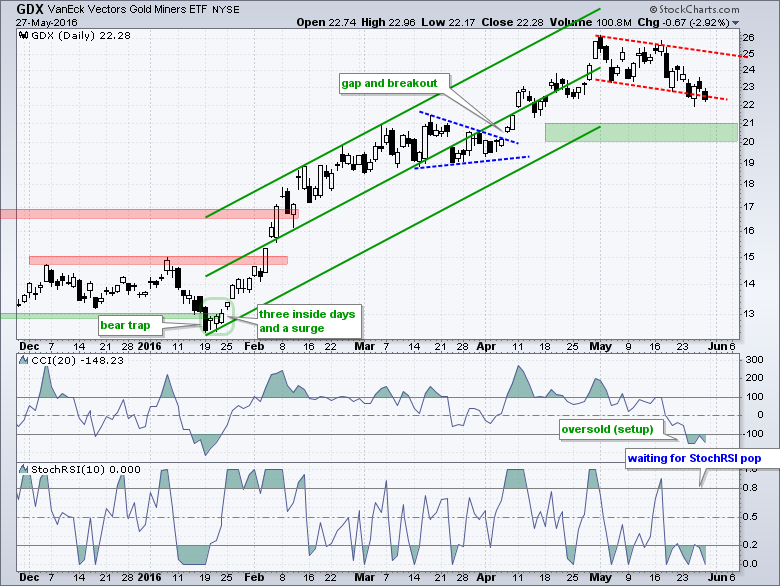
The next two industry group ETFs come from the materials sector, which is one of the stronger sectors overall. Note that the Metals & Mining SPDR (XME) and Gold Miners ETF (GDX) led the market higher from mid January to late April, but lagged in May. Nevertheless, I still think the bigger trends are up and this means I am looking for short-term oversold setups. CCI moved below -100 for XME over the last two weeks and StochRSI popped above .80 last week. This is a bullish signal for the indicators and I am marking 20.50 as the first re-evaluation level.
GDX became oversold last week, but has yet to trigger a bullish signal with a momentum pop (StochRSI > .80). This is the first signal to watch.
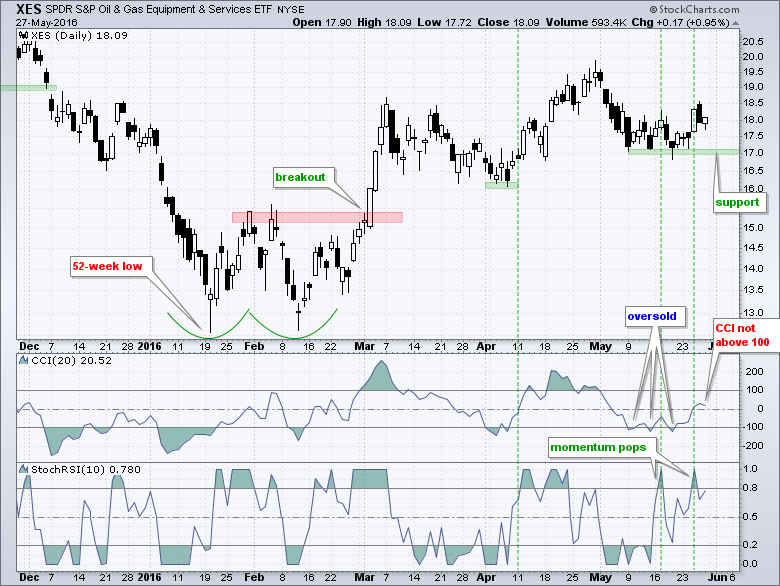
The Oil & Gas Equip & Services SPDR (XES) is part of the energy sector and tied to oil, which remains in an uptrend the last four months. XES became oversold over the last two weeks as CCI dipped below -100 three times and StochRSI popped twice for bullish signals. On the price chart, the ETF bounced off support and a close below 17 would call for a re-evaluation.
******************************************************
Measuring Risk On-Risk Off - Using charts to quantify stock, economic and credit risk.
PPO Trading Strategy - How to use 3 PPOs to develop a trend-reversion trading strategy.
Long-term Trend Indicators - Using the PPO, EMA Slope and CCI to determine the trend.
ETF Master ChartPack - 300+ ETFs organized in a Master ChartList and in individual groups.
Follow me on Twitter @arthurhill - Keep up with my 140 character commentaries.
****************************************
Thanks for tuning in and have a good day!
--Arthur Hill CMT
Plan your Trade and Trade your Plan
*****************************************


