Small and Mid Caps Lead // SPY and QQQ Remain In Trend // IWM Leads with Higher High // Utes and Staples Lag, but don't Exactly Drag // Technology Leads New High List // HACK Challenges Prior Highs // 10-YR Treasury Yield Winds Tight // A Small Decline on High Volume // 10 Stocks with Bullish Setups //// ...
Small and Mid Caps Lead
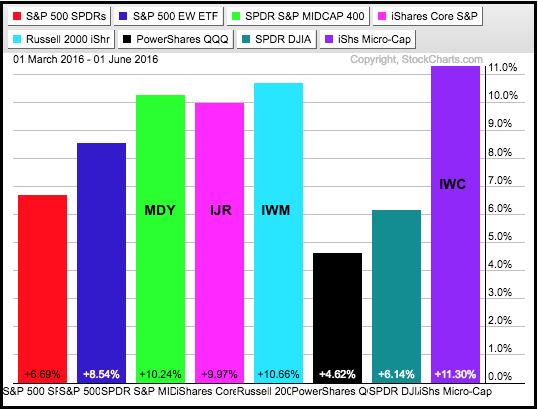
The market environment remains bullish and the appetite for risk appears strong. The PerfChart below shows the three month gains for eight major index ETFs. Notice that the S&P MidCap SPDR (MDY), the S&P SmallCap iShares (IJR), the Russell 2000 iShares (IWM) and the Russell MicroCap iShares (IWC) are leading the pack with double-digit gains. Ok, IJR is up 9.97%, but I will round to 10%. The other ETFs show respectable gains, but upside leadership clearly favors smaller stocks. Small-caps have higher betas and are generally more risky than large-caps. Thus, relative strength in this group suggest a risk-on environment for the stock market overall. These same ETFs are also leading over the last eight days.
SPY and QQQ Remain In Trend
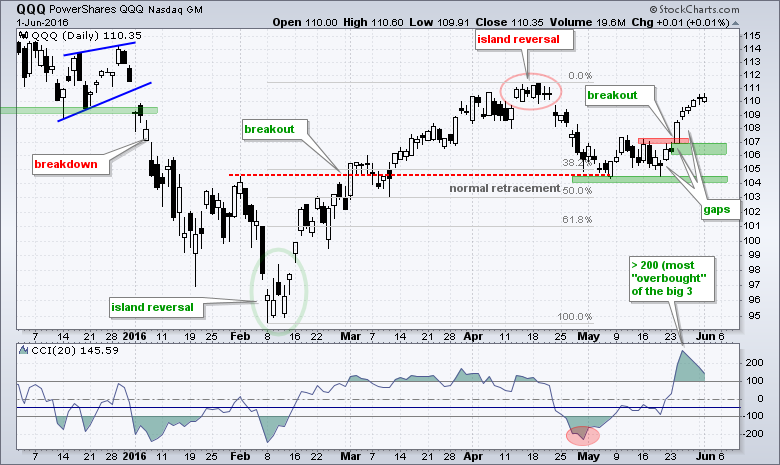
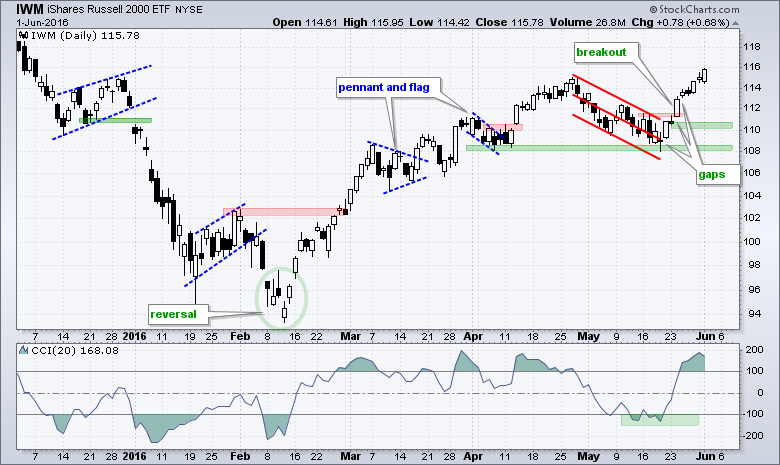
There is no change on the daily charts for SPY, QQQ and IWM. All three are up rather sharply the last eight days and currently "in trend" (post breakout). The initial moves started with the gaps on 20-May, continued with the StochRSI pops on 24-May and confirmed with breaks above the early May highs.
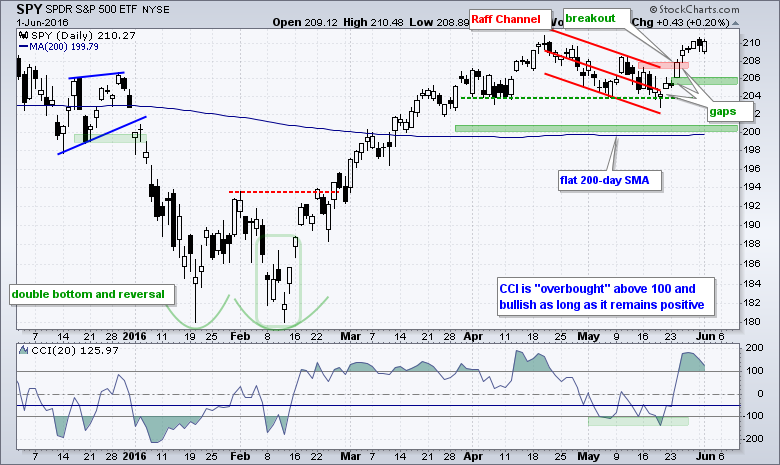
The 24-May gap marks the first key level to watch for signs of a breakout failure (highest green zone). The ETFs are a bit extended after this eight day run and I will allow some room for pullback. Remember, overextended and overbought conditions are more bullish than bearish because they reflect strong buying pressure. True support is set at the May lows with the lower green zone. A break here would reverse the uptrends that began with the February breakouts
IWM Leads with Higher High
IWM is the only one of the three trading above its April high and the clear leader right now. All three charts show the 20-period Commodity Channel Index (CCI) moving above 100 last week. I view momentum as bullish as long as this indicator remains positive. While a move below zero would be negative, I am setting my bearish threshold with a buffer at -50 and would re-evaluate on a move below this level.
Utes and Staples Lag, but don't Exactly Drag
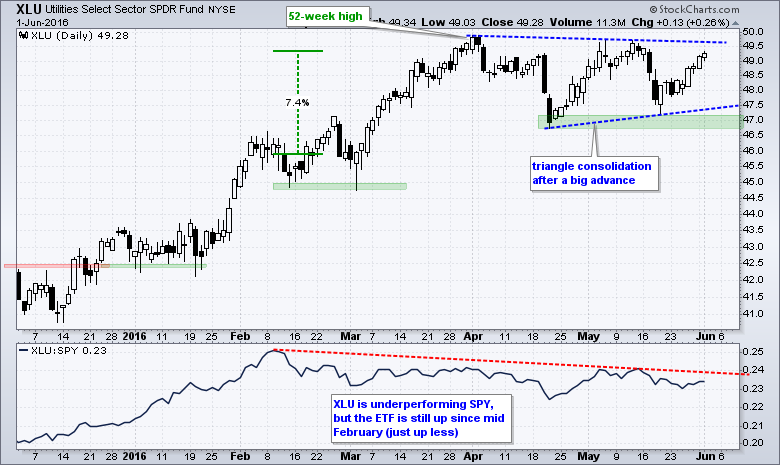
The sectors remain supportive of the current uptrend in the major index ETFs. I noted breakouts in five key sector SPDRs on Tuesday (XLK, XLF, XLB, XLE, XLV), and also noted that XLI is close to a breakout. SPY can move higher as long as the sectors in uptrends account for more than 50% of the ETF. The five sectors with recent breakouts account for 61% of SPY. In addition, note that the other four sectors are not exactly weak because they are within 3% of a 52-week high (XLI, XLU, XLP, XLY).
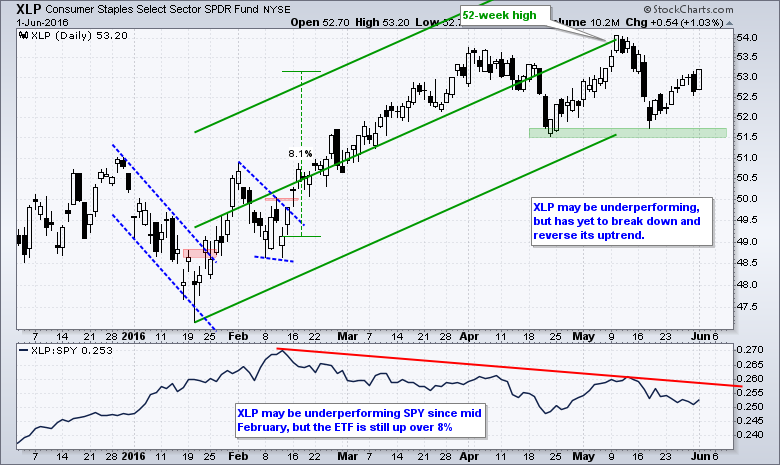
Mid February marked a move to the riskier side of the stock market as the Consumer Staples SPDR (XLP) and Utilities SPDR (XLU) started underperforming SPY. Even though these two are underperforming, they are not actually down and both are contributing to gains in SPY. Relative weakness and absolute weakness are two different things. The May lows mark key support for the nine sectors and I will remain bullish on SPY until at least four sectors break these may lows. As an aside, note that the small-cap consumer staples, finance, technology and utilities sector ETFs hit new highs this week (PSCC, PSCF, PSCT, PSCU)
Technology Leads New High List
Technology High-Low% ($XLKHLP) is the highest of the nine sectors. High-Low Percent = (New Highs - New Lows) / Total Issues. The indicator is positive when new highs outpace new lows and negative when new lows outpace new highs. A move above +10% is deemed bullish and this signal remains bullish until a move below -10%, which is bearish. The indicator turned bullish in mid March and remains bullish. Notice that High-Low Percent exceeded +10% each of the last five days. New highs show upside leadership and the sector with the most new highs is clearly a leader.
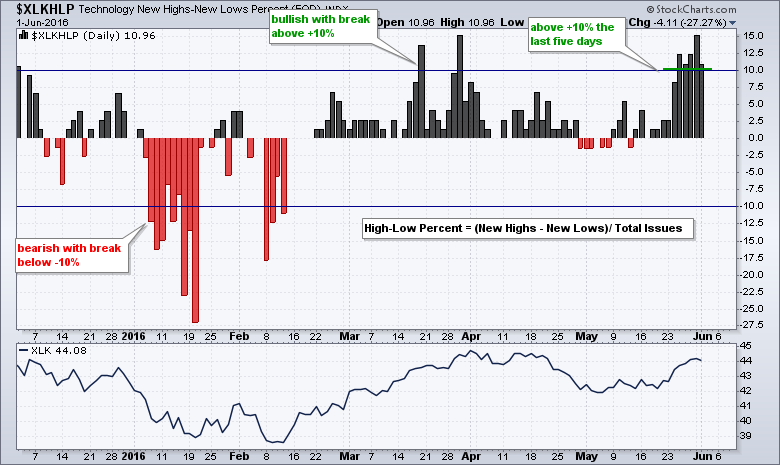
Note: StockCharts calculates High-Low Percent for the nine sectors SPDRs and several other indexes. Simply change the root symbol to see the other sectors. $XLKHLP is for the Technology SPDR and $XLVHLP is for the HealthCare SPDR. Here is a complete list.
HACK Challenges Prior Highs
I was watching the Cyber Security ETF (HACK) in April and pointed out the breakout in mid April. HACK was showing leadership at the time and Aroon Up hit 100 for a bullish signal. The signal did not pan out because HACK declined below the mid April low with a gap down in early May. This gap did not pan out either as the ETF immediately firmed and broke out in mid May. Aroon Up followed through with a bullish cross in late May and move to 100. It is frustrating for a trader, but this puts HACK back in bull mode. The blue rectangle is looking line a big consolidation and HACK is on the verge of hitting a multi-month high.
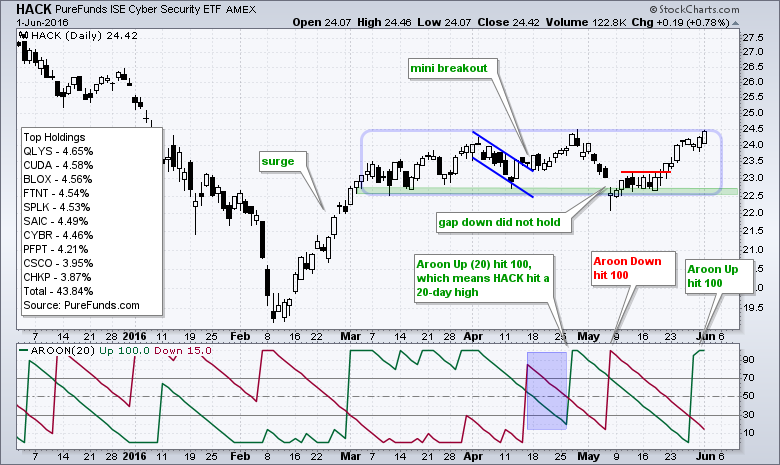
Marking support and resistance levels for ETFs and indexes is really a challenge because they have so many moving parts (component stocks). The more components there are, the bigger the challenge. The volatility of the components can also wreak havoc on alleged support and resistance levels. Just because the ETF is near its prior lows and at potential support does not mean the majority of its components are at support. It is the components that drive the ETF, not the other way around. It is, therefore, paramount that chartists know the key drivers for their ETFs. At the very least, look at the top ten components for guidance.
10-YR Treasury Yield Winds Tight
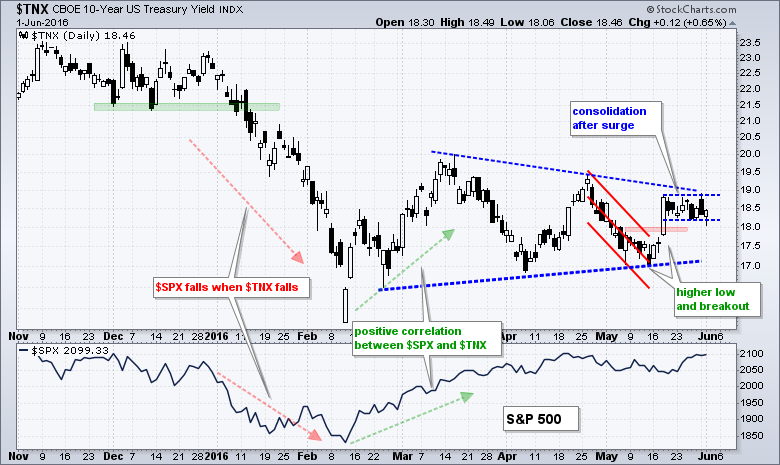
The bond market is holding its breadth as the employment report looms on Friday. I have no idea what the number will be and I have no idea how the market will react. Here is what will happen. The number will come out, the market will react and the media will THEN find the best story to fit the reaction. On the chart, the 10-YR Treasury Yield ($TNX) has been stuck in a trading range since February and the noose is tightening. The yield surged in mid May and then moved into a smaller trading range. Allowing for a little volatility, I will be watching 18 and 19 for the break (1.8% and 1.9%). An upside break in yields would be bearish for bonds, while a downside break would be bullish. Also note that an upside breakout in yields would be positive for stocks, especially the finance sector.
A Small Decline on High Volume
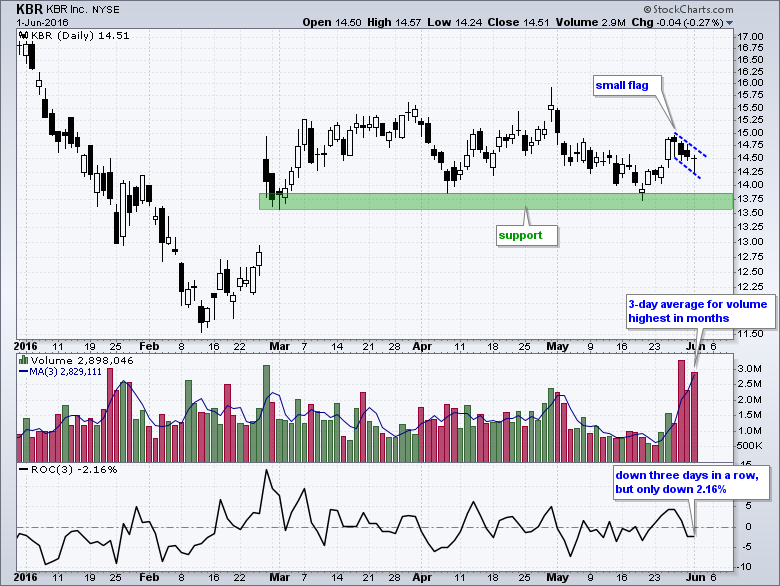
I am highlighting the chart below because I thought it was quite interesting how the stock fell on the highest volume in months, but only fell 2.16% in three days. In other words, the high volume sell off did not translate into a big price decline. Remember, there is a buyer for every seller so this means there are a lot of new owners over the last three days. Things that make you go ...hmmmm.
10 Stocks with Bullish Setups
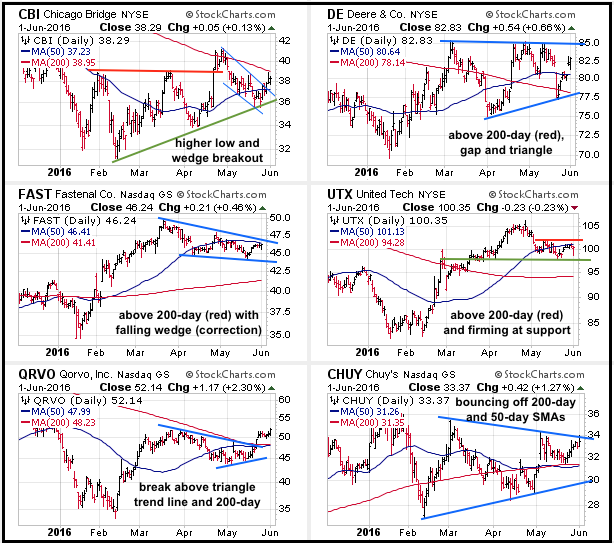
The next images show ten stocks with bullish setups using CandleGlance charts. These are just some simple charts with setups that I find interesting. Be sure to conduct your down due diligence.
******************************************************
Measuring Risk On-Risk Off - Using charts to quantify stock, economic and credit risk.
PPO Trading Strategy - How to use 3 PPOs to develop a trend-reversion trading strategy.
Long-term Trend Indicators - Using the PPO, EMA Slope and CCI to determine the trend.
ETF Master ChartPack - 300+ ETFs organized in a Master ChartList and in individual groups.
Follow me on Twitter @arthurhill - Keep up with my 140 character commentaries.
****************************************
Thanks for tuning in and have a good day!
--Arthur Hill CMT
Plan your Trade and Trade your Plan
*****************************************


