Small and Micros Lead the Way // Sector Performance Says Risk On // Gaps Fuel the Breakouts in QQQ, SPY and IWM // Materials and Finance Lead Sector SPDRs // Equal-weight Finance Leads with Higher High // Metals & Mining SPDR Gets Momentum Pop // Oil & Gas Equip & Services SPDR Surges off Support // Scanning for Pullbacks within an Uptrend // Four Stocks with Pullbacks and Pops // ....
Small and Micros Lead the Way
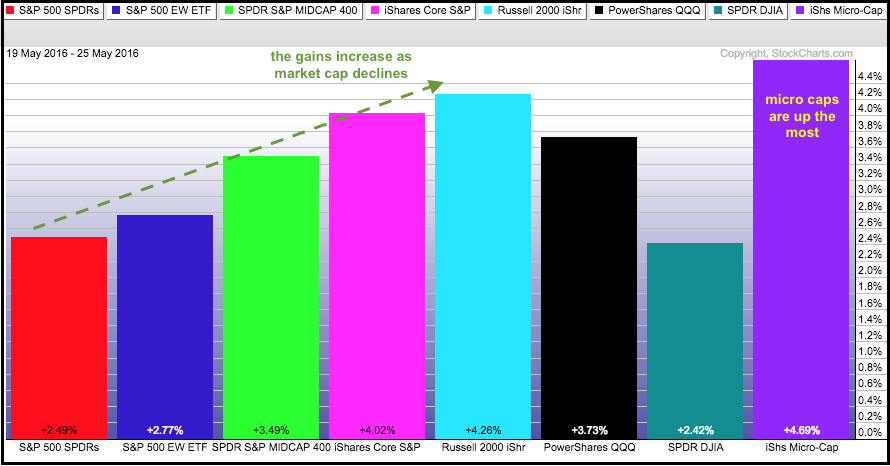
It was off to the races over the last four days as the major index ETFs surged across the board. On the PerfChart below, the first five bars in the histogram reflect the move to riskier stocks. SPY is red, the EW S&P 500 ETF is blue, the S&P MidCap SPDR is bright green, the S&P SmallCap iShares is pink and the Russell 2000 iShares is teal. Notice how SPY is up 2.5% and the percentage change grows as the market cap declines. Small-caps have higher betas and more risk than large-caps. Relative strength in small-caps means the risk appetite for stocks is strong and this is bullish overall.
Sector Performance Says Risk On
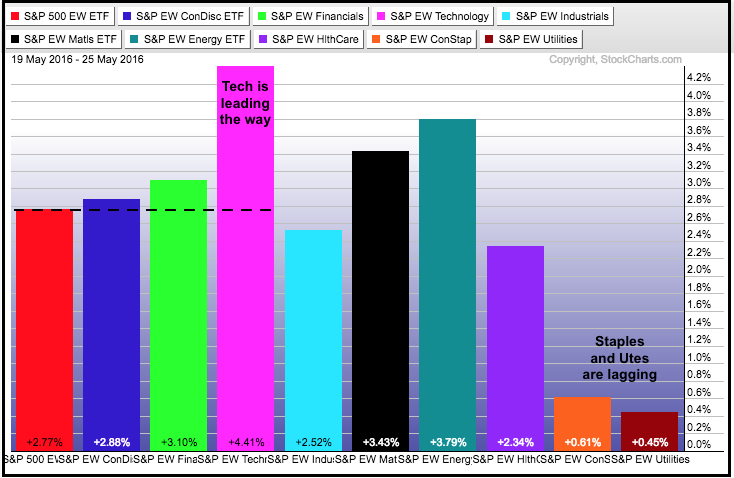
This tale of risk-on extends when we look at equal-weight sector performance this week. Technology (pink) is the clear leader with a 4.41% gain. The consumer discretionary (blue) and finance (bright green) are also outperforming the broader market. Consumer staples (orange) and utilities (burgundy), which are the defensive sectors, are seriously underperforming. Healthcare (purple) is also underperforming, but up a respectable 2.34% this week thanks to a rebound in biotech.
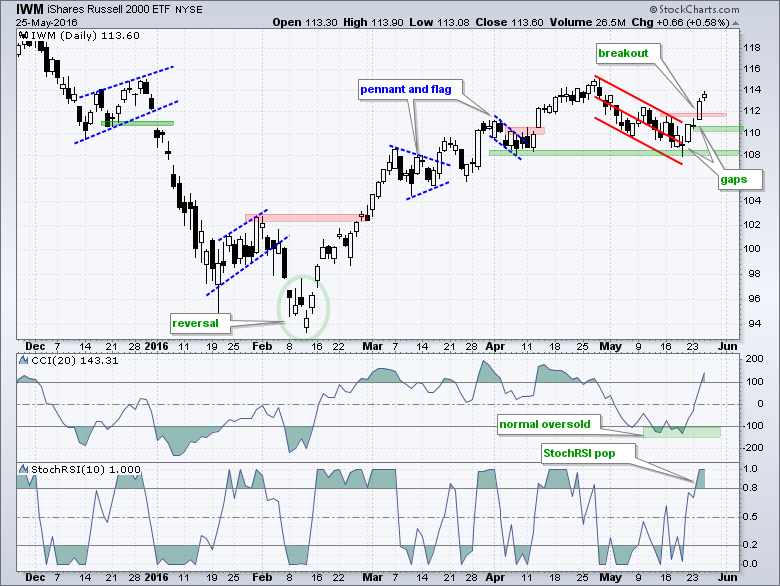
Gaps Fuel the Breakouts in QQQ, SPY and IWM
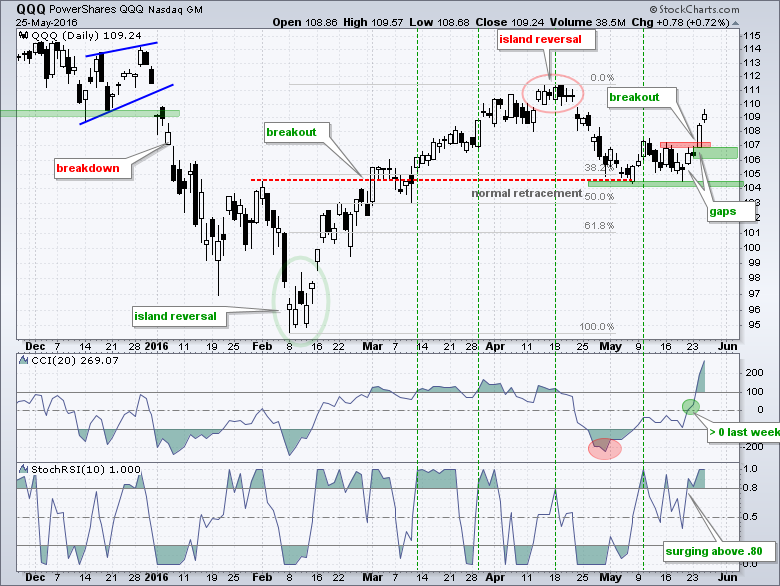
Even though QQQ took a hard hit in April, the ETF started showing signs of strength in May and led the market this week. Early signs of strength included CCI turning positive last week and StochRSI surging above .80 three times since mid May. On the price chart, QQQ clearly broke out and this breakout is bullish as long as it holds. Chartists can mark short-term support at 106 and medium-term support at 104.
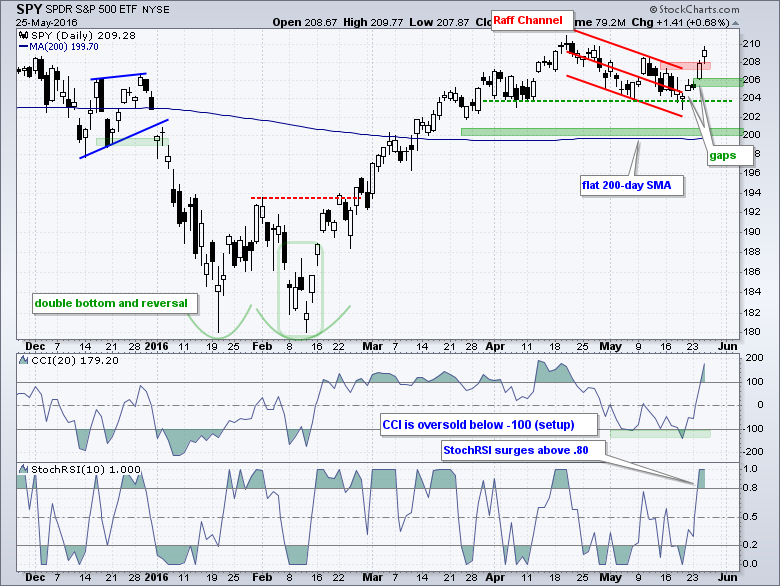
I talked about pulling the trigger on Tuesday and used SPY as an example. Short-term traders need to watch price action closely because indicator signals can lag, especially indicators that have any kind of smoothing, such as PPO (5,30,5). SPY gapped up last Friday and this was the first sign of a short-term reversal. The ETF gapped up again on Tuesday and StochRSI surged above .80 for a momentum pop. These were the next two bullish signs. SPY broke above resistance at 208 on Wednesday for the third bullish sign. It is now time to watch for bearish signs that would start to prove the bullish case wrong. First up, I am watching Wednesday's gap and marking support at 205. A close below this level would negate the most recent breakout and fill the second gap.
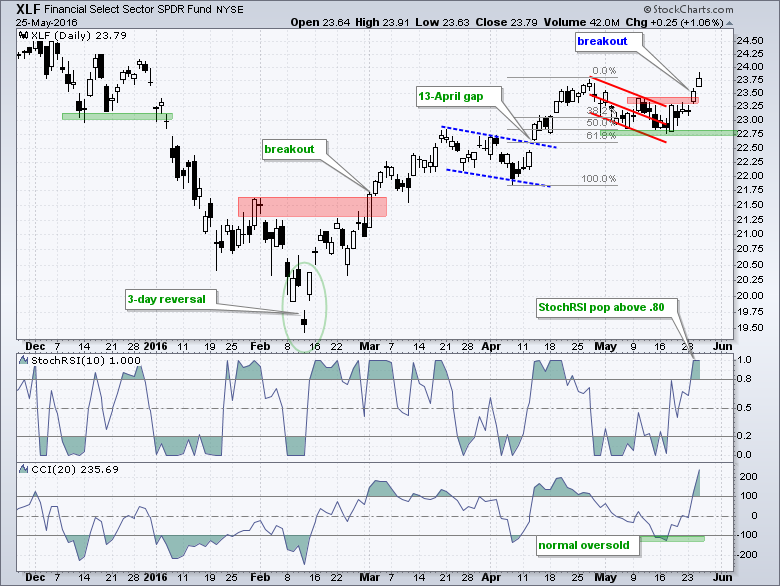
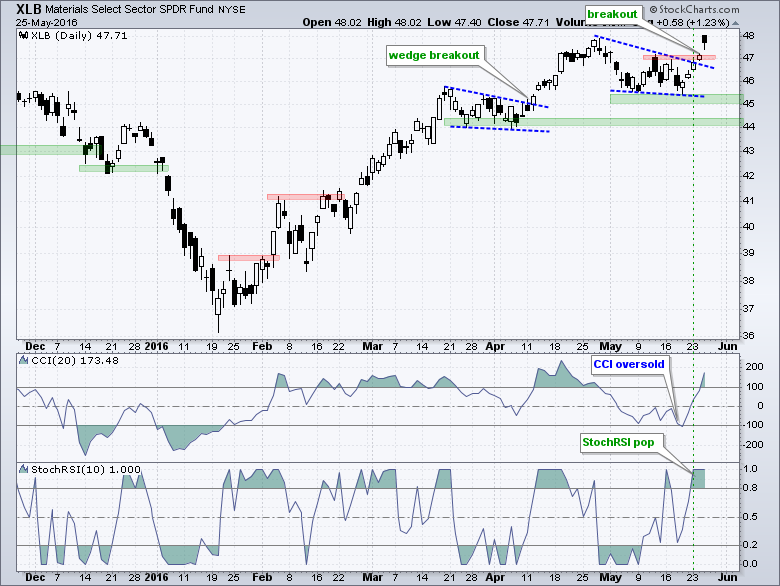
Materials and Finance Lead Sector SPDRs
XLF and XLB are showing chart leadership because they are the first sector SPDRs to clear their April highs. The April highs are "benchmark" highs that chartists can use for comparison purposes. Stocks and ETFs above their April highs show relative "chart" strength and are leading the market. The chart below shows XLF with CCI and StochRSI. CCI became oversold last week and StochRSI popped above .80 on Tuesday. CCI is now above 200 and at its highest level in over six months. This extreme overbought reading shows a lot of power in the current move.
XLB became oversold when CCI dipped below -100 last week and StochRSI popped with a move above .80 on Monday. This is a short-term signal that requires a day-to-day watch (not necessarily intraday though!). Chartists have to consider two things when in a long position: when to take a loss and when to take a profit. In short, we have to think about the exit once we are in a position. CCI can be used for an exit strategy now that it has surged above +100, which is a sign of strength. A CCI close below zero would show some underlying weakness and could be used for an exit strategy.
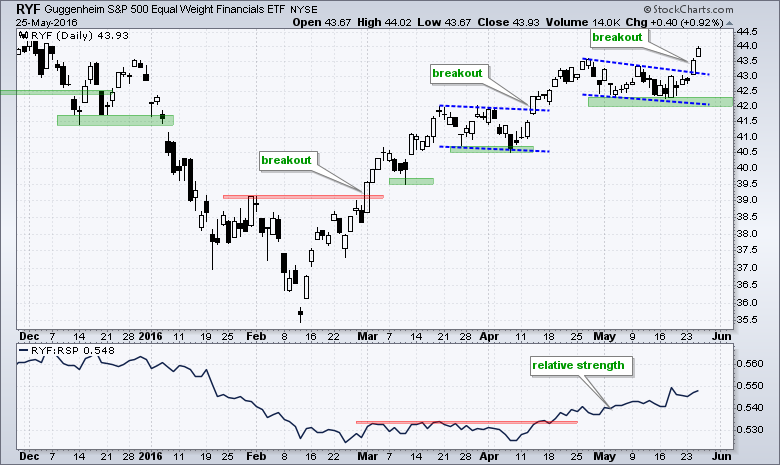
Equal-weight Finance Leads with Higher High
Of the nine equal-weight sector ETFs, the EW Finance ETF (RYF) is the only one above its April high and this sector shows the most strength. Equal-weight sectors provide a better picture for sector performance as a whole. The SPDRs, on the other hand, are dominated by large-cap stocks and reflect large-cap performance. Also notice that the RYF:RSP ratio broke out in mid April and remains in an uptrend (relative strength).
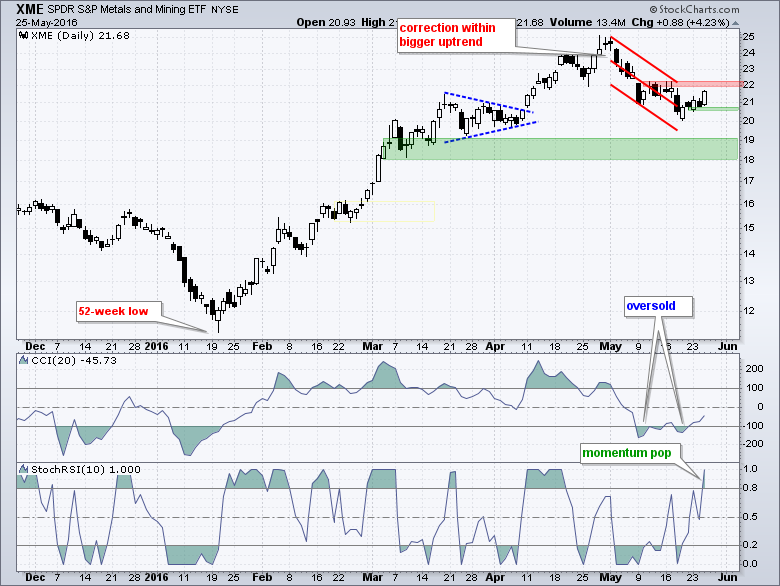
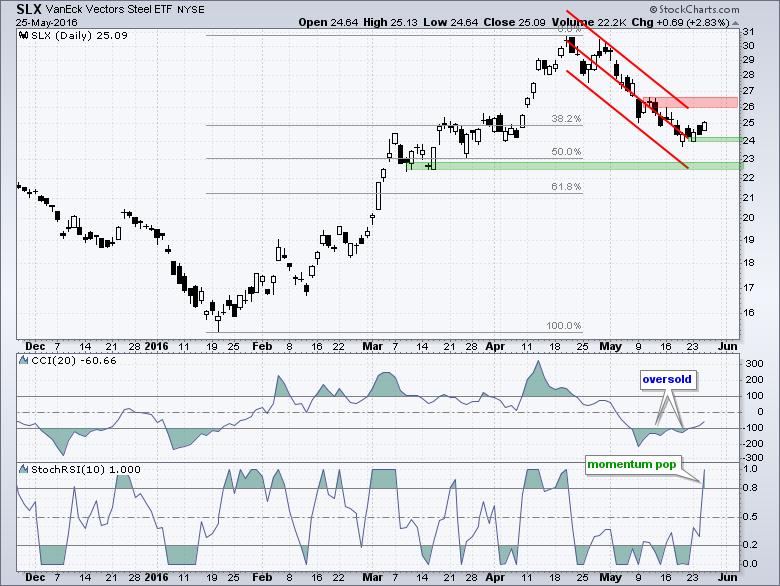
Metals & Mining SPDR Gets Momentum Pop
The Metals & Mining SPDR (XME) and Steel ETF (SLX) are still lagging over the last few weeks because they remain below their mid May highs. These two were leading in April though. Both are at an interesting juncture because the long-term trends are up and they became short-term oversold recently (CCI < -100). Also notice that StochRSI popped above .80 on Wednesday. This momentum pop is the first short-term bullish sign. CCI remains below zero and the ETF is below resistance at 22 so the short-term trend is still down. I would mark first support at 20.50 and consider this a failed pop on a close below this level. The second chart shows SLX with first support at 24.
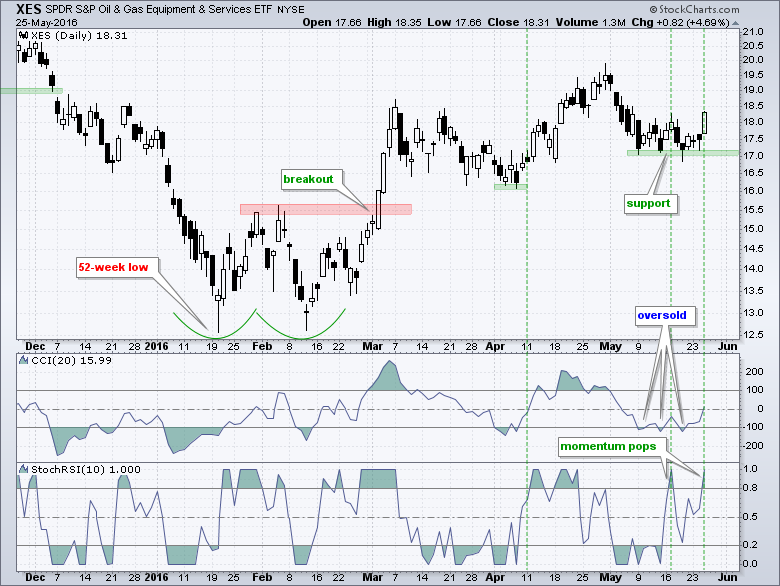
Oil & Gas Equip & Services SPDR Surges off Support
The next chart shows XES becoming oversold three times and getting two momentum pops in the last two weeks. There is a clear support level at 17 to watch for signs of a failure.
Scanning for Pullbacks within an Uptrend
I ran a scan looking for stocks that fit the criteria for a pullback within an uptrend. As the scan code shows, I am looking for three things. First, the 5-day SMA is above the 200-day SMA (long-term uptrend). Second, CCI(10) and %B(20,2) became oversold in the last two weeks (short-term pullback). Third, StochRSI surged above .70 on Wednesday (momentum pop - almost). I used .70 instead of .80 because I want to include stocks that almost made it. I then look at the charts for further analysis. Here is the code:
[group is SP500] or [group is SP400] or [group is SP600] // looking for stocks
and [SMA(5, close) > SMA(200,close)] // long term trend is up
and [Min(10,CCI(20)) < -100] // pullback over the last two weeks
and [Min(10,%B(20,2)) < .25] // pullback over the last two weeksand [Stoch RSI(10) x .70] // momentum pop
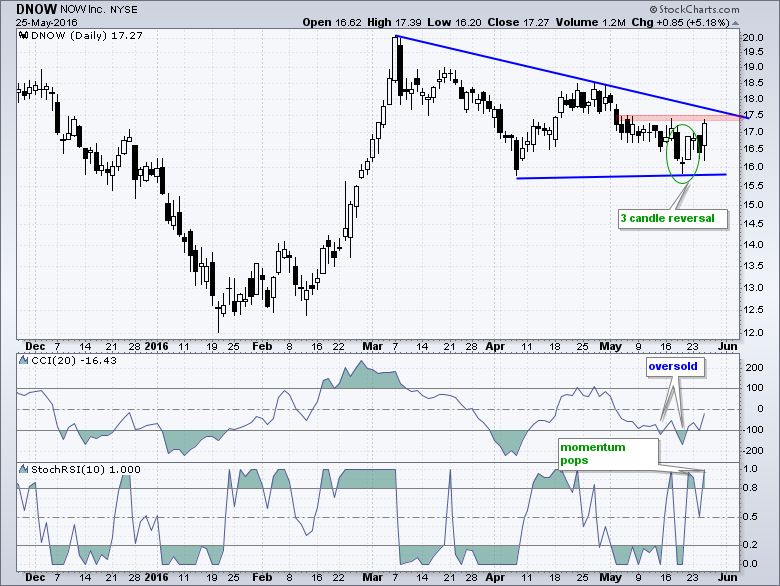
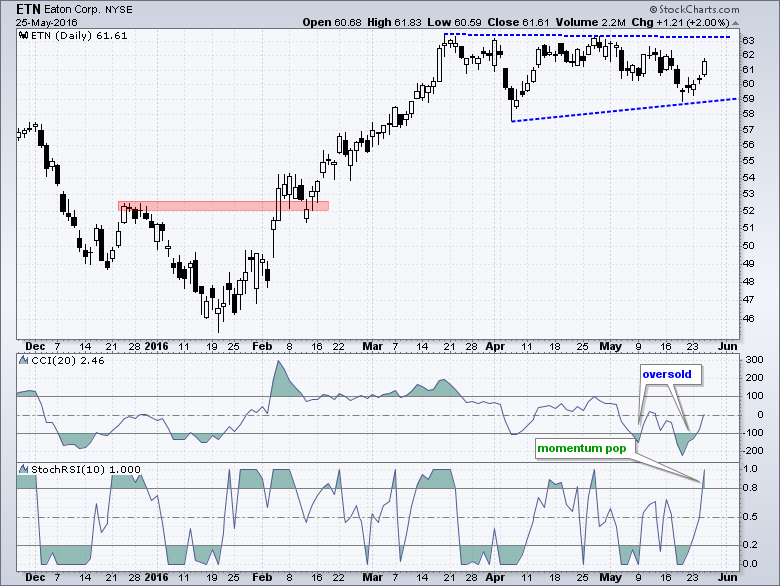
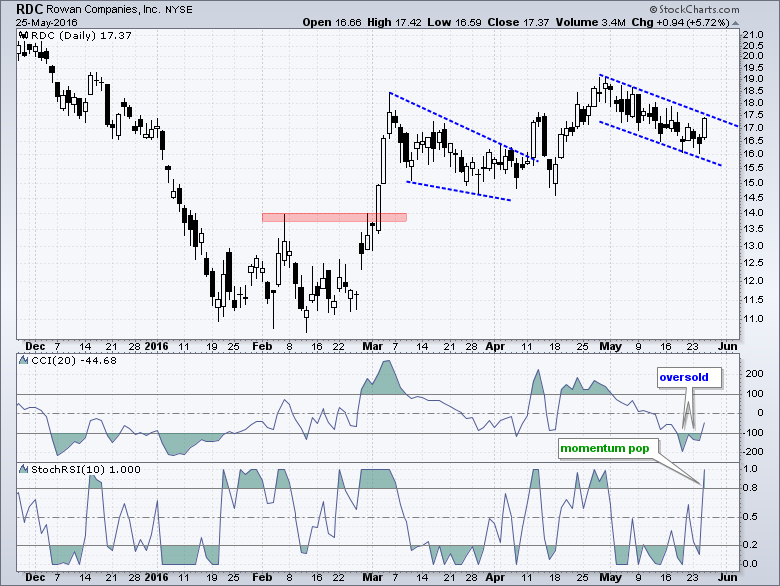
Four Stocks with Pullbacks and Pops
******************************************************
Measuring Risk On-Risk Off - Using charts to quantify stock, economic and credit risk.
PPO Trading Strategy - How to use 3 PPOs to develop a trend-reversion trading strategy.
Long-term Trend Indicators - Using the PPO, EMA Slope and CCI to determine the trend.
ETF Master ChartPack - 300+ ETFs organized in a Master ChartList and in individual groups.
Follow me on Twitter @arthurhill - Keep up with my 140 character commentaries.
****************************************
Thanks for tuning in and have a good day!
--Arthur Hill CMT
Plan your Trade and Trade your Plan
*****************************************


