 ÂÂ
ÂÂ
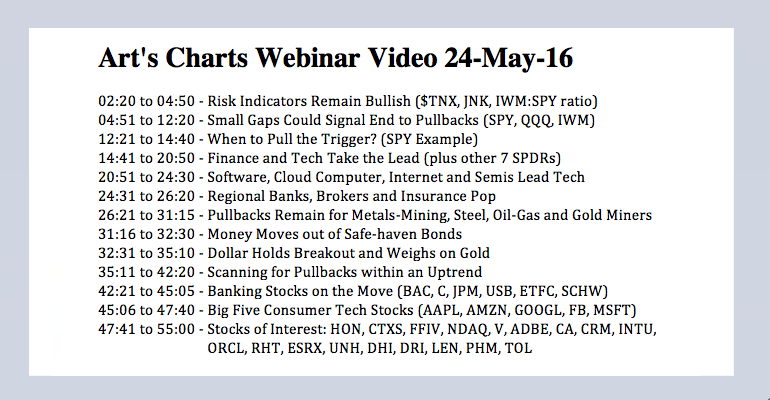
Small Gaps Could Signal End to Pullbacks // When to Pull the Trigger? // Money Moves out of Safe-haven Bonds // Finance Remains in the Spotlight // Regional Banks Take the Lead // Webinar Preview //// ...........
Small Gaps Could Signal End to Pullbacks
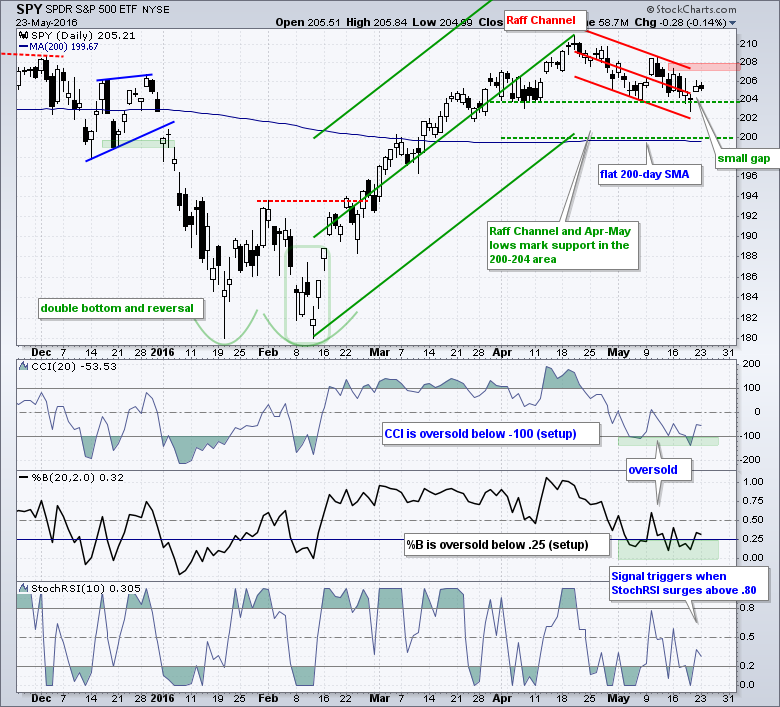
The short-term trends remain down, but I am seeing signs that these pullbacks are ending and breakouts could be in the making. The charts for SPY, QQQ and IWM show CCI, %B and StochRSI. I use CCI and %B to identify short-term oversold conditions within a bigger uptrend. Yes, I am assuming that the bigger trend is up and the decline over the last few weeks is a correction within that uptrend. CCI becomes oversold with a move below -100 and %B becomes oversold with a move below .25. As you will see on the charts, the line shapes for these indicators are about the same. Once these become oversold, StochRSI is used to identify a short-term momentum pop. You can read about these indicators in our ChartSchool.
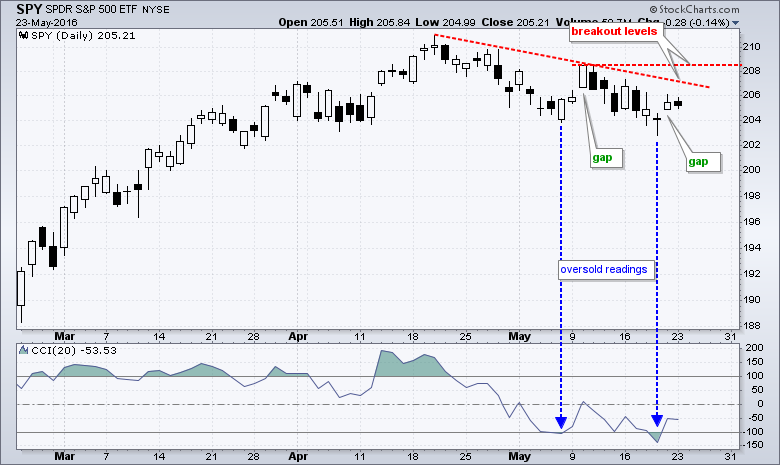
SPY firmed at the top of its support zone (200-204) on Thursday, gapped up on Friday and stalled on Monday. The gap is holding and this is the first bullish sign. A close below 204 would fill the gap and negate this gap. The Raff Regression Channel and last week's highs mark resistance in the 207-208 area. A breakout here is needed to fully reverse the five week slide. The indicator windows show CCI and %B becoming oversold and StochRSI falling short of a momentum pop. As the Stochastic Oscillator of RSI, a break above .80 would signal a breakout of sorts in RSI. Such a signal would add to the gap up and increase the chances of a breakout at 208.
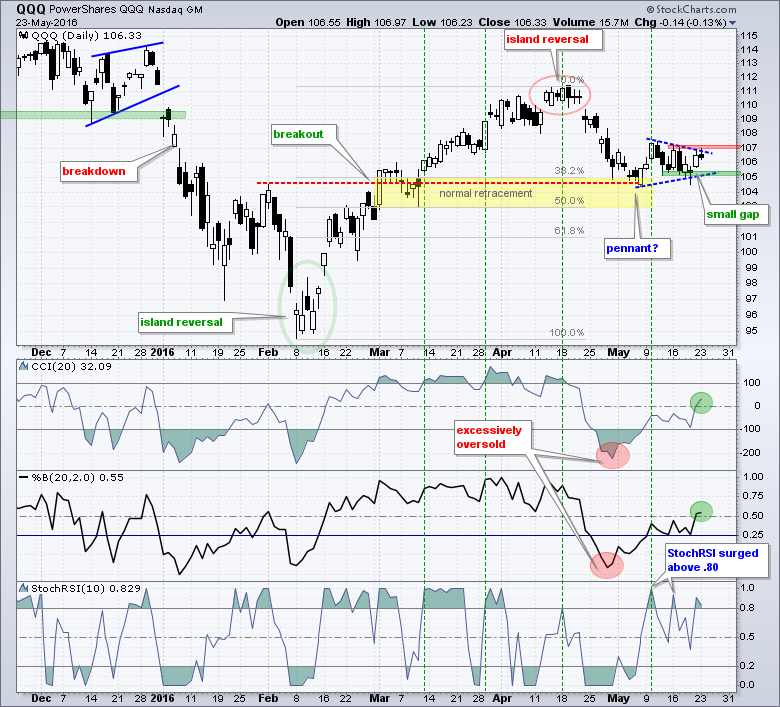
The QQQ chart is a bit busy, but there is a lot to say. First, CCI and %B became excessively oversold with moves below -200 and 0, respectively. Even so, notice that QQQ retraced 38-50% of the prior advance and firmed near broken resistance (red line). While I would not expect the indicators to dip to such extremes on a normal pullback, the depth of the retracement (~38%) is normal so perhaps this is just a correction. QQQ is perking up already because CCI and %B are back positive and StochRSI surged above .80 three times. It seems that QQQ is making an attempt to move higher. Watch Thursday's gap for the first signs of weakness. Price support remains at 105 and a break here would confirm the potential pennant. Resistance is set at 107.3 and a breakout here would further affirm the bullish case.
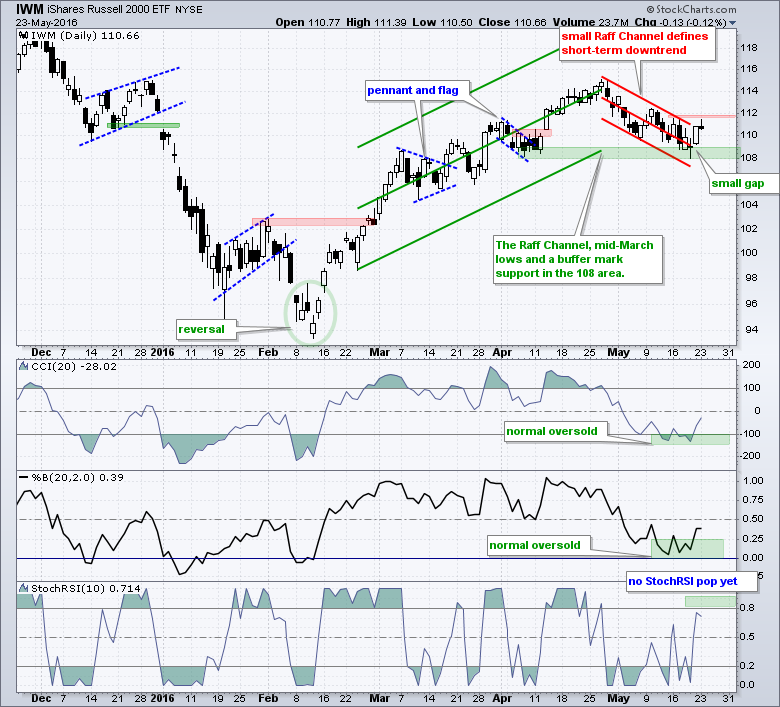
The IWM chart is similar to the SPY chart. IWM gapped up on Friday and this gap is the first bullish sign. Follow through above 112 would reverse the short-term downtrend on the price chart.
When to Pull the Trigger?
This is the million Dollar question and I see three options for playing pullbacks. First, chartists can buy when the ETF becomes oversold and then set a stop somewhere underneath. The blue arrows show the first oversold readings for SPY. Second, chartists can wait for the ETF to become oversold and then buy on the first sign of a reversal (gap or StochRSI pop). The green callouts show the two gaps. A stop-loss can then be set just below the low of the pullback. Third, chartists can wait for an actual breakout on the price chart. A stop would also be set just below the low of the pullback and this would most likely be the widest stop of the three choices. In other words, a breakout trade would have the most to lose on a bad signal.
I am somewhere between the first and third options because I am waiting for oversold conditions and then looking for some sort of bullish sign. I am using end-of-day (EOD) charts and closing prices because I do not trade based on intraday price action. It is just a personal preference. In fact, all of this is a personal preference and traders need to find their niche. The decision and the responsibility are yours at the end of the day. The most important thing to do is to PLAN YOUR TRADE and TRADE YOUR PLAN. Work out the entry, stop-loss and profit targets BEFORE putting the trade on.
Money Moves out of Safe-haven Bonds
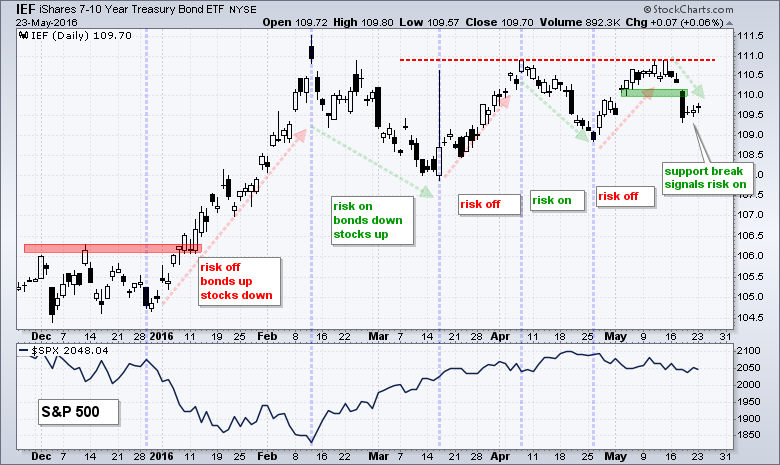
The 7-10 YR T-Bond ETF (IEF) broke down last week with a sharp decline on Wednesday and this breakdown is the dominant chart feature. Even though IEF remains within a trading range the last three months, Wednesday's decline broke support and reversed the upswing within this consolidation. This signals that money is moving out of safe haven Treasury bonds and this is good for the risk environment because some of this money may find its way into riskier assets, like stocks. The breakdown in IEF is also bullish for Treasury yields and this is positive for the finance sector, which has a strong positive correlation to Treasury yields.
Finance Remains in the Spotlight
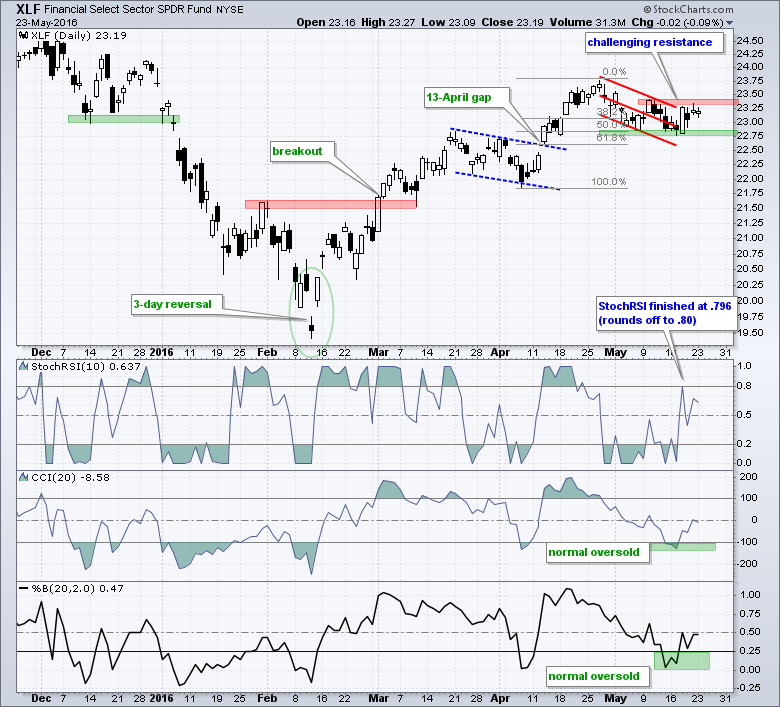
The Finance SPDR (XLF) surged last Wednesday and then stalled for three days. A bullish engulfing formed on Wednesday and then an inside day on Thursday. Overall, the ETF remains in pullback mode and the bigger trend is up. This pullback is considered a correction within the bigger uptrend and a follow through breakout would reverse the four week slide. The indicator windows show CCI and %B becoming oversold and StochRSI hitting .80 with last week's surge. Bullish bets are off should XLF close below last week's low (22.75).
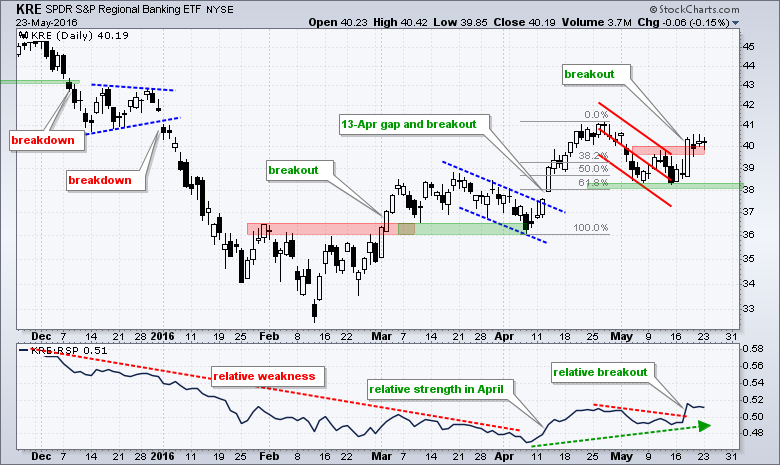
Regional Banks Take the Lead
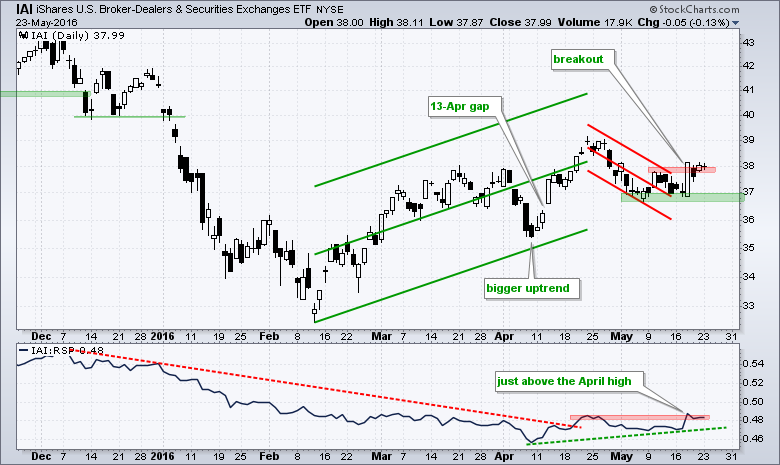
The Regional Bank SPDR (KRE) is actually leading with a breakout on Wednesday. The ETF stalled the last three days, but this does not detract from the breakout, which remains bullish. The Broker-Dealer iShares (IAI) also broke out last week and this breakout is holding for the most part.
Scanning for Pullbacks in an Uptrend
Chartists can copy and paste the scan criteria below:
[group is SP500] or [group is SP400] or [group is SP600] // looking for stocks
and [SMA(5, close) > SMA(200,close)] // long term trend is up
and [Min(10,CCI(20)) < -100] // pullback over the last two weeks
and [Min(10,%B(20,2)) < .25] // pullback over the last two weeks
and [Stoch RSI(10) x .80] // momentum pop
******************************************************
Measuring Risk On-Risk Off - Using charts to quantify stock, economic and credit risk.
PPO Trading Strategy - How to use 3 PPOs to develop a trend-reversion trading strategy.
Long-term Trend Indicators - Using the PPO, EMA Slope and CCI to determine the trend.
ETF Master ChartPack - 300+ ETFs organized in a Master ChartList and in individual groups.
Follow me on Twitter @arthurhill - Keep up with my 140 character commentaries.
****************************************
Thanks for tuning in and have a good day!
--Arthur Hill CMT
Plan your Trade and Trade your Plan
*****************************************


