SPDRs versus Equal-weight Sectors // Three Long-term Sector Laggards // Two Long-term Sector Leaders // Technology and Consumer Discretionary Weigh // Marking Key Support for Finance, Industrials and Healthcare // Staples and Utilities Still Leading on Price Charts // Materials is Most Extended // Webinar Preview //// .......
SPDRs versus Equal-weight Sectors
The sector SPDRs represent large-caps stocks with the top ten stocks accounting for a large percentage of the overall weighting. These sector SPDRs are good for assessing the overall environment for large-caps and the S&P 500 SPDR. The equal-weight sector ETFs have the same stocks, but the components are equally weighted, regardless of market cap. This makes the equal-weight sectors more representative of the sector as a whole. In addition, the equal-weight sectors are good for assessing the overall environment for small-caps and mid-caps. Using scan results and basic chart analysis, we can assess the state of the market and identify the leaders.
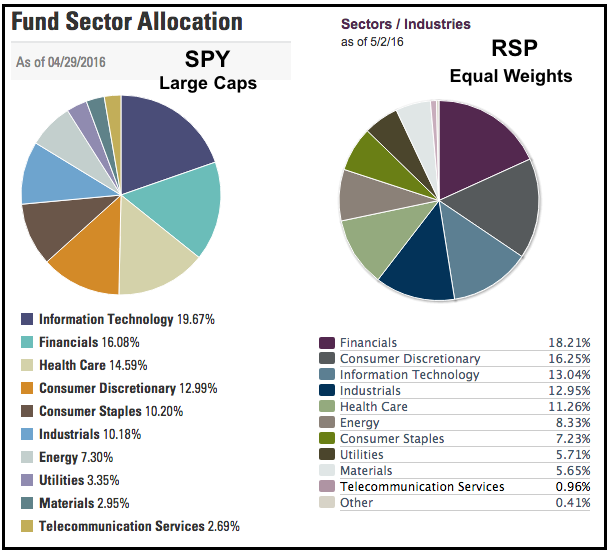
Before the analysis, we should review the index/ETF weightings for the nine sectors. Keep these numbers in mind when performing a "sum of the parts" analysis using the sectors. The broad market environment is bullish when the bullish sectors exceed 50%. The broad market environment is bearish when the bearish sectors exceed 50%. The degree of bullishness or bearishness depends on how far above 50%. Technology, finance, healthcare and consumer discretionary are the four biggest sectors for large-caps and they account for 63% of SPY. Finance, consumer discretionary, technology and industrials are the four largest for the EW S&P 500 ETF (RSP) and they account for around 60% of the ETF.
Three Long-term Sector Laggards
The table below shows three moving average relationships for the nine sector SPDRs: above/below the 50-day, above/below the 200-day and the 50-day above/below the 200-day. I also added the StockCharts Technical Rank (SCTR) for relative performance. Overall, there is clearly more green (bull) than red on this table and this means the broad market environment remains bullish. The Technology SPDR (XLK) is the only sector below its 50-day and it has the lowest SCTR by far. All nine sectors are above their 200-day.
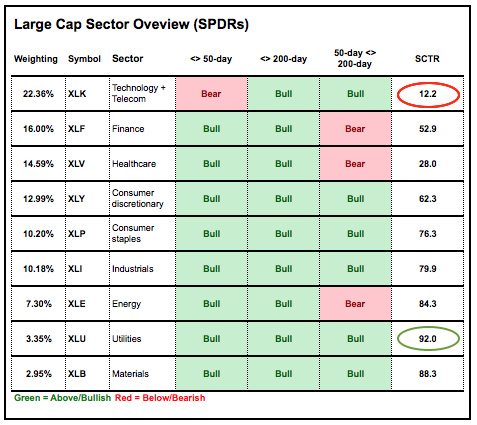
Longer term, the 50-day is above the 200-day for only six of the nine. Notice that the 50-day SMA remains below the 200-day SMA for finance, healthcare and energy. Long-term, these three sectors have the weakest charts. The utilities sector has the highest SCTR and all three moving average indicators are bullish. Even though this sector stumbled in April, the longer-term trend indicators stayed bullish and relative performance remained strong.
Two Long-term Sector Leaders
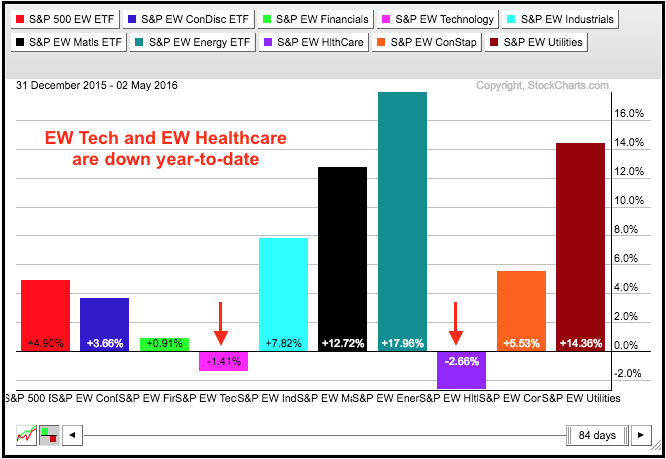
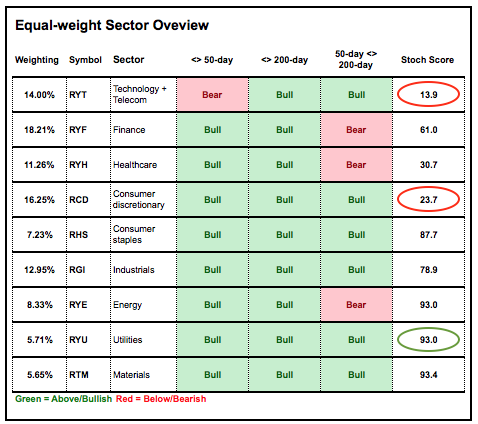
The next table shows the nine equal-weight sectors and the moving average relationships are similar. Again, there is way more green than red and this means the market environment remains bullish overall. The equal-weight technology ETF is the only sector below its 50-day. The 50-day is below the 200-day for finance, healthcare, and energy. These three are also the only three that did not exceed their November-December highs. Technology and consumer discretionary have the lowest SCTRs and show relative weakness. The utilities ETF has a SCTR above 90 and shows relative strength.
Technology and Consumer Discretionary Weigh
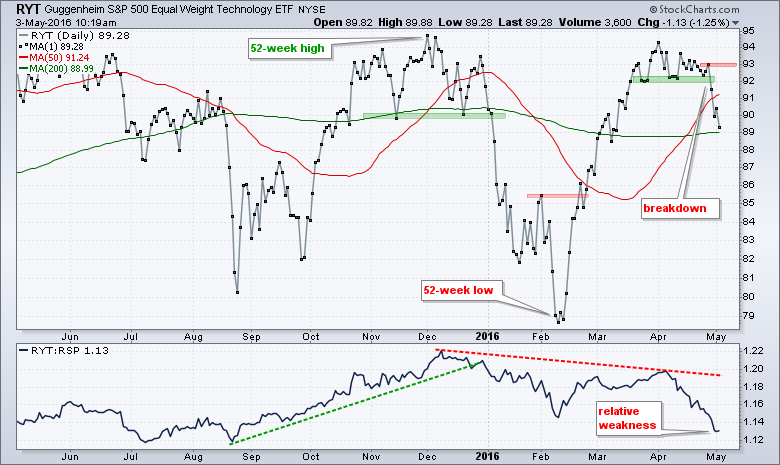
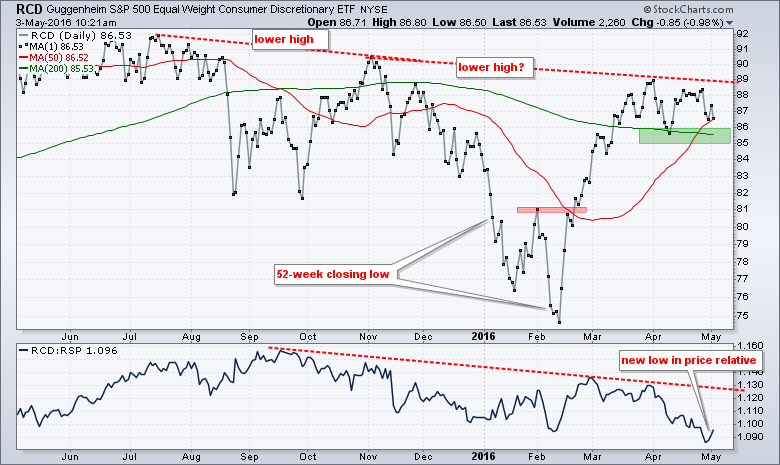
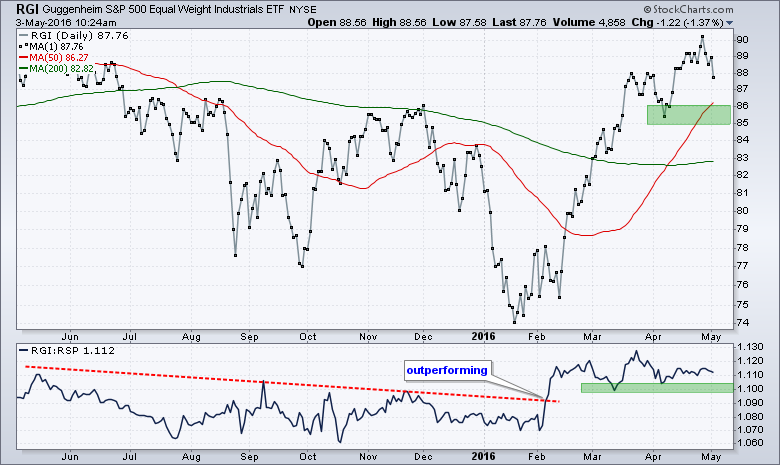
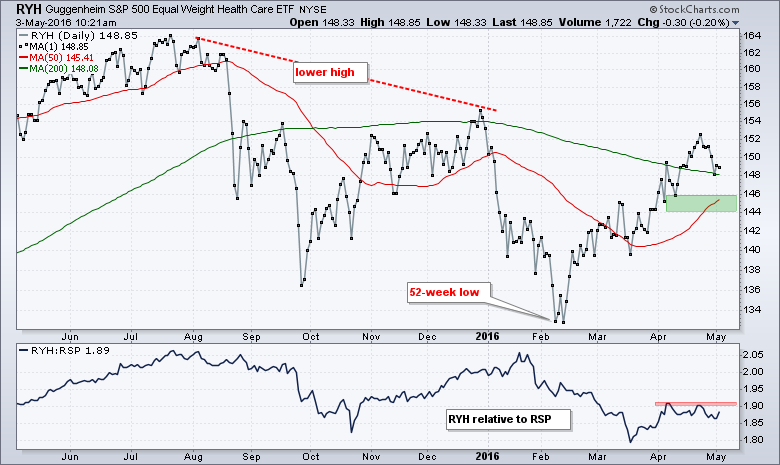
The next charts show the nine equal-weight sector ETFs with the 50-day SMA (red), the 200-day SMA (green) and key support marked near the April reaction low. A reaction low forms when prices decline and then bounce. This low marks a demand point that can be used to define support. I usually add a buffer and move support to the next lowest round number. Eight of nine remain above support right now and this supports the bulls. The broader market will be in trouble when the majority of sectors break this support zone. The bottom window in each chart shows the price relative to measure relative performance against the EW S&P 500 ETF (RSP).
The EW Technology ETF (RYT) is the only equal-weight sector trading below the 50-day SMA and the April reaction low. The EW Consumer Discretionary ETF (RCD) remains just above its support zone, but shows some serious relative weakness as the price relative hit a new low. A support break in RCD would put two of the most important sectors in bear mode and this would weigh on the broader market.
Marking Key Support for Finance, Industrials and Healthcare
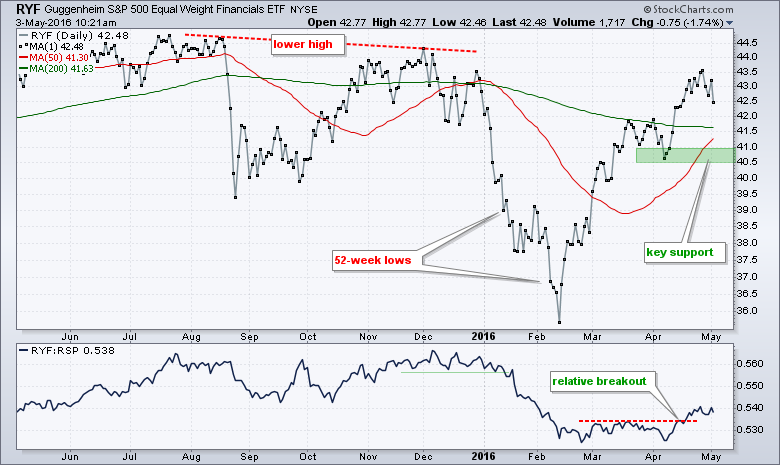
The technology sector broke support and the consumer discretionary sector is teetering, but it will take a little big more to tilt the broader market. In particular, I would watch finance, industrials and healthcare quite closely because breakdowns in these could tilt the balance. The EW Finance ETF (RYF) surged in April and showed some relative strength with a breakout in the price relative. Even though the ETF remains below the December high, the immediate trend is up with support marked in the 40.5-41 area.
The EW Industrials ETF (RGI) was one of the best performing sectors in February-March with a massive advance. The April reaction low and a buffer mark support in the 85-86 area.
The EW Healthcare ETF (RYH) is still one of the weakest sectors overall. The 50-day is below the 200-day and the price relative hit a new low in March. The trend since February, however, is still up with support marked in the 144-146 area.
Staples and Utilities Still Leading on Price Charts
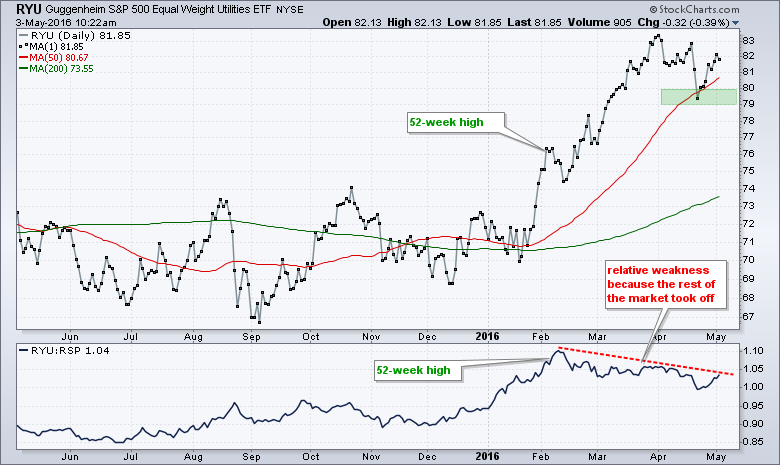
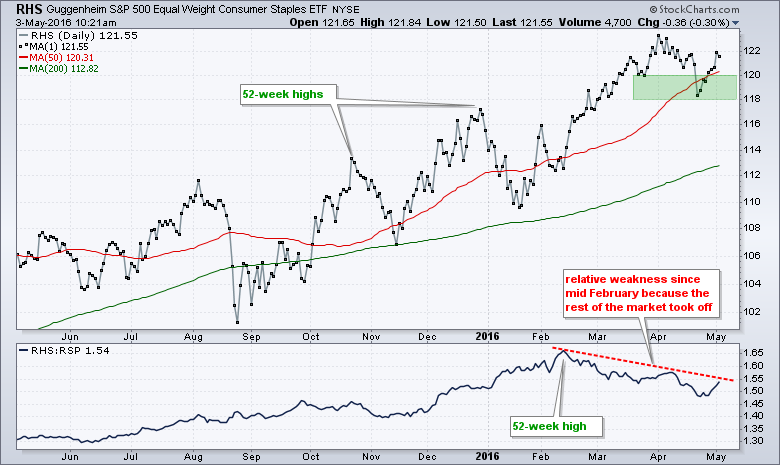
The EW Consumer Staples ETF (RHS) and EW Utilities ETF (RYU) were hit hard in mid April, but bounced last week and moved back above their 50-day moving averages. These two are very close to 52-week highs and still sport some of the strongest price charts overall. The April reaction low and a buffer mark support.
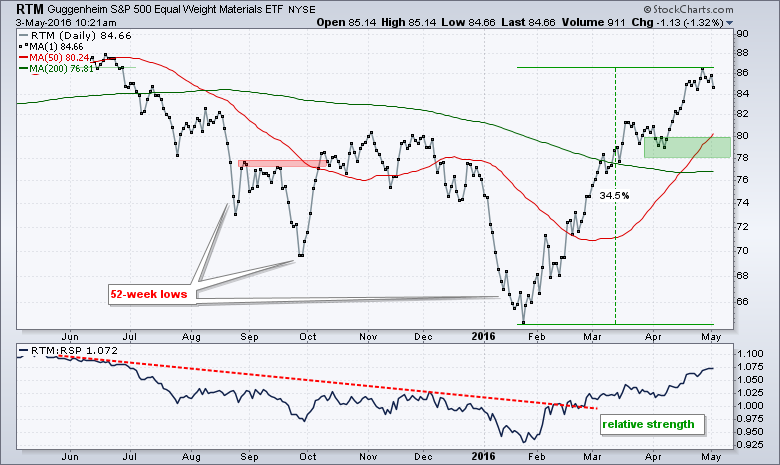
Materials is Most Extended
The EW Materials ETF (RTM) remains on a tear with a 30+ percent gain since late January. The ETF is quite ripe for a corrective period and we could see a pullback. The April low and a buffer mark support in the 78-80 area.
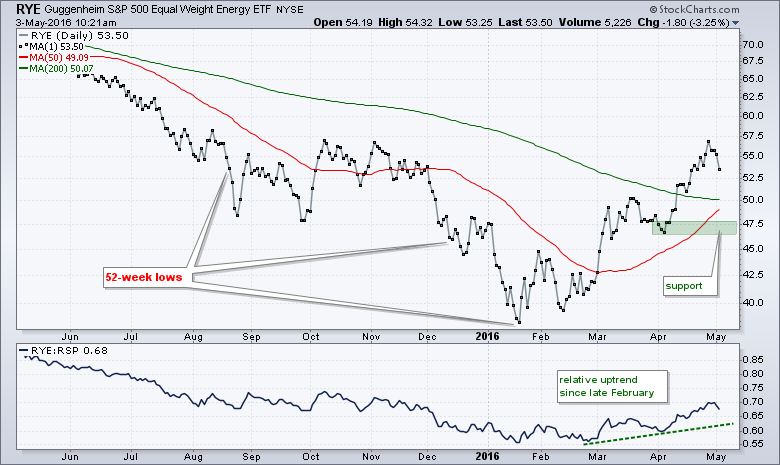
The EW Energy ETF (RYE) is also up sharply since mid January and showing relative strength the last two months. It is still one of the weaker sectors long-term. Nevertheless, the immediate trend is up with the April low marking support.
*******************************************
Measuring Risk On-Risk Off - Using charts to quantify stock, economic and credit risk.
PPO Trading Strategy - How to use 3 PPOs to develop a trend-reversion trading strategy.
Long-term Trend Indicators - Using the PPO, EMA Slope and CCI to determine the trend.
ETF Master ChartPack - 300+ ETFs organized in a Master ChartList and in individual groups.
Follow me on Twitter @arthurhill - Keep up with my 140 character commentaries.
****************************************
Thanks for tuning in and have a good day!
--Arthur Hill CMT
Plan your Trade and Trade your Plan
*****************************************


