A Market Entitled to a Correction // Using StochRSI to Time Pops in QQQ // A Mild Correction for SPY // Big Techs and Biotechs Drive QQQ Lower // Breaking Down the Big Five - FAAAM // Apple is the Weakest of the Big Five, but.... // Microsoft and Alphabet Hit Interesting Junctures //// .......
A Market Entitled to a Correction
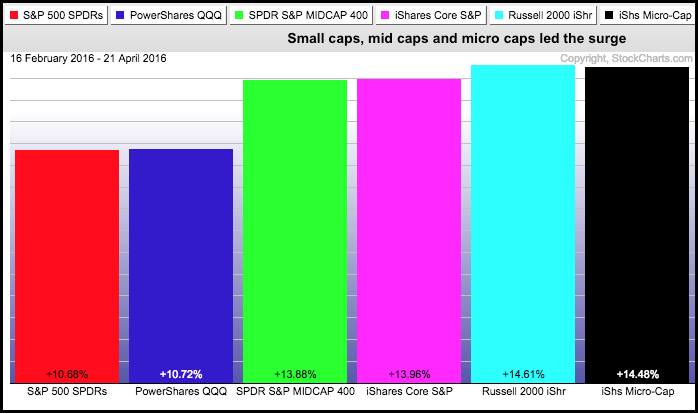
The Nasdaq 100 and QQQ bore the brunt of selling pressure over the last two weeks, but the rest of the market is still holding up rather well. The two PerfCharts show the percentage change for six major index ETFs over two different periods. The first shows the percentage gain from mid February to mid April. This period captures the surge in stocks as small-caps, mid-caps and micro-caps gained around 14%. Even lowly large-caps gained as SPY and QQQ advanced almost 11%. Such huge moves in a short period of time reflect strong buying pressure, but they were unsustainable and the market was ripe for a correction.
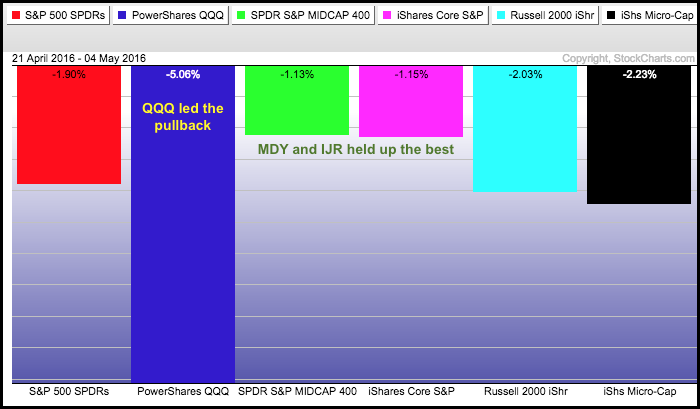
The second period shows the percentage loss over the last two weeks. QQQ is clearly leading the pack with a 5% decline. SPY, IWM and the Russell MicroCap iShares (IWC) are down around 2%. The S&P MidCap SPDR (MDY) and S&P SmallCap iShares (IJR) are down around 1% and holding up the best. It should be noted that SPY and QQQ peaked two weeks ago (20-April), while MDY and IJR peaked a week ago (27-Apr). The latter two are down around 3% the last five days, but still holding up better than SPY and QQQ overall.
There are two takeaways from these two charts. First and foremost, a correction is quite normal after such a sharp advance. While I am concerned with the depth of the correction in QQQ, the pullback in the broader index ETFs looks normal so far. Second, large-techs show relative weakness, while small-caps and mid-caps show relative strength. Again, I am concerned with relative weakness in large-techs, but this is counterbalanced with relative strength in small-caps and mid-caps.
Using StochRSI to Time Pops in QQQ
As detailed in Monday's commentary, I am still working under the assumption that we are in a bull market environment. This means I view pullbacks as corrections and expect a bullish resolution at some point. This is what mean-reversion trading strategies are all about. Even though QQQ broke support in late April, I still view this pullback as corrective because the broader market is holding up. The QQQ chart shows a steep falling flag with resistance at 107. This is the first price level to watch for a breakout.
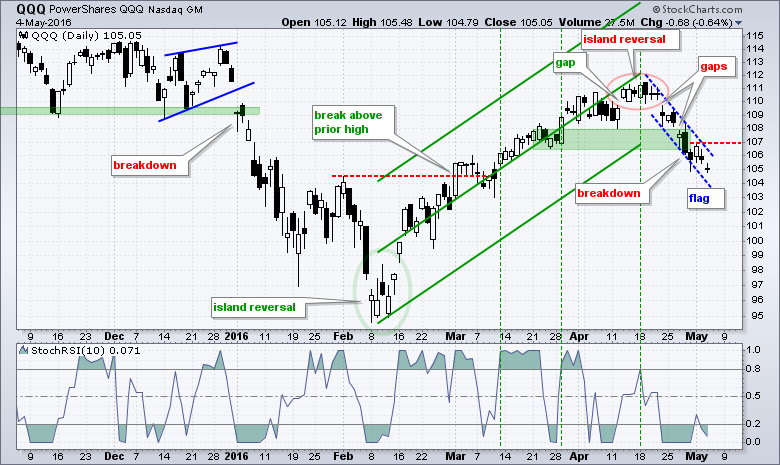
The indicator window shows StochRSI, which is the Stochastic Oscillator applied to RSI. This indicator is very sensitive because it measures the momentum of momentum. Like the short-term PPO (5,30,5), I use StochRSI(10) to identify short-term pullbacks and subsequent momentum pops. A pullback occurs when StockRSI moves below .20 and the pop occurs with a subsequent move above .80 (green lines). The last signal failed after the gap down and island reversal. I am currently waiting on another signal.
A Mild Correction for SPY
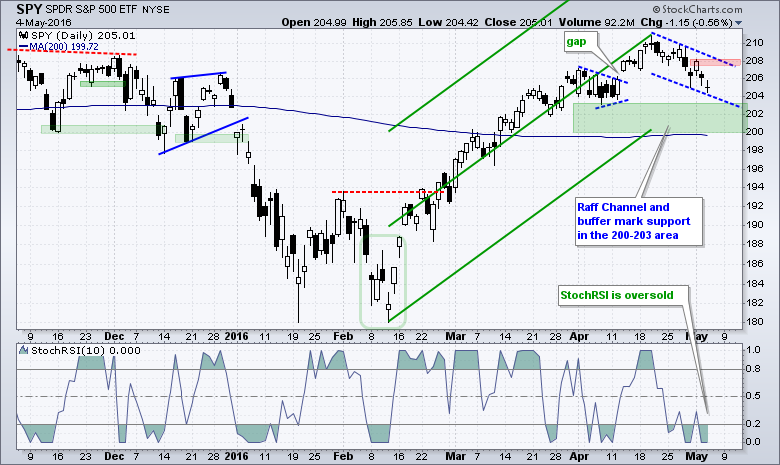
SPY is in the midst of a mild correction within a bigger uptrend. Note that the ETF is down just 2.42% over the last ten days (closing basis) and this is the first 2+ percent decline since early February. A falling flag is also taking shape and this is a bullish continuation pattern. A move above 208.1 would reverse the two week slide and trigger a breakout. The indicator window shows StochRSI becoming oversold with several dips below .20 the last two weeks. Chartists looking to get a jump on the momentum pop can watch for a surge above .50, which would put the indicator in the upper half of its range (cup half full).
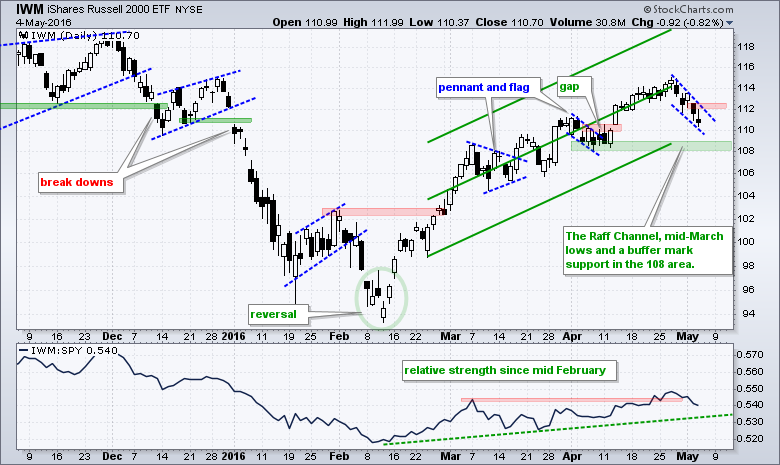
IWM shows relative strength since mid February because the price relative (IWM:SPY ratio) is trending up. The ETF pulled back the last five days, but remains above key support in the 108 area and a small falling wedge is taking shape. Look for a move above 112.6 to trigger a breakout.
Big Techs and Biotechs Drive QQQ Lower
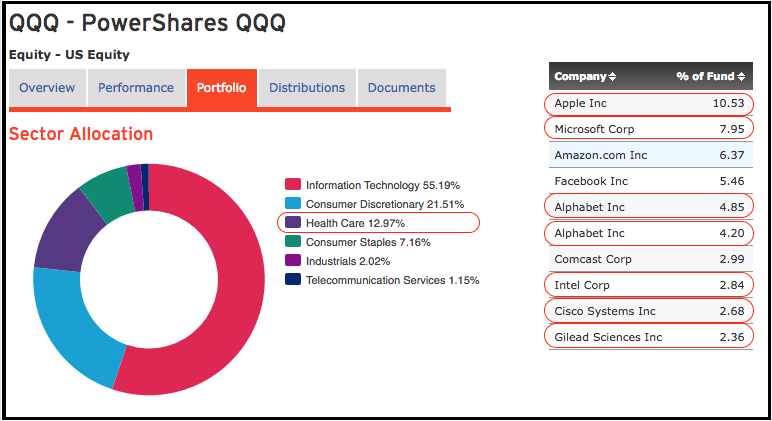
Now let's dive into the Nasdaq 100 and see the key drivers. The image below, which comes from the PowerShares Invesco website, shows the sector breakdown for QQQ and the top ten holdings. Those outlined in red are weighing on the ETF. The six stocks account for around 35% of QQQ and healthcare, which is mostly biotech, accounts for around 13%.
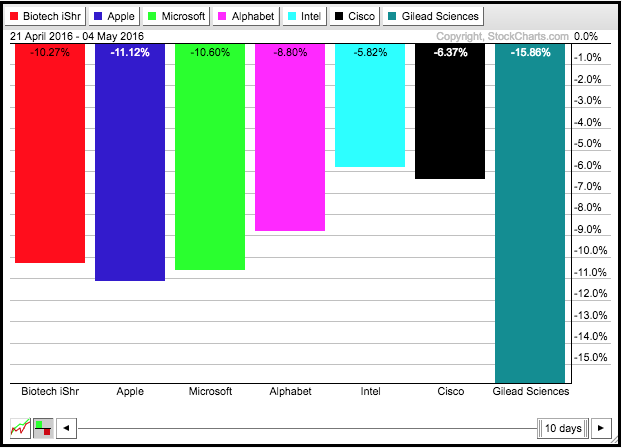
 The PerfChart below shows performance for the Nasdaq Biotech iShares (IBB) and the six stocks mentioned above. All are down sharply over the last two weeks and four are down double digits.
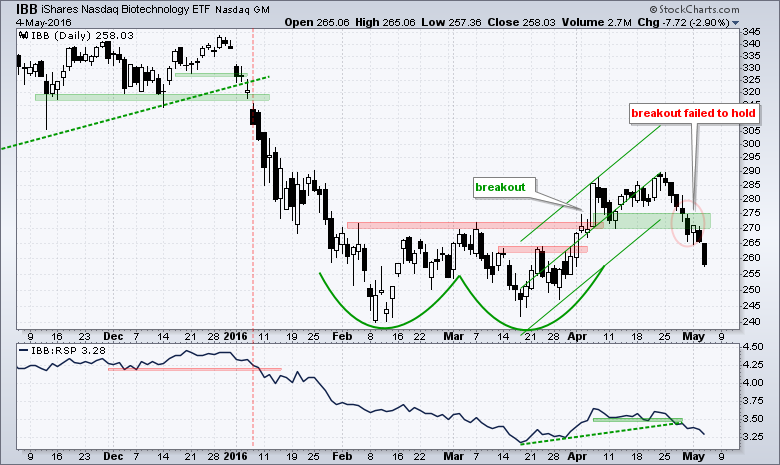
On the price chart, IBB broke out in early April, stalled for a few weeks and then moved back below its breakout zone last week. The double bottom breakout clearly failed. Note to self: be wary of double bottoms in a strong downtrend and double tops in a strong uptrend.
Breaking Down the Big Five - FAAAM (pronounced FAME)
I am not looking for biotechs to bounce anytime soon so we need to watch the big five for clues on QQQ. Facebook, Alphabet, Apple, Amazon and Microsoft are the most important consumer-tech stocks in the market (as of 2016). Two are in clear uptrends and strong (FB and AMZN). One is in a clear downtrend and weak overall (AAPL). Two were hit hard in April, but are trading at support (MSFT and GOOGL). It really boils down to four stocks. Either Facebook and Amazon breakdown and take QQQ down, or MSFT and GOOLE bounce off support to revive QQQ. Let’s look at all five.
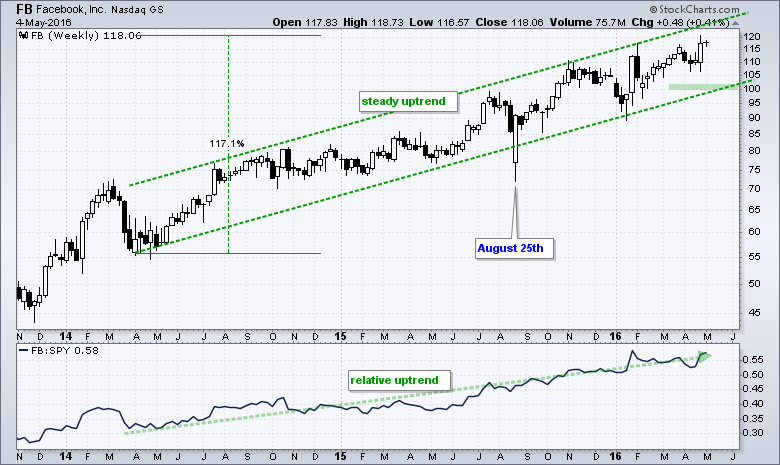
Facebook more than doubled over the last two years with a steady uptrend that remains in place. The stock hit a fresh 52-week high last week and there are no signs of weakness here. First support is set in the 100 area.
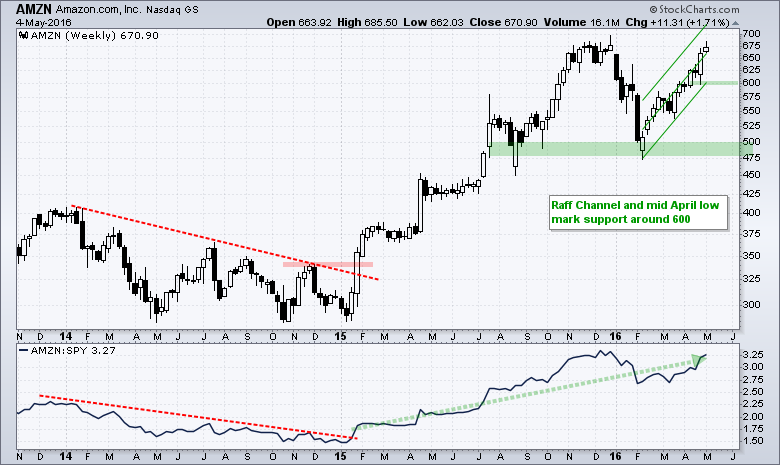
Amazon was hit hard in January, but bottomed in February and advanced back to its 2015 highs. There may be a double top forming, but I think the stock shows more strength than weakness right now. Note that Amazon is around 5% from a new high. The Raff Regression Channel and mid April lows mark the first key support level to watch around 600.
Apple is the Weakest of the Big Five, but....
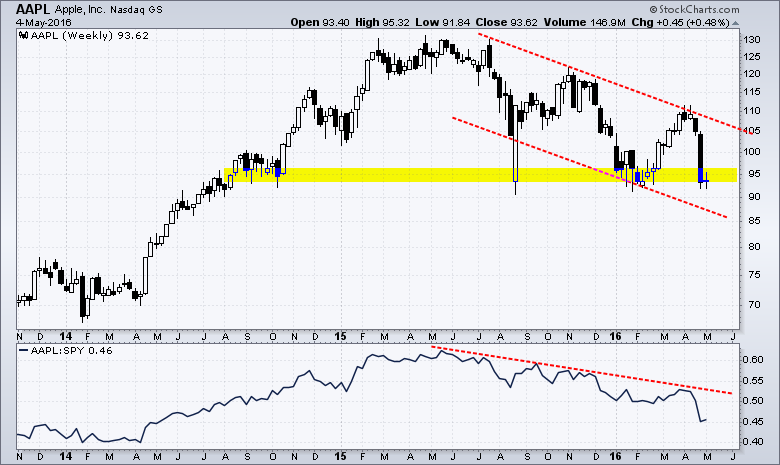
Apple is by far the weakest of the big five with a downtrend since July and relative weakness over the last eleven months. The stock was hit hard in April with a 15% plunge and the price relative moved to a new low. Despite the clear downtrend, Apple may find some support in the mid 90s. Notice that this area held in September-October 2014, August 2015 and January-February 2016.
Microsoft and Alphabet Hit Interesting Junctures
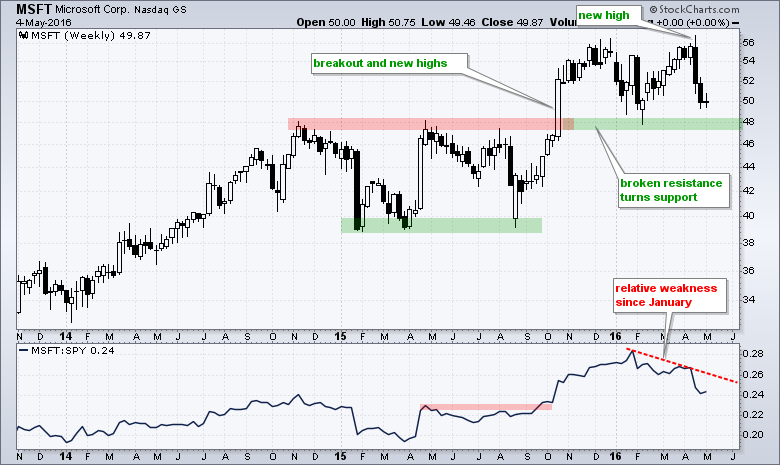
Microsoft is trading at a very interesting juncture. First note that the stock broke out in September and recorded 52-week highs with its massive surge. The stock also recorded a new high in April, but fell back with a sharp decline the last 2-3 weeks. Microsoft is interesting because the overall trend appears to be up and the stock is trading near support in the 48-50 area.
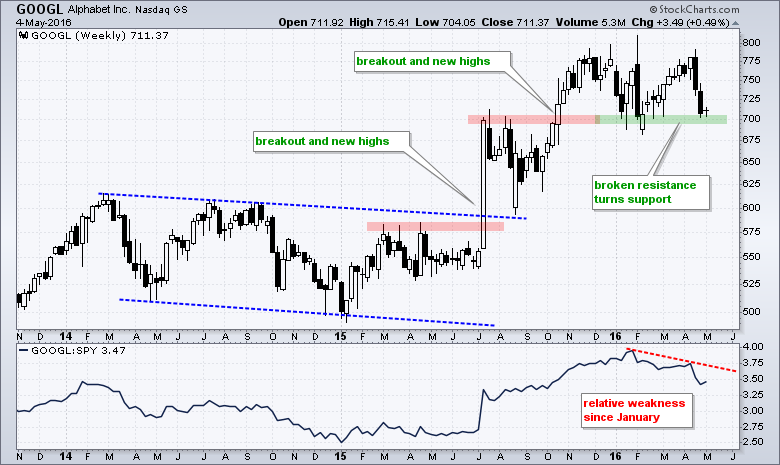
The Alphabet chart looks similar to the Microsoft chart. GOOGL broke out in July and again in October. Broken resistance turned into support in the 700 area and the stock has been range bound for around six months. GOOGL is at an interesting juncture because this could be a consolidation within a bigger uptrend and the stock is at support.
******************************************************
Measuring Risk On-Risk Off - Using charts to quantify stock, economic and credit risk.
PPO Trading Strategy - How to use 3 PPOs to develop a trend-reversion trading strategy.
Long-term Trend Indicators - Using the PPO, EMA Slope and CCI to determine the trend.
ETF Master ChartPack - 300+ ETFs organized in a Master ChartList and in individual groups.
Follow me on Twitter @arthurhill - Keep up with my 140 character commentaries.
****************************************
Thanks for tuning in and have a good day!
--Arthur Hill CMT
Plan your Trade and Trade your Plan
*****************************************


