SPY Pulls back within Uptrend // QQQ Battles Support and Lags // Breadth Indicators Stall // High-Low Lines Extend Advances // Sector Table Remains Bullish // Consumer Discretionary and Technology are the Weak Links // Finance and Industrials are Holding Up // Healthcare Weighed down by Biotechs // Staples and Utilities Remain the Leaders // Energy and Materials Maintain Uptrends // Seven Key Industry Group ETFs to Watch // Friday Food For Thought //// ...........
There are some serious pockets of weakness within the stock market and I am concerned with relative weakness in some cyclical areas, such as retail and semiconductors. Perhaps these two are sending a warning with their breakdowns over the last few weeks. A few sectors or industry groups, however, do not make a market. It is a market of all sectors, all industry groups and all stocks. The PerfChart below shows the S&P 500 SPDR (red) and EW S&P 500 ETF (blue) with small gains, four groups with modest gains and four groups with losses (over the last five weeks).
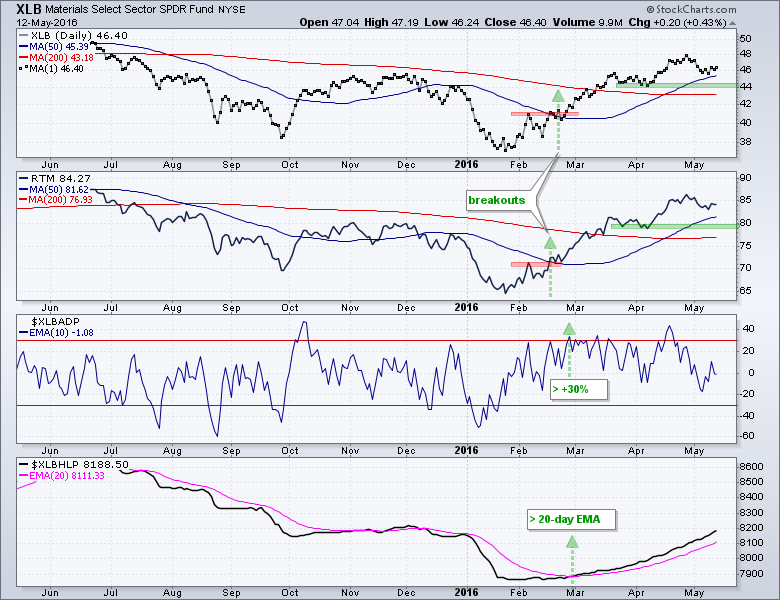
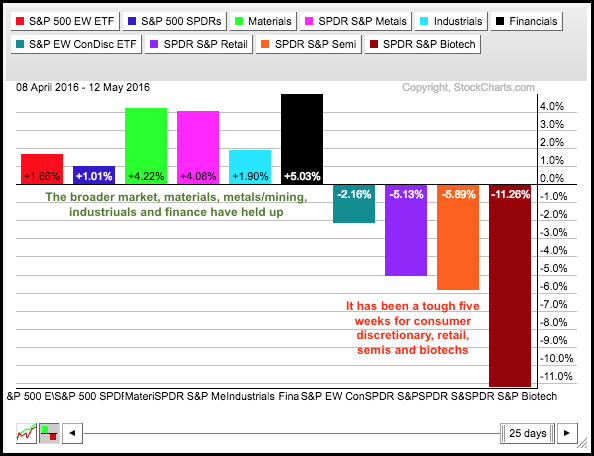 Industrials (XLI), steel (XME) and chemicals (XLB) are also cyclical in nature and these groups have yet to break down. Also note that the finance sector and banks are still ok. Perhaps this split market will lead to a grinding range, but I do not see enough evidence to turn bearish yet. I have yet to get bearish signals from breadth, the majority of sectors remain bullish and new highs continue to outpace new lows. Until the weight of the evidence turns bearish, declines are viewed as corrections within bigger uptrend.
SPY Pulls back within Uptrend
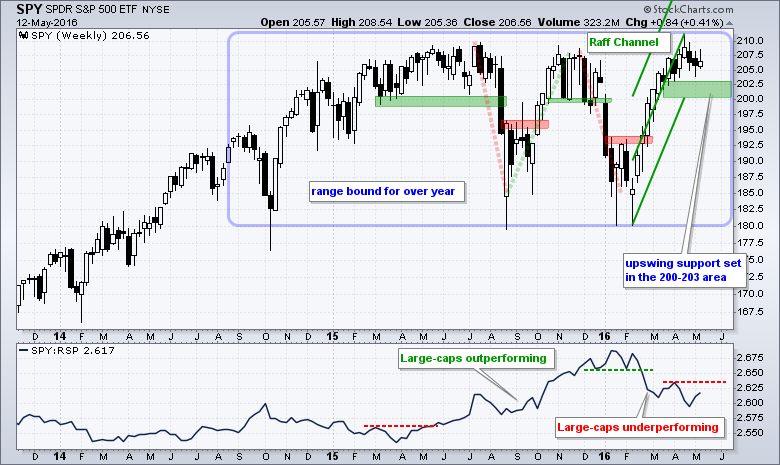
The S&P 500 SPDR (SPY) surged to its prior highs in the 210 area and then fell back the last few weeks. Overall, we still have a big trading range and an upswing within that trading range. I still consider this upswing the dominant chart feature and am marking support in the 200-203 area. After a double-digit advance in ten weeks, we need to allow some wiggle room for a correction, which can involve price and time. A weekly close below 200 would call for a re-evaluation. As long as the breadth indicators and sector table remains net bullish, I would view a pullback into this zone as an opportunity, not a threat.
QQQ Battles Support and Lags
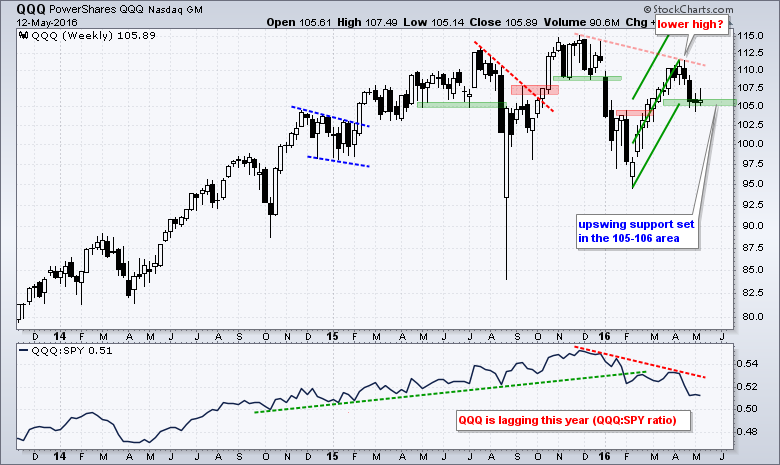
The Nasdaq 100 ETF (QQQ) is battling weekly chart support in the 105-106 area. Note support levels can differ slightly on daily and weekly charts. QQQ fell sharply in late April and then stalled the last two weeks. Apple and biotechs continue to weigh on the ETF. Facebook and Amazon are in strong uptrends. Microsoft and Alphabet may hold the key because they are bouncing off long-term support levels. These two tech heavy weights could hold the key to QQQ. Returning to the price chart, a weekly close below 105 would break support and call for a re-evaluation of the trend.
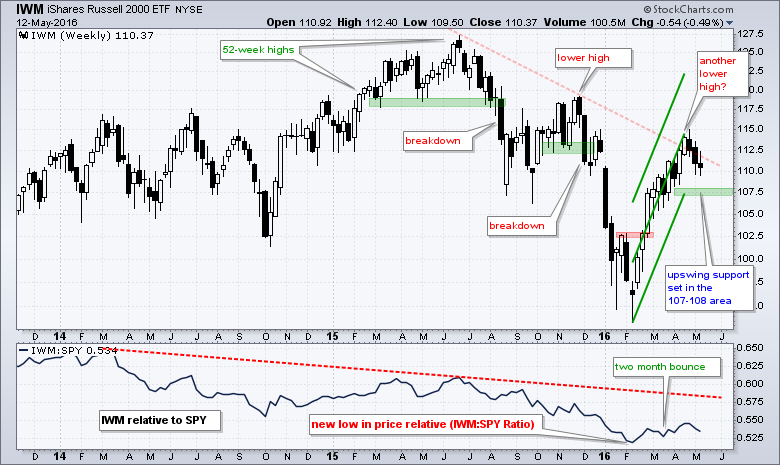
 IWM is in the midst of a three week pullback and could be forming a lower high for the second time in six months. The immediate, and most important, swing is currently up with support marked in the 107-108 area. As with SPY, I am allowing room for a pullback and 107 is the level at which I will cry uncle (bear).
Breadth Indicators Stall
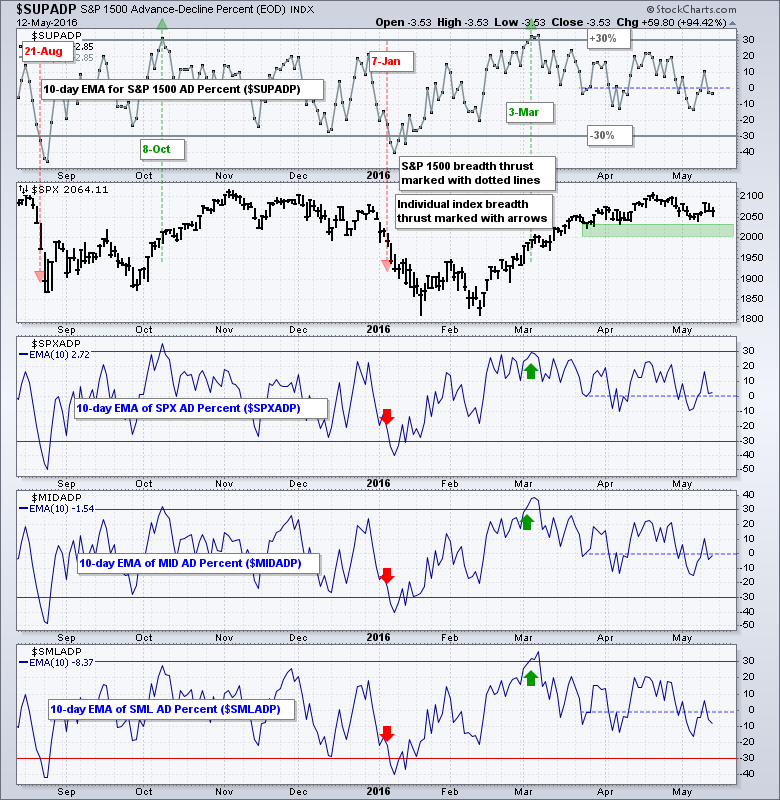
The 10-day EMAs for AD Percent remain on bull signals since early March. Breadth surged with broad buying pressure Friday-Monday-Tuesday and then fell back with broad selling on Wednesday. It has pretty much been a stalemate since early April because the 10-day EMAs of AD Percent have moved above below the zero line several times (blue dashed line). This is a consolidation of sorts and not indicative of strong selling pressure. Moves below -30% are required to signal broad selling pressure that could be a trend changing event.
High-Low Lines Extend Advances
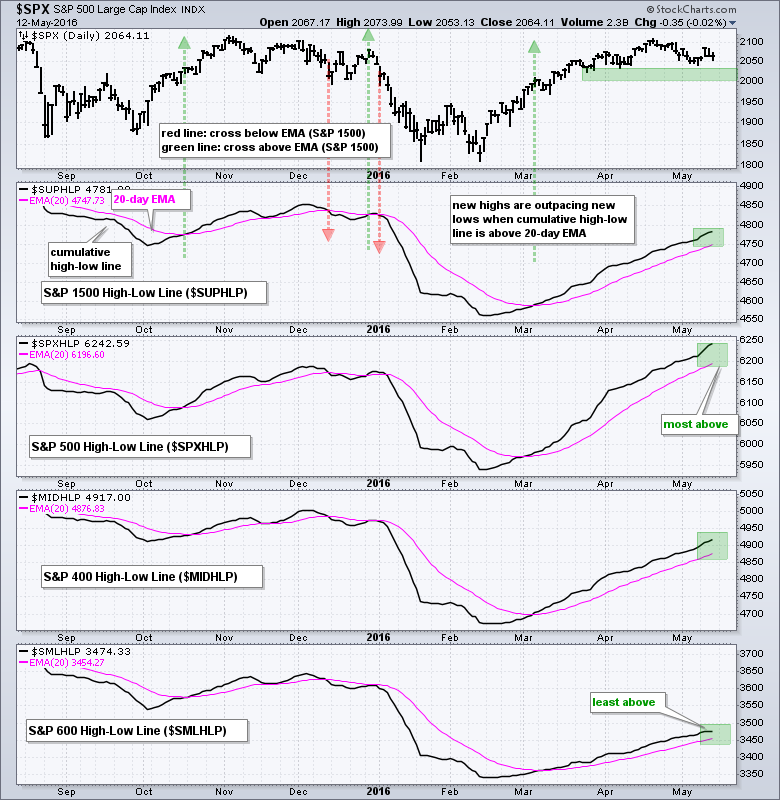
The High-Low Lines continue to rise and all four hit new highs for the current move, which began in early March. The S&P 500 is the strongest and furthest above its 20-day EMA. The S&P Small-Cap 600 is the least strong and closest to its 20-day EMA. Signals do not trigger until these High-Low Lines start breaking below their 20-day EMAs. New highs are still outpacing new lows and this is net bullish until there is evidence to the contrary. The new highs were concentrated in consumer staples, finance and utilities.
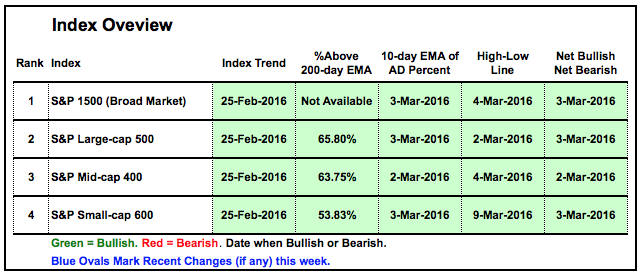
 The table below summarizes the trends and indicators for the S&P 1500, S&P Small-Cap 600, S&P MidCap 400 and S&P Small-Cap 600. All remain bullish.
Sector Table Remains Bullish
There is no change in the sector chart. Seven of the nine sectors are fully bullish. The technology and consumer discretionary sectors have weakened, but neither has fully tilted bearish. I think Amazon is holding up XLY. Even though it seems like a tumultuous week, the S&P 500 SPDR (SPY) and EW S&P 500 ETF (RSP) are still positive over the last four days and seven of the nine sector SPDRs are up. Ditto for the equal-weight sectors. The consumer discretionary and healthcare sectors are the only two that are down so far this week. We can blame retail and biotech for weakness in these two. In any case, the sum of the parts is still net bullish for the stock market.
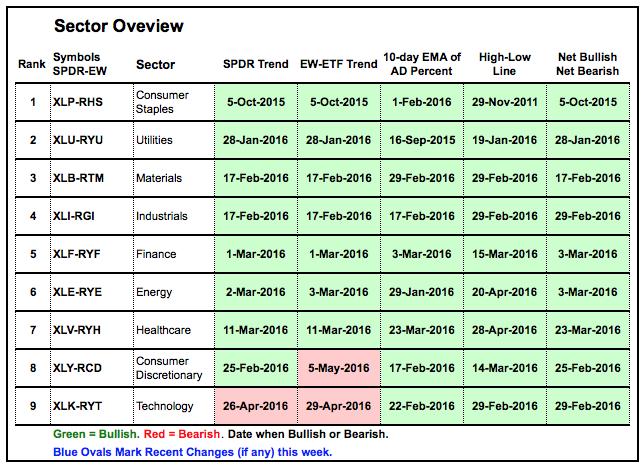 Charting Note: There are two sectors and two indicators covered on these charts. The sector SPDRs represents the large-caps within the sector and the equal-weight sector ETF represents the average stock. The 10-day EMA of AD Percent is used to identify bullish and bearish breadth events. A move above +30% is bullish until countered with a move below -30%, which is bearish. The High-Low Line is bullish as long as it is above the 20-day EMA (rising) .
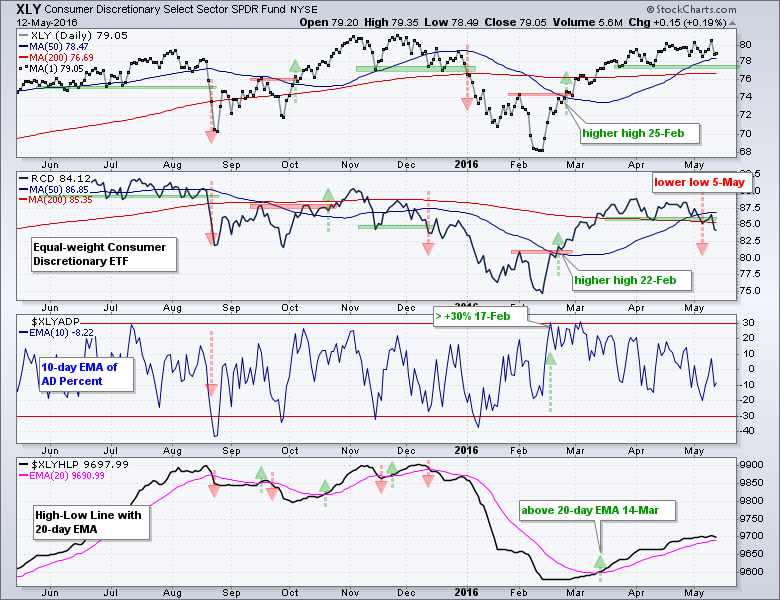
Consumer Discretionary and Technology are the Weak Links
XLY remains above its support zone and the flat 200-day moving average, but RCD broke below support and below its falling 200-day. The average stock in the consumer discretionary sector is having a tough time right now. This is a clear drag on the market as a whole, but we must also consider the other eight sectors.
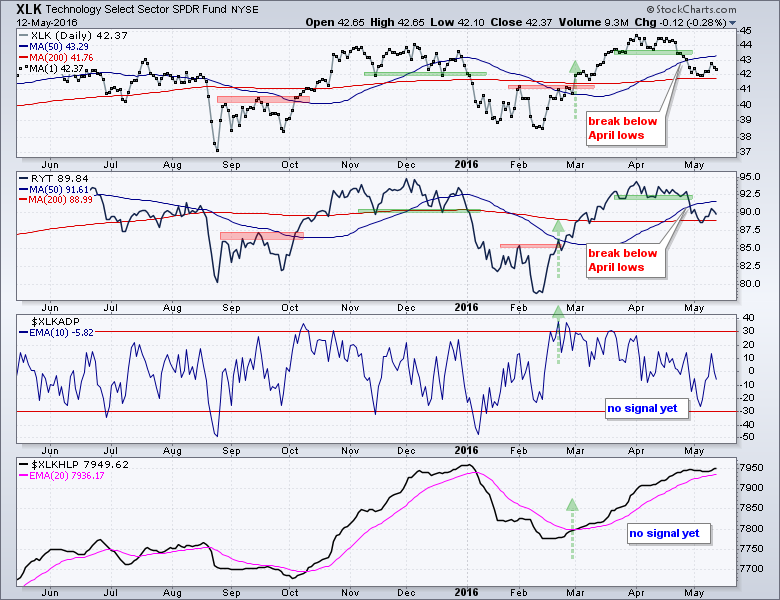
 XLK and RYT broke below their mid April lows in late April and these two are the weakest of the sector pairs. Both, however, are above their 200-day moving averages. The 10-day EMA for AD Percent almost turned bearish with a move below -30% in early May, but bounced to stave off a bearish signal.
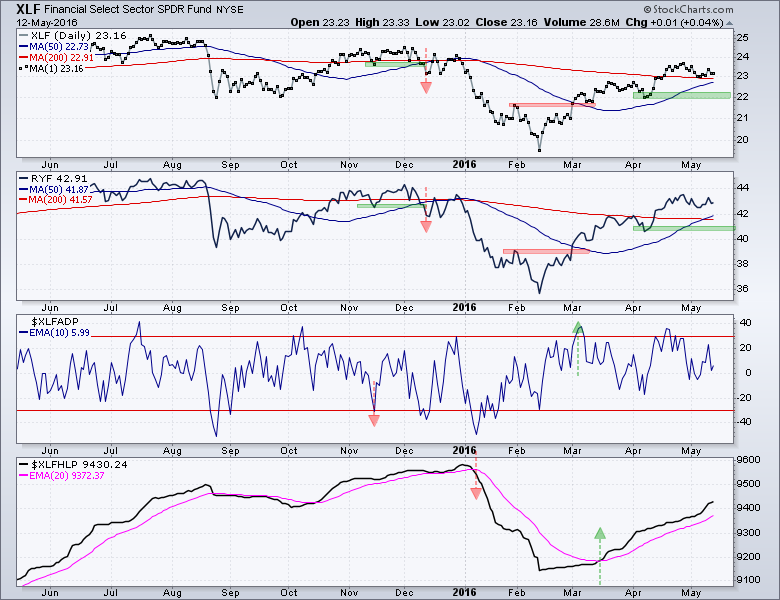
Finance and Industrials are Holding Up
Even though weakness in technology and consumer discretionary is a concern, the finance and industrials sectors are holding up just fine. XLF and RYF remain well above their April lows (support) and I remain impressed with near-term relative strength in the finance sector. The High-Low Lines for the finance and industrials sectors surged this week and remain well above their 20-day EMAs.
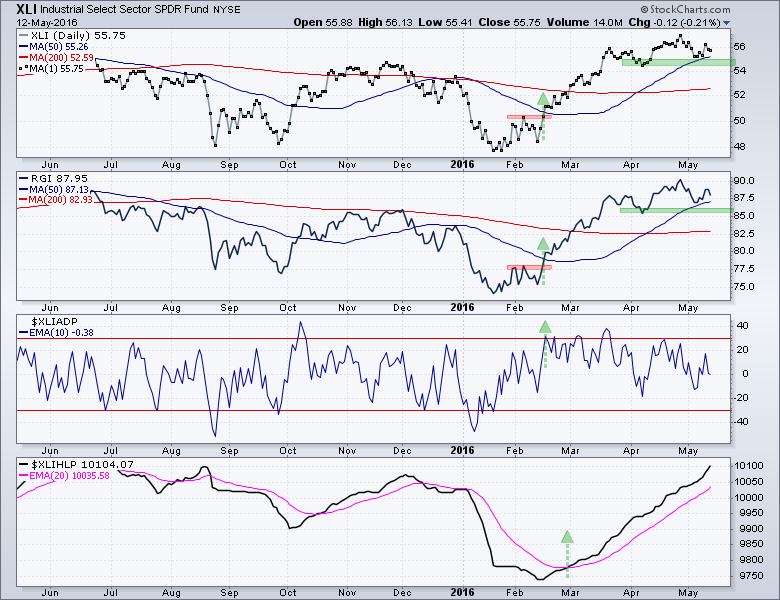 Overall, two of the four offensive sectors show weakness (consumer discretionary and technology). The other two, finance and industrials, are holding up and keeping the market from a major breakdown. This amounts to a stalemate among four key sectors could lead to market grind.
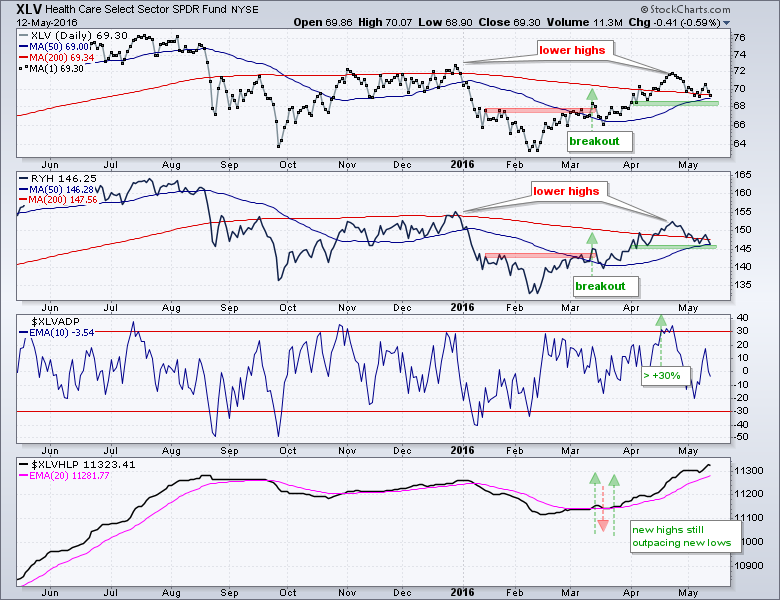
Healthcare Weighed down by Biotechs
Healthcare is not the defensive sector it once was because biotechs are weighing big time. Biotechs account for around 15% of the EW Healthcare ETF and Life Science Tools & Services accounts for around 9%. Both XLV and RYH have falling 200-day moving averages (red) and lower highs over the past year. Both are also testing support zones.
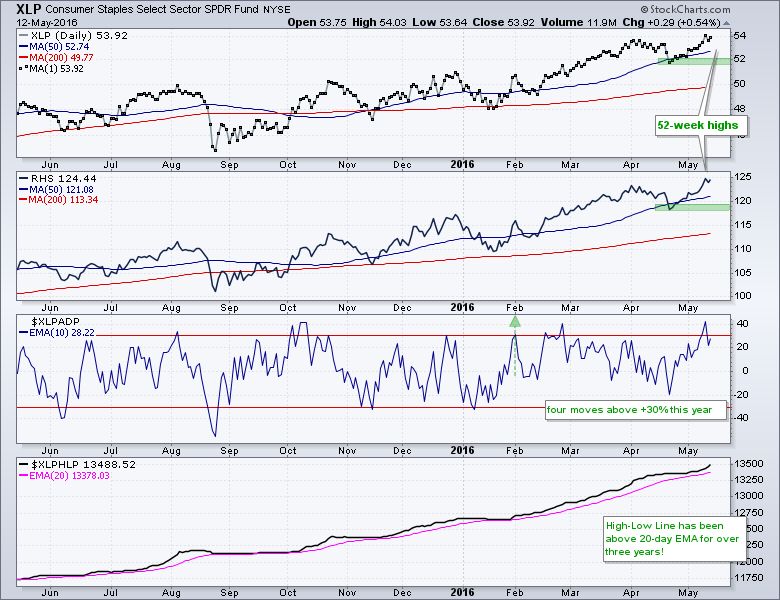
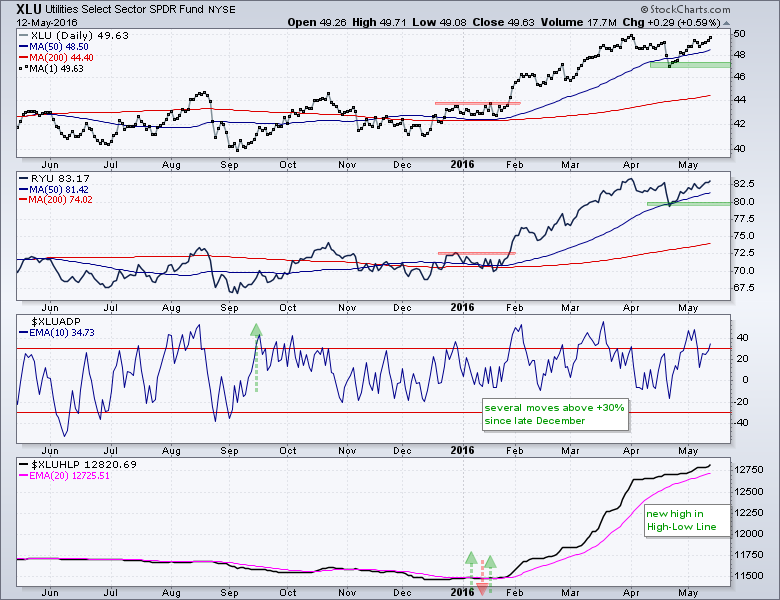
Staples and Utilities Remain the Leaders
Consumer staples and utilities remain the top sectors. The consumer staples ETFs hit new highs this week and the utilities ETFs are close to new highs. The 10-day EMAs for AD Percent moved above +30% again and the High-Low Lines hit new highs for the move.
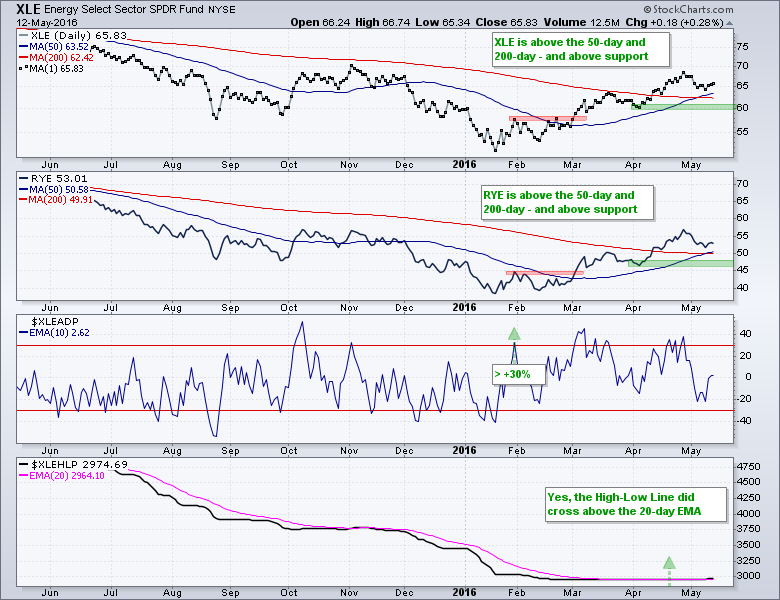
Energy and Materials Maintain Uptrends
The energy and materials sectors are above their key moving averages and in uptrends with the April lows mark support. We are not seeing many new highs in energy, but there were a few over the last few weeks and cause the High-Low Line to edge above the 20-day EMA.
Seven Key Industry Group ETFs to Watch
The Retail SPDR (XRT) broke down last week and continued lower this week with another sharp decline. Notice that XRT reversed near the 62% retracement and well below its summer high. The price relative also broke down last week and hit a new low.
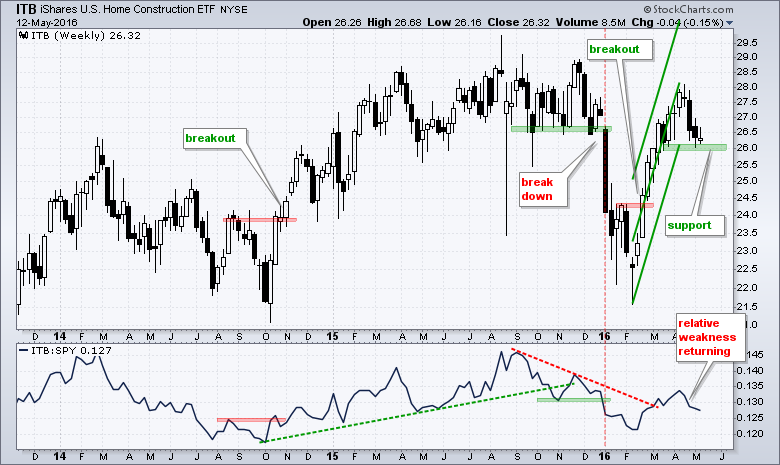
 The Home Construction iShares (ITB) is testing support in the 26 area. It's been a wild ride over the last five months as the ETF plunged over 20% and then surged over 20%. The Raff Regression Channel and mid March low mark support. A break in this group would further weigh on the consumer discretionary sector.
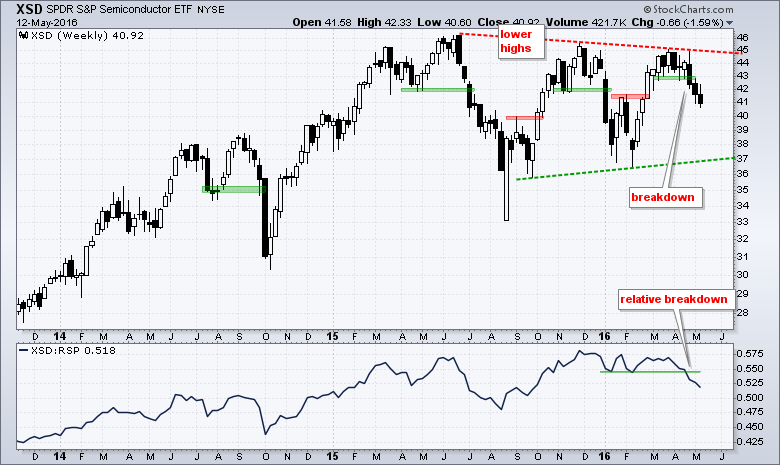
 The Semiconductor SPDR (XSD) formed its second lower high in the last six months and broke support in late April. The price relative also broke support and this means semis show relative weakness.
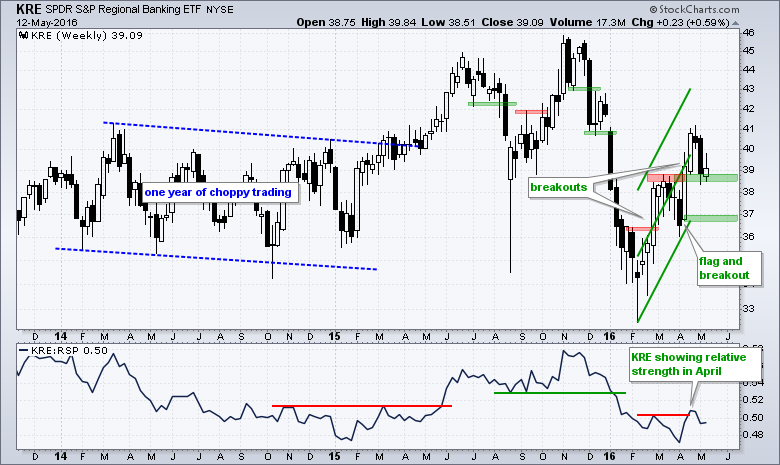
The Regional Bank SPDR (KRE) pulled back rather hard last week and then firmed near broken resistance this week. A pullback after the April surge can be expected and broken resistance is the first place to look for support. Overall, the Raff Regression Channel marks uptrend support in the 36.5-37 area.
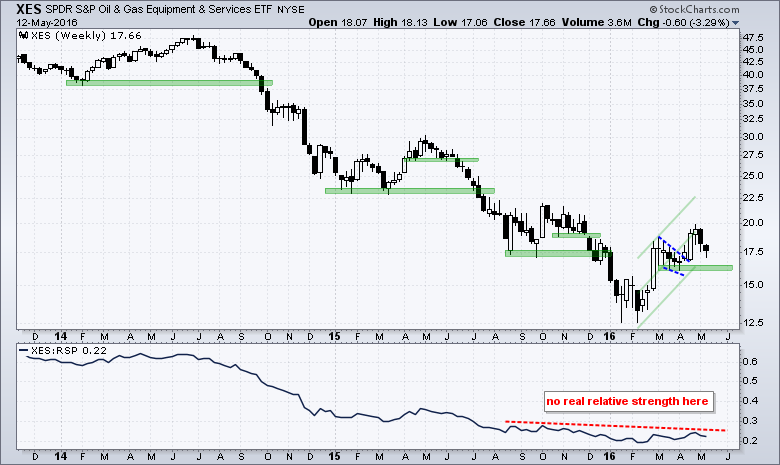
The Oil & Gas Equip & Services SPDR (XES) got a wedge breakout in early April and then fell back over the last two weeks. The breakout is largely holding and the 17.5 area marks the first level to expect support. The Raff Regression Channel and April low define the overall uptrend with support marked at 16.
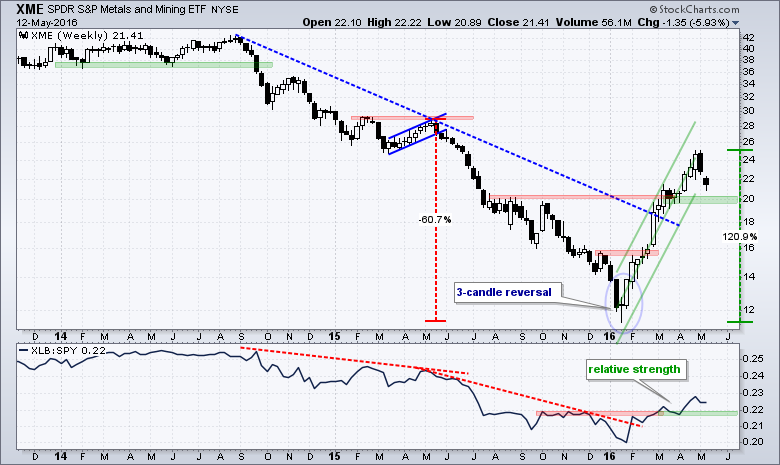
Despite a 120% surge from mid January to late April, the Metals & Mining SPDR (XME) remains well below its 2015 highs and has yet to fully recover the 60% plunge. Nevertheless, the immediate trend is up and I am marking first support in the 20 area. Broken resistance, the March consolidation and the Raff Regression Channel mark support here. A pullback into this area could be an opportunity.
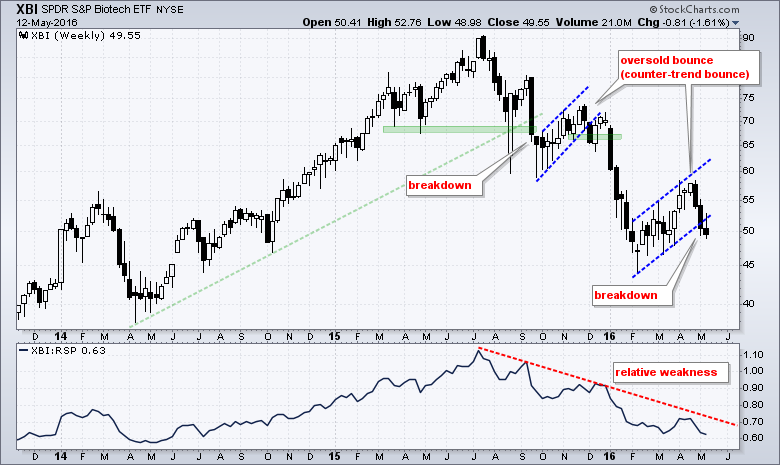
 The Biotech SPDR (XBI) cannot catch a break and continues to underperform. The ETF got an oversold bounce from mid February to mid April and then broke down over the last two weeks. The price relative hit a new low as well and biotechs are not the place to be right now.
Friday Food For Thought
General Electric's Business Strategy (Advisor Perspectives)
You may think that GE is a phenomenally complex firm, but you are mistaken. At its core, GE is simply betting on and allocating resources to profit from the continued flourishing of human civilization in all corners of the world.
The 3 Most Important Words in Investing (PensionPartners)
I. Don’t. Know. These three words, almost never uttered in this business, are far and away the most critical to long-term investment success. Why? Because the future is unpredictable, but having the humility to admit that is very hard for us to do.
Hardcore Bear ETFs Poised to Swell Past Bulls as Inflows Surge (Bloomberg)
Since the end of February, investors who use leveraged exchange-traded funds have sent $1.3 billion into exchange-traded notes that pay two or three times the inverse of the market’s return, meaning they go up when stocks fall. So big have been the inflows that the market capitalization of inverse products is on the verge of eclipsing bullish notes for the first time since 2013.
The Six-Hour Workday Works in Europe. What About America?
For about a year, nurses at the Svartedalens retirement home have worked six-hour days on an eight-hour salary. They're part of an experiment funded by the Swedish government to see if a shorter workday can increase productivity. The conclusion? It does.
3 Things you should Know about Factor Investing (BlackRock)
With factor strategies gaining in popularity, our Global Head of Smart Beta Sara Shores breaks down some common misconceptions and shares what you need to know.
The Pain Gap: Earning Returns vs. Enduring Returns (Morgan Housel)
Financial advisor Carl Richards dubbed what he calls "the behavior gap," which is the difference between what the market returns and what the average investor earns. It's caused by people's tendency to chase returns at the top only to get scared out at the bottom.
******************************************************
Measuring Risk On-Risk Off - Using charts to quantify stock, economic and credit risk.
PPO Trading Strategy - How to use 3 PPOs to develop a trend-reversion trading strategy.
Long-term Trend Indicators - Using the PPO, EMA Slope and CCI to determine the trend.
ETF Master ChartPack - 300+ ETFs organized in a Master ChartList and in individual groups.
Follow me on Twitter @arthurhill - Keep up with my 140 character commentaries.
****************************************
Thanks for tuning in and have a good day!
--Arthur Hill CMT
Plan your Trade and Trade your Plan
*****************************************


