SPY Tests the Gap // Giving QQQ a Little Wiggle Room // Broad Selling in Finance and Consumer Discretionary // XLF and XLI Test Breakout Resolve // Treasuries Reflect Risk-off Mode // Seven Stocks with Bullish Setups to Watch //// ...........
SPY Tests the Gap
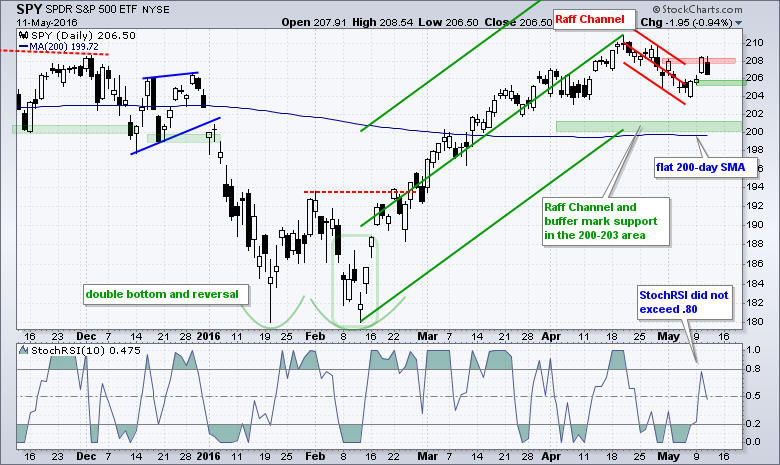
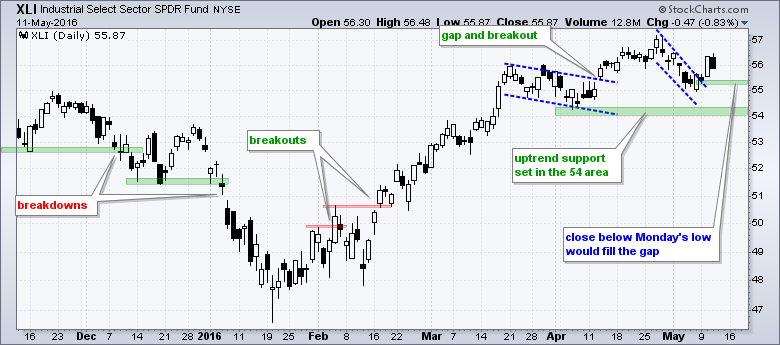
The S&P 500 SPDR (SPY) gapped up on Tuesday and close above 208, but gave it all back with a decline into the gap zone. Note that SPY has yet to completely fill the gap and this gap remains bullish. Monday's low mark support and a close below this level would fill the gap. Such a move would also negate Tuesday's breakout and could lead to a bigger support test in the low 200s.
Giving QQQ a Little Wiggle Room
QQQ formed a bullish engulfing on Friday and followed through with a short-term breakout on Tuesday. This breakout did not last long as the ETF fell back below 107 on Wednesday. I am willing to give this short-term breakout a little wiggle room and will set first support at Monday's low (green zone). A close below this level would negate follow through to the bullish engulfing and call for a reassessment.

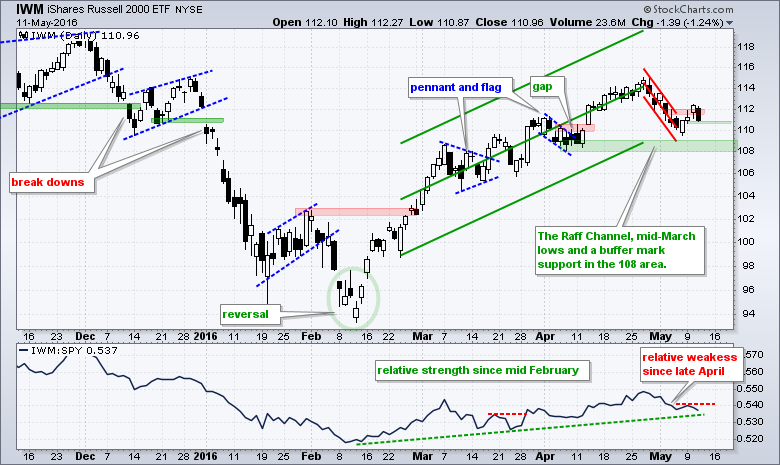
IWM and small-caps led the market lower on Wednesday. On the price chart, IWM broke out with a close above 112 on Tuesday, but fell back on Wednesday and gave up all the gains. As with SPY and QQQ, I am marking first support at Monday's low. A close below this level would call for a re-evaluation.
Broad Selling in Finance and Consumer Discretionary
Chartists can use daily breadth indicators for the sectors to see where the buying pressure and selling pressure are concentrated. The chart below shows AD Percent for the nine sectors and the S&P 500. AD Percent equals advances less declines divided by total issues. It is positive when advances outnumber declines and negative otherwise. Readings above 90% show broad buying and readings below -90% show broad selling.
XLY AD Percent ($XLYADP) and XLF AD Percent ($XLFADP) were both below -90% on Wednesday and this shows broad selling pressure in both sectors. Utilities AD% ($XLUADP) was the only one that finished positive on the day.
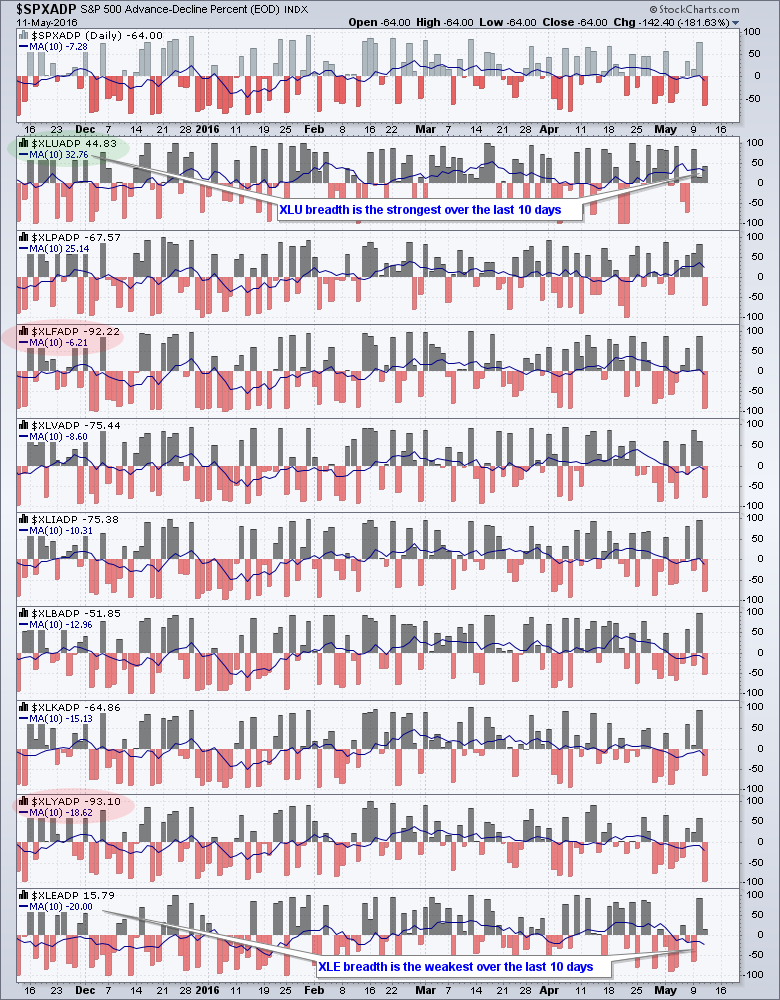
I also added a 10-day SMA to get an idea of the short-term trend for breadth and this chart is sorted by this moving average. Sectors with the strongest short-term breadth are at the top. Utilities and consumer staples show the strongest breadth over the last ten days. Consumer discretionary and energy have the weakest breadth. In an interesting twist, finance and healthcare are in third and fourth place. These may be two sectors to watch because they held up relatively well the last two weeks.
XLF and XLI Test Breakout Resolve
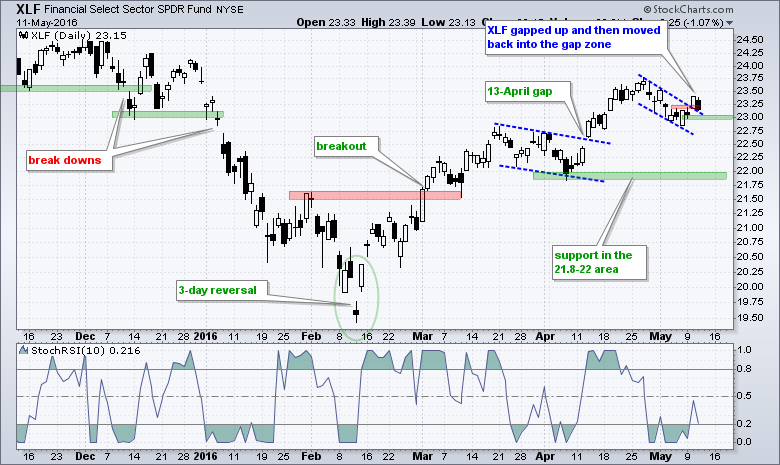
The Finance SPDR (XLF) and the Industrials SPDR (XLI) both broke out with gaps on Tuesday. Both fell back on Wednesday with XLF moving into the gap zone. I am marking first support at Monday's low (green zone). A close below this level would negate the short-term breakouts.
Treasuries Reflect Risk-off Mode
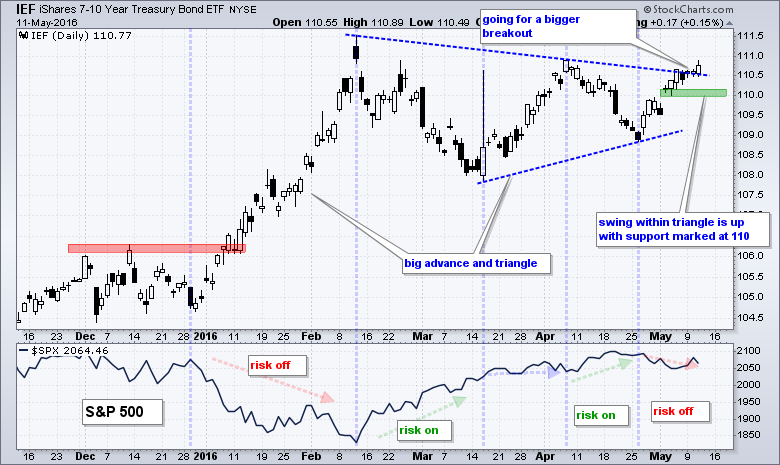
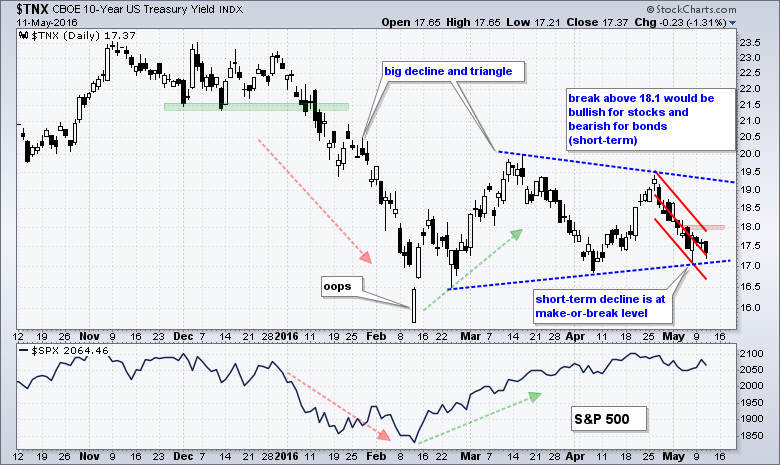
The risk on/off dynamic can be seen when we compare the 7-10 YR T-Bond ETF (IEF) and the S&P 500. The blue vertical lines mark significant peaks and troughs in IEF. First, notice how IEF surged from late December to mid February and the S&P 500 plunged. This was clearly risk-off because money moved from riskier assets (stocks) to safe-haven assets (Treasuries). The swings since mid March have been more subdued and we are currently in a risk-off swing. I am marking upswing support at 110 for IEF. The market prefers safety as long as this level holds and this risk-off preference could weigh on stocks. Strength in Treasury bonds is positive for utilities and negative for banks.
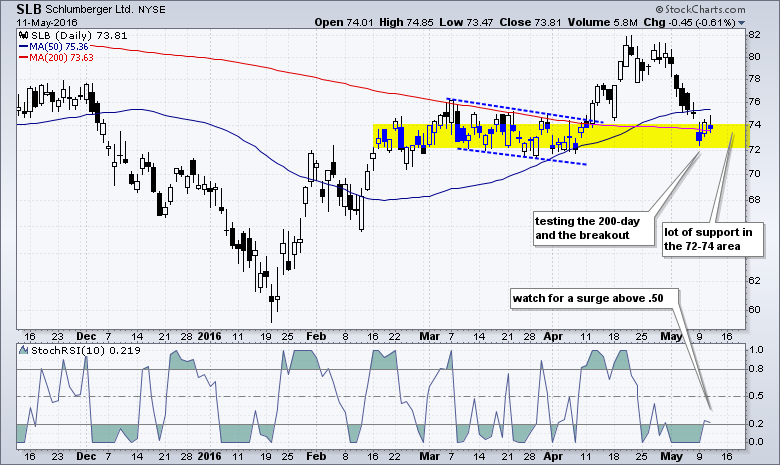
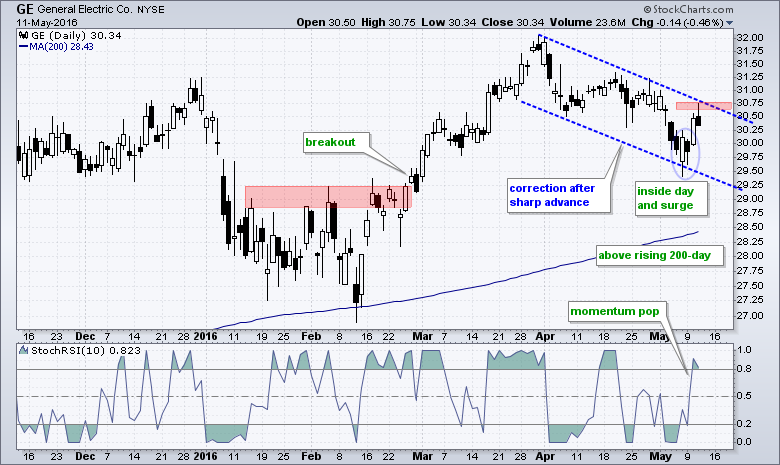
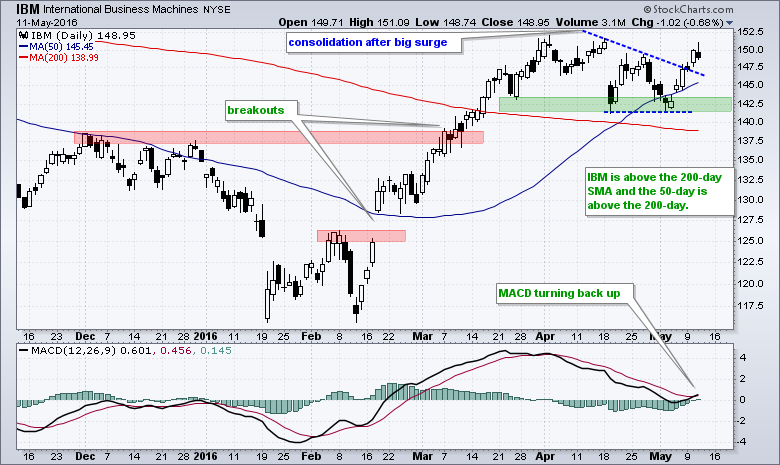
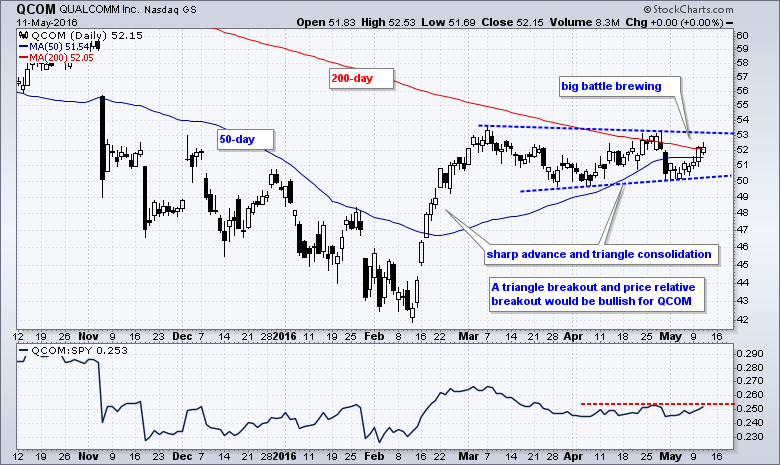
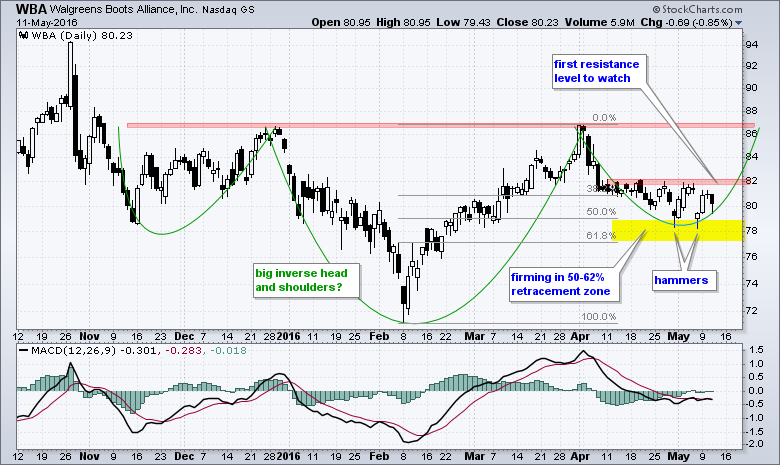
Seven Stocks with Bullish Setups to Watch
The next charts highlight some stocks with potentially bullish patterns. All seven have already reported earnings so that is out of the way. I still favor bullish setups because my broad market indicators are still bullish. There were price breakouts in the major index ETFs in late February. There was breadth thrust on March 3rd and High-Low Percent signaled in late March. These signals have yet to be negated.


******************************************************
Measuring Risk On-Risk Off - Using charts to quantify stock, economic and credit risk.
PPO Trading Strategy - How to use 3 PPOs to develop a trend-reversion trading strategy.
Long-term Trend Indicators - Using the PPO, EMA Slope and CCI to determine the trend.
ETF Master ChartPack - 300+ ETFs organized in a Master ChartList and in individual groups.
Follow me on Twitter @arthurhill - Keep up with my 140 character commentaries.
****************************************
Thanks for tuning in and have a good day!
--Arthur Hill CMT
Plan your Trade and Trade your Plan
*****************************************


