Midcaps Lead %Above 200-day EMA // High-Low Lines Continue to Rise // Healthcare and Industrials Lead New High List // Sectors Reflect Broad Market Strength // XLE and XLB Extend Breakouts // Metals & Mining and Oil & Gas Equip & Services SPDRs Extend Signals // Webinar Preview //// ....
Midcaps Lead %Above 200-day EMA
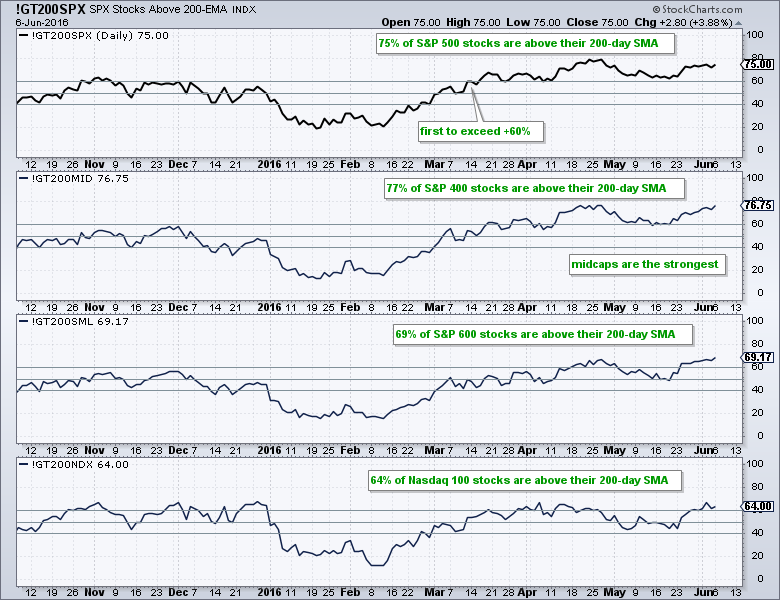
Stock market breadth remains strong and supportive of the current bull market environment. First up, I will show the percentage of stocks above the 200-day EMA. The chart below shows that 75% of stocks in the S&P 500 are above their 200-day EMA. Further, 77% of the S&P MidCap 400, 69% of the S&P Small-Cap 600 and 64% of the Nasdaq 100 are above their 200-day EMA. Moreover, this indicator could be in the middle of a move because it is not yet even close to an extreme, which would be above 90%. I really don't want to speculate on the future though. Instead, I am content to focus on the present and this indicator is bullish right now.
High-Low Lines Continue to Rise
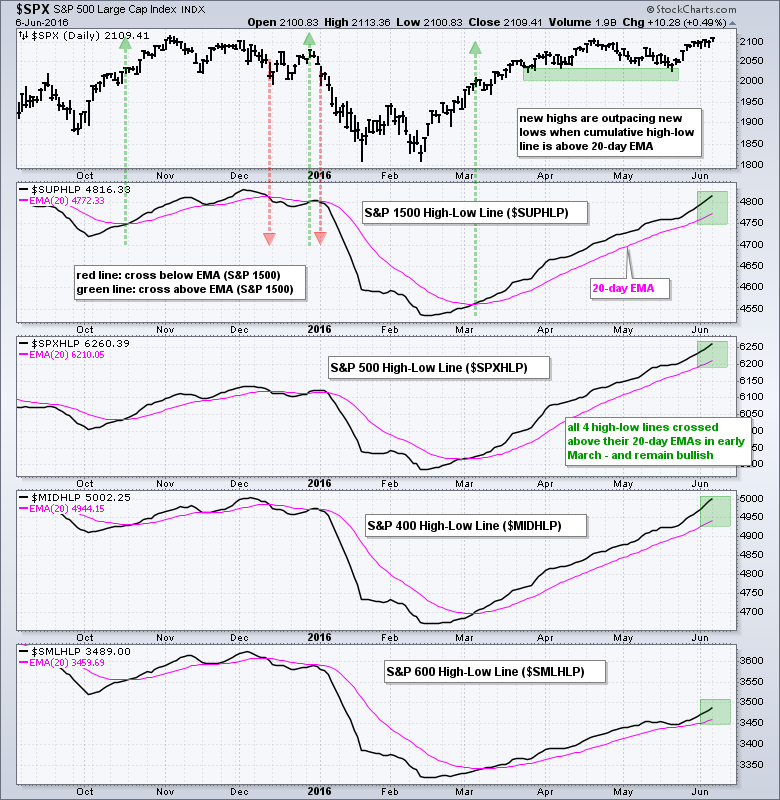
The High-Low Lines continue to rise and this means new highs are outpacing new lows. The High-Low Line is a cumulative measure of High-Low Percent ((new highs - new lows) / total issues)). It is bullish and rising when above the 20-day EMA (pink). Notice that all three High-Low Lines have been bullish since early March and all three remain well above their 20-day EMAs.
Healthcare and Industrials Lead New High List
The next chart shows High-Low Percent for the S&P 500 and the nine sector SPDRs. The histogram is a semi-transparent so we can see the 10-day EMA (red line). The indicator is sorted by the 10-day EMA, which means the sectors with the most new highs are near the top. You can see the sort values on the y-axis because I added these labels to the chart. The black outlines show the histogram values and the red outlines show the 10-day EMA. The utilities sector is the leader and this is not a surprise because XLU hit a 52-week high last week. The technology, healthcare and industrials are next in line and these three sectors account for the majority of new highs in the S&P 500. This is where we are seeing individual stock leadership.
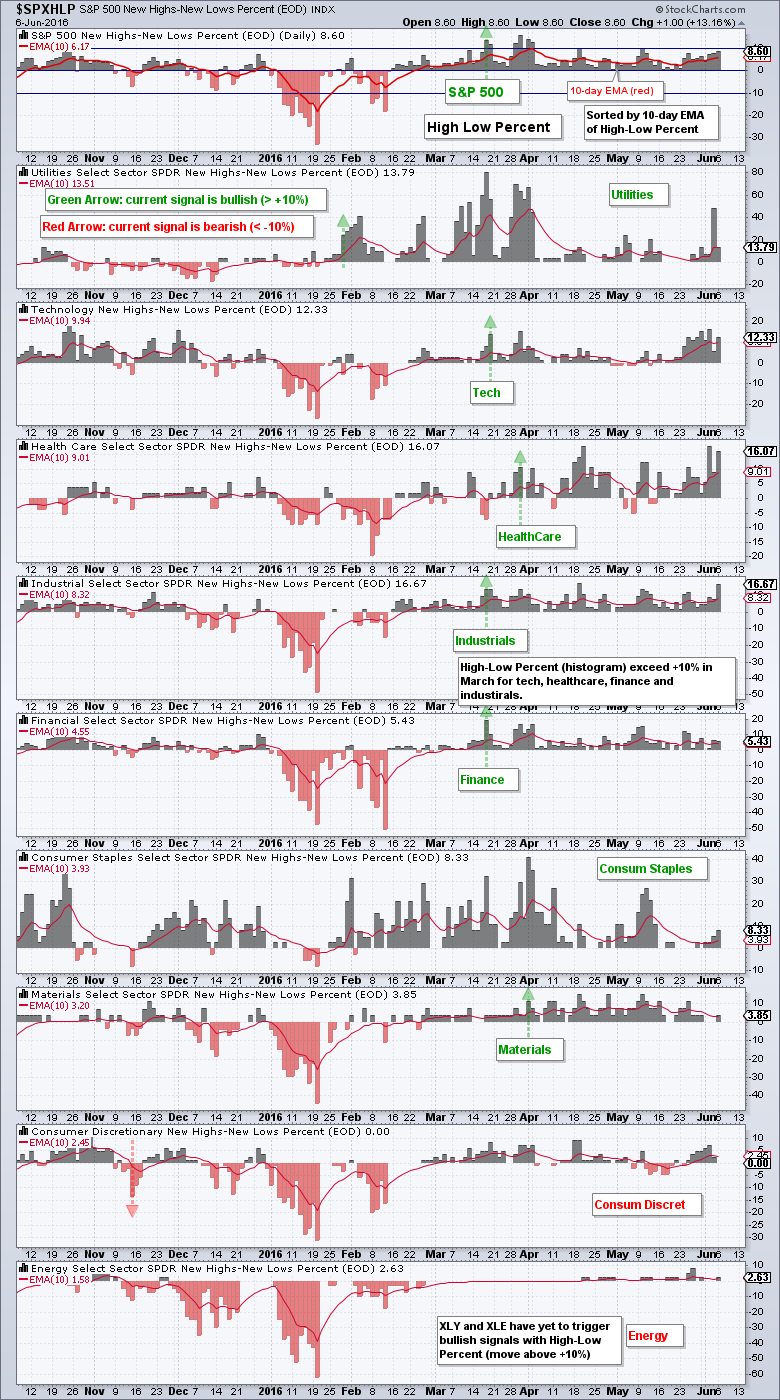
Also note that five of the High-Low Percent indicators turned bullish when they moved above +10% (green arrows). High-Low Percent for consumer staples and utilities was already in bull mode at the beginning of the year. This means seven of the nine High-Low Percent indicators are bullish and this validates the bull market environment. The consumer discretionary and energy sectors are the only two sectors still in bear mode for this indicator.
Sectors Reflect Broad Market Strength
All nine sector SPDRs are above their 50-day SMAs and 200-day SMAs, and the 50-day SMA is above the 200-day SMA for all nine. Even though this is a static statistic and subject to change in the coming weeks, it is bullish right now and supportive of a bull market environment. Overall, the May lows mark important support levels to watch in the coming weeks. I will not consider turning bearish unless we start seeing some support breaks. I will show all nine charts in today's webinar, but will only focus on a few in this commentary.
The indicator windows in each chart show the Fast Stochastic Oscillator (125,1), which measures the current price relative to the six month range. The higher the value is, the closer the SPDR is to a six month high. XLB, XLV, XLU, XLI and XLP are above 93 and close to six month highs. The table below ranks SPY and the nine sector SPDRs by this indicator. XLK, XLY and XLF are the furthest from their six month highs.
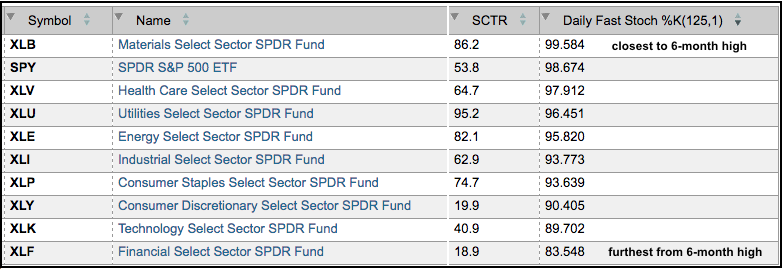
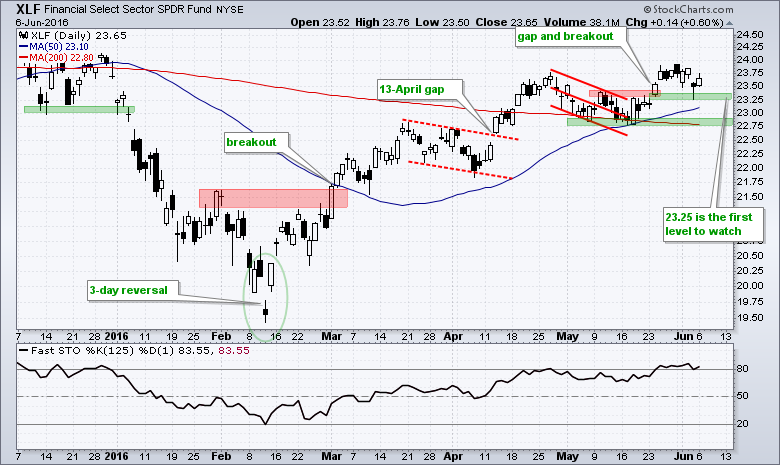
The Finance SPDR (XLF) broke out in late May, but struggled last week as the 10-YR Treasury Yield ($TNX) plunged. The overall trend remains up and the breakout in the 23.25-23.50 area is still holding. A close below 23.25 would call for a re-evaluation of the breakout.
XLE and XLB Extend Breakouts
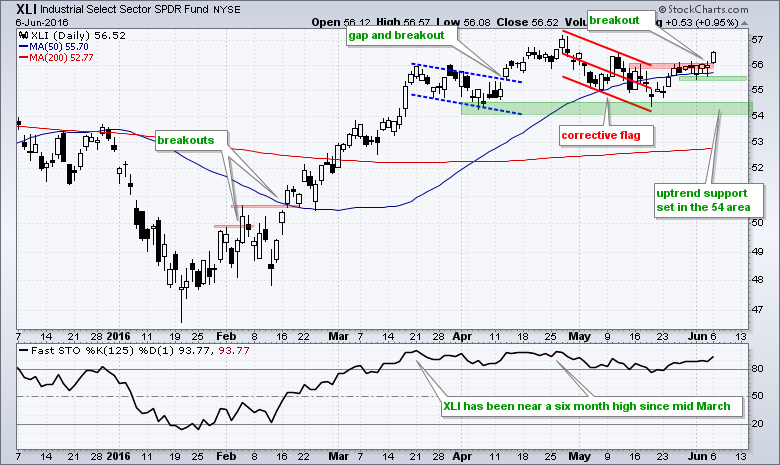
The Industrials SPDR (XLI) was in the spotlight in Monday's commentary and this SPDR broke out on Monday. This breakout is in play as long as the 1-June low holds. A close below 55.40 would call for a re-evaluation.
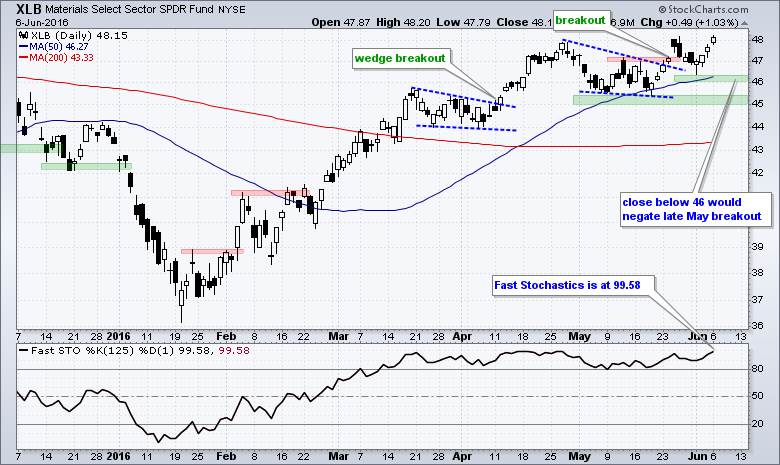
The Materials SPDR (XLB) broke out in late May, fell back last week and surged to a multi-month high on Monday. This breakout remains in play as long as the 1-June low holds (46). The May lows and a buffer mark long-term support at 45.
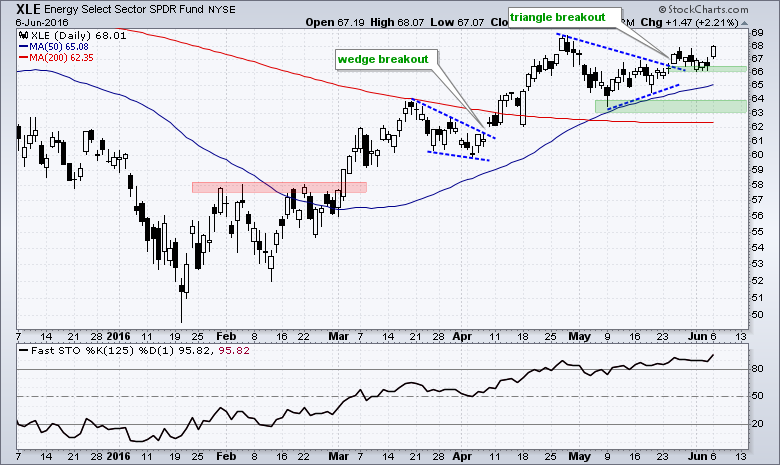
The Energy SPDR (XLE) finally extended on its triangle breakout with a pop on Monday. Chartists can now set the first re-evaluation level at 66. Overall, the trend remains up as long as support in the 63-64 area holds.
Metals & Mining and Oil & Gas Equip & Services SPDRs Extend Signals
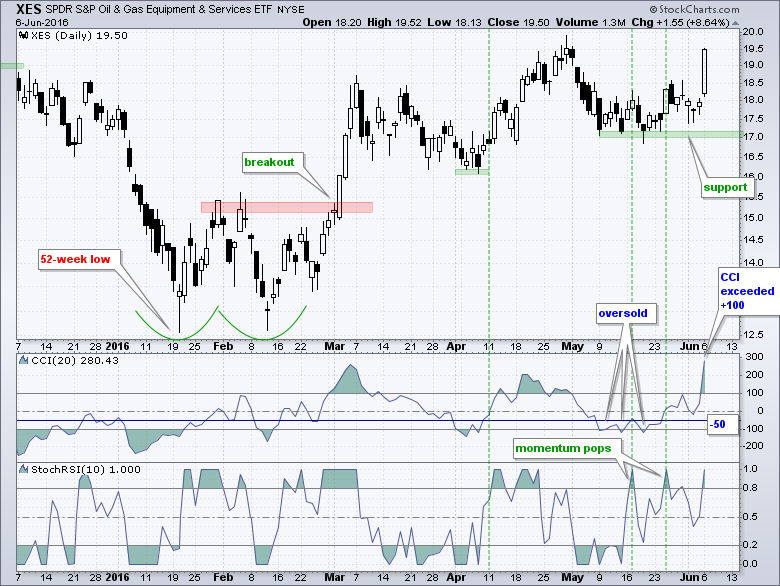
I featured the Metals & Mining SPDR (XME) and the Oil & Gas Equip & Services SPDR (XES) several times over the last few weeks because of a bullish setup and trigger. To recap, the bullish setup occurs when the overall trend is up and CCI(20) moves below -100 to signal a pullback. This pullback ends when StochRSI(10) pops above .80 and triggers a bullish signal. With signals triggering already, these two are currently "in signal", "in trend" or "in play".
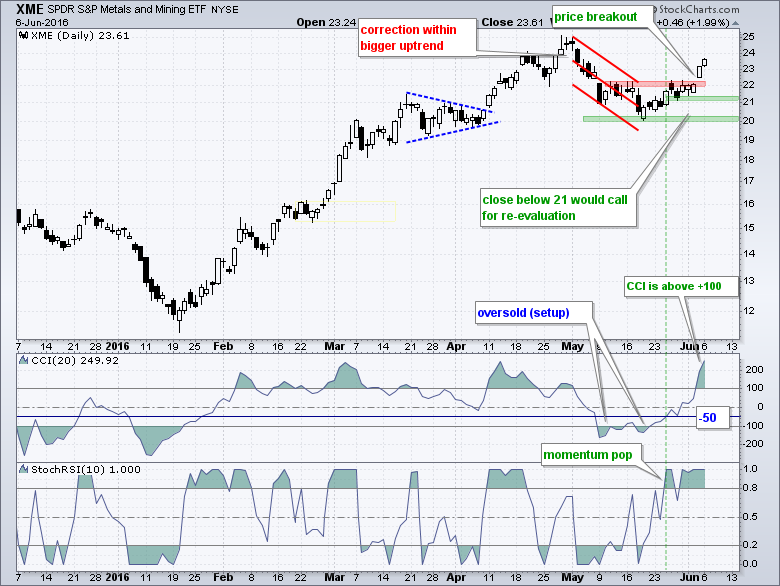
Once in a trade, I must manage the trade and look for an exit. Some traders may want to hold longer and use the May lows as support for the long-term trend. Short-term traders will likely be more aggressive and watch price action for signs of weakness. I would mark 21 as the first re-evaluation for XME. I would also use CCI now that it has exceeded +100. Momentum is clearly bullish as long as CCI holds above zero. A move into negative territory (say -50) would show weakness and could be used as part of an exit strategy.
****************************************â
Measuring Risk On-Risk Off - Using charts to quantify stock, economic and credit risk.
PPO Trading Strategy - How to use 3 PPOs to develop a trend-reversion trading strategy.
Long-term Trend Indicators - Using the PPO, EMA Slope and CCI to determine the trend.
ETF Master ChartPack - 300+ ETFs organized in a Master ChartList and in individual groups.
Follow me on Twitter @arthurhill - Keep up with my 140 character commentaries.
****************************************
Thanks for tuning in and have a good day!
--Arthur Hill CMT
Plan your Trade and Trade your Plan
*****************************************


