Small and Micros Continue to Lead // Big Techs Weigh on QQQ // QQQ Extends Stall // SPY Hits a New High // IWM Leaves the others in the Dust // 4 of 5 Small-cap Sector ETFs Hit New Highs // Most New Highs since June // Stocks of Interest: TJX, FCX, GS, CVS, DIS, F, ADP, SKX //// ........
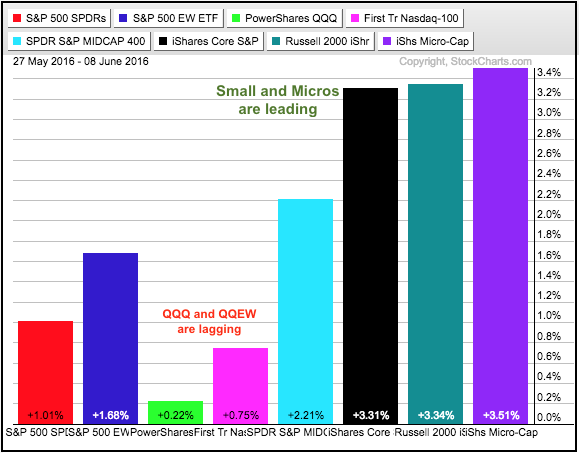
Small and Micros Continue to Lead
The broad market index ETFs are up sharply over the last eight days with small-caps leading the charge. The Russell 2000 iShares (+3.34%), S&P SmallCap iShares (+3.31%) and Russell MicroCap iShares (+3.51%) are up over 3%. The S&P 500 SPDR (+1.01%) and EW S&P 500 ETF (+1.68%) are also up, but much less. The Nasdaq 100 ETF (+.22%) and Nasdaq 100 EW ETF (+.75%) are up the least and showing relative weakness. It is positive to see small-caps leading because this reflects a strong risk appetite in the stock market. The only short-term negative is actually a long-term positive. Overbought is hard to quantify, but I would say small-caps are getting extended and ripe for a corrective period. The ability to become overbought, however, requires strong buying pressure and this is long-term bullish.
Big Techs Weigh on QQQ
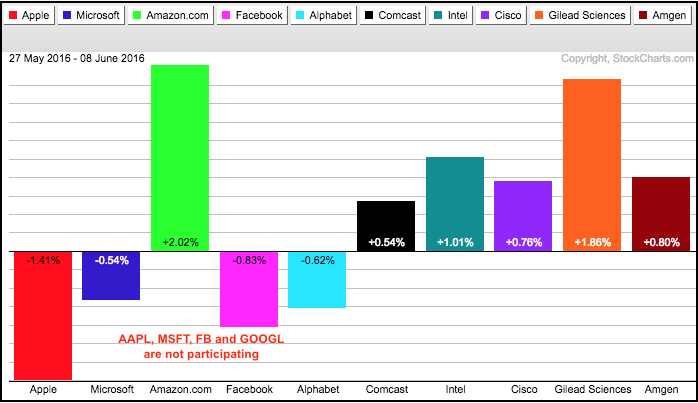
QQQ is lagging recently because Apple (-1.37%), Facebook (-1.43%) and Alphabet (-.79%) are down over this same period. Together, these three account for around 25% of QQQ. Also notice that Microsoft (+.40%) and Cisco (+.59%) are up less than 1% and contributing to relative weakness.
QQQ Extends Stall and Lags
On the price chart, QQQ moved above 110 in late May and then stalled the last seven trading days. A stall after a 5% surge is normal at this stage. Even a pullback or small correction back to the 108 area would be normal. There is some concern because QQQ was the only one of the major index ETFs that did NOT exceed its April high. This is a "benchmark" high and IWM was the first of the major index ETFs to break above it. Thus, a lower high could be forming in QQQ.
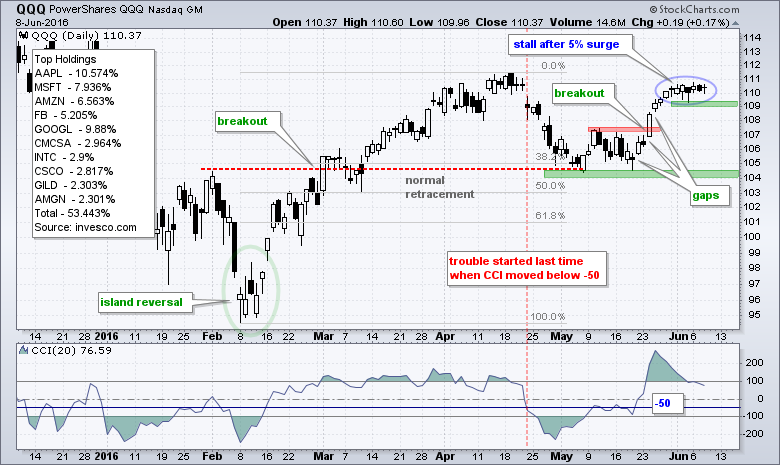
At what point does a pullback become worrisome for a short-term trader? This is, of course, the million Dollar question. The stall of the last seven days established support at 109 so a break here would provide the first negative sign on the price chart. I am also watching CCI(20) for a move below -50. The move in April proved timely from a short-term standpoint, but this does not guarantee a timely signal in the future.
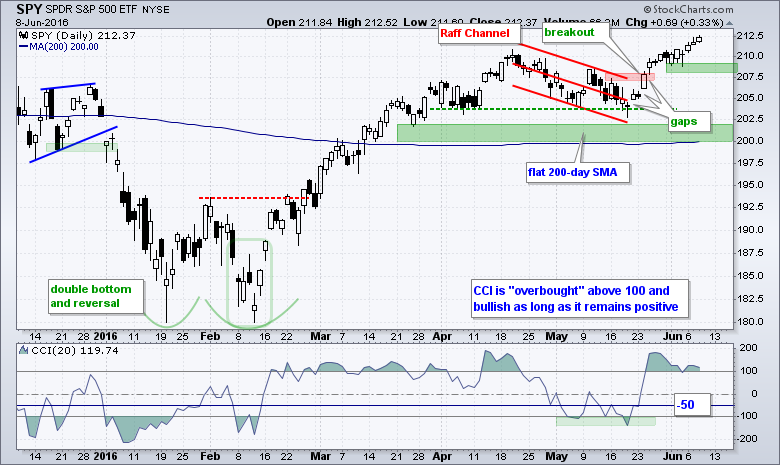
SPY Hits a New High
SPY moved to a new high on Wednesday and this reflects strength in the broader market (nine sectors and 500 stocks). The June lows mark first support in the 208-209 area for short-term traders. Longer-term, the May lows and 200-day SMA hold the key to the uptrend that began with the February breakout. Note that the 200-day SMA started to turn up again this week.
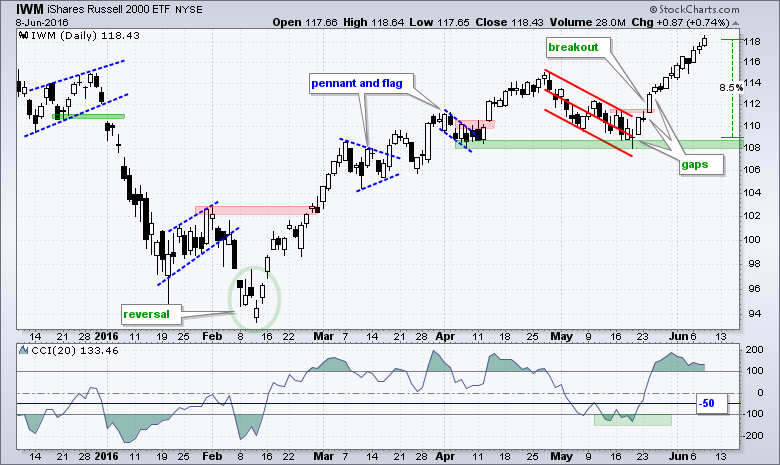
IWM Leaves the others in the Dust
IWM is up over 8% in three weeks and clearly leading the pack. The ETF is entitled to a pullback or consolidation at this stage, but I have no idea where to mark short-term support because the 3-week advance is pretty much straight up. I will watch CCI for a move below -50% to suggest enough weakness to move aside. I would not turn bearish because the bigger trend is up and long-term support remains at 108.
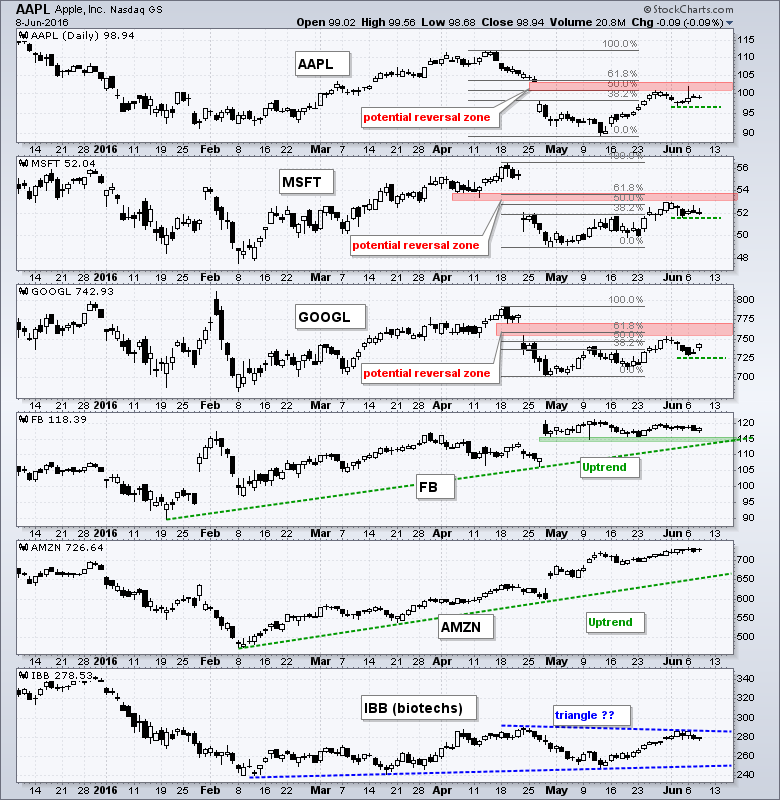
Apple, Microsoft and Alphabet Hit Potential Reversal Zones
The next chart shows the top five stocks in QQQ and the Biotech iShares (IBB), which represents biotechs. Amazon and Facebook are in uptrends and the strongest of the five. AAPL, MSFT and GOOGL bounced over the last five weeks and hit their gap zones. Notice that all three retraced around 50% of their prior declines. The five week trends are up right now, but I will be watching these three closely because they are in potential reversal zones (gap resistance and 38.2-61.8% retracement area). The green dashed lines mark first support and breaks here would reverse the five week uptrends.
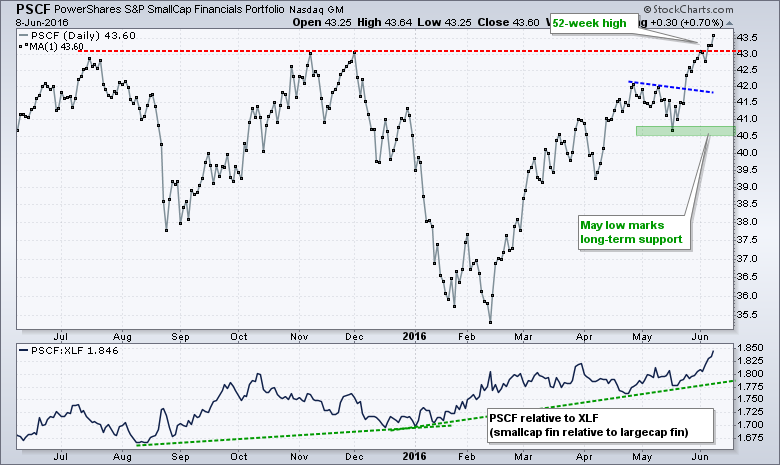
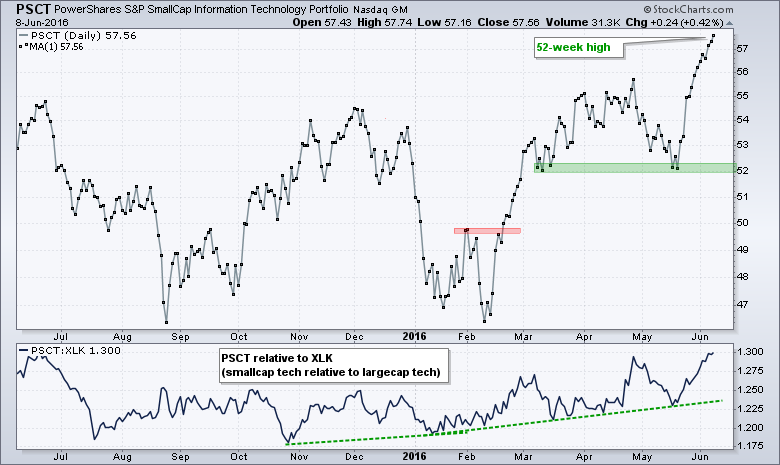
4 of 5 Small-cap Sector ETFs Hit New Highs
The small-cap sector ETFs are not the most liquid, but chartists can still use them to breakdown the S&P Small-Cap 600. With surges the last two weeks, the SmallCap Technology ETF (PSCT), SmallCap Financials ETF (PSCF), SmallCap Utilities ETF (PSCU) and SmallCap Consumer Staples ETF (PSCC) hit new highs. Utilities and staples are defensive sectors, but technology and finance are offensive sectors. Even though the large-cap Finance SPDR and Technology SPDR are dragging their feet the last seven trading days, their small-cap cousins are still charging and showing relative strength. The only issue is that they have run far and fast over the last thirteen days and they are ripe for a pullback or consolidation.
Here are the nine symbols for the small-cap Sector ETFs:
IJR,PSCD,PSCF,PSCT,PSCI,PSCM,PSCE,PSCH,PSCC,PSCU
Here are the nine symbols for the equal-weight Sector ETFs:
RSP,RCD,RYF,RYT,RGI,RTM,RYE,RYH,RHS,RYU
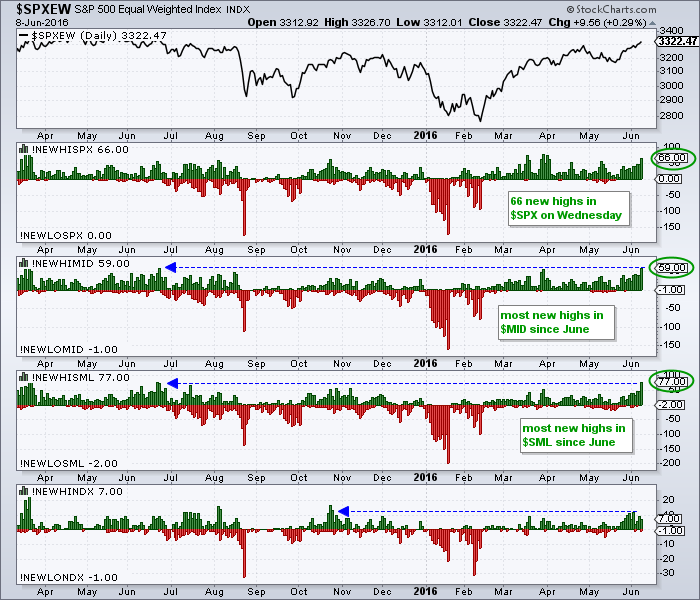
Most New Highs since June
New highs surged within the S&P Small-Cap 600 and S&P MidCap 400 and hit their highest level since June 2015. There were 59 new highs in $MID and 77 new highs in $SML. Also notice that High-Low Percent exceeded +10% for both indexes. This is just another sign of broadening strength that is bullish for the market overall.
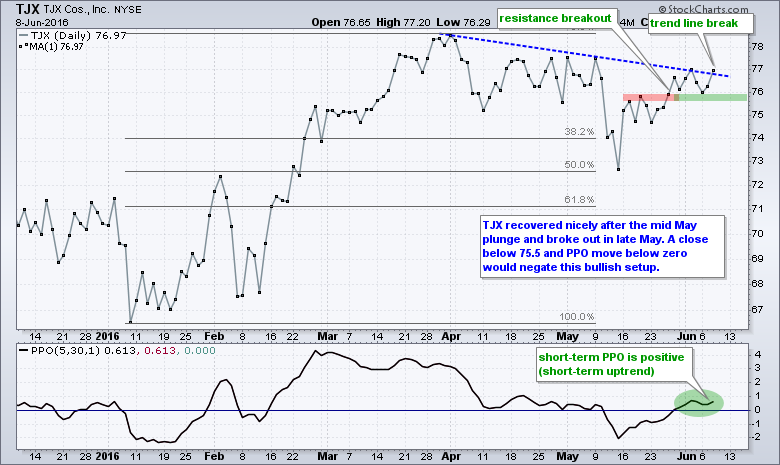
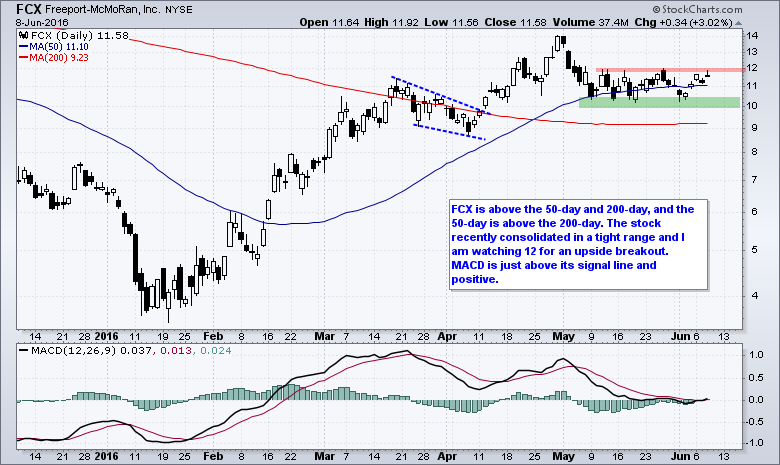
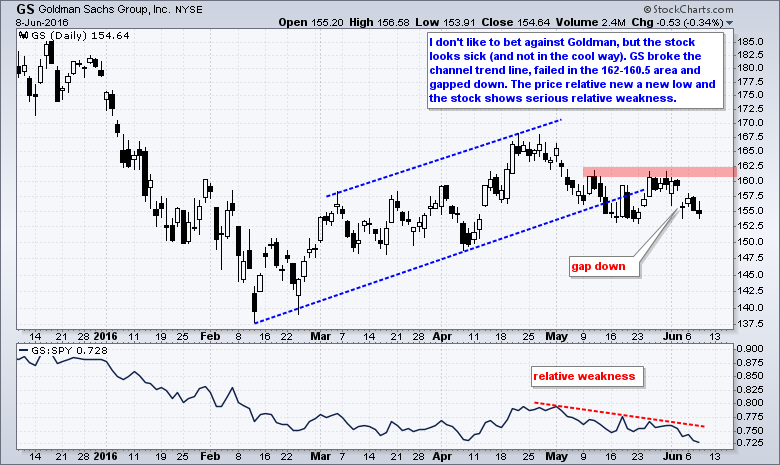
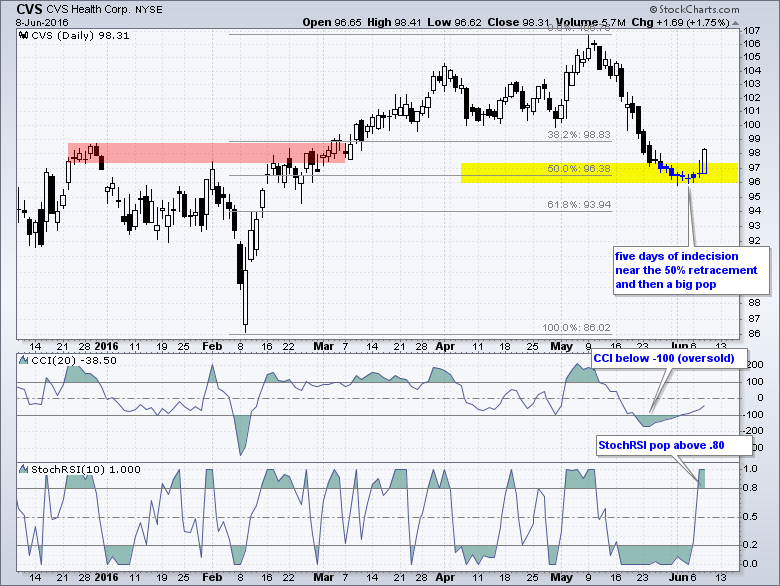
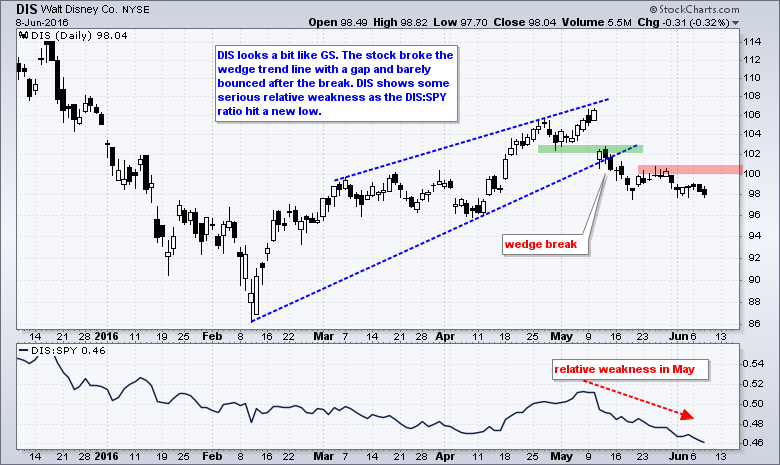
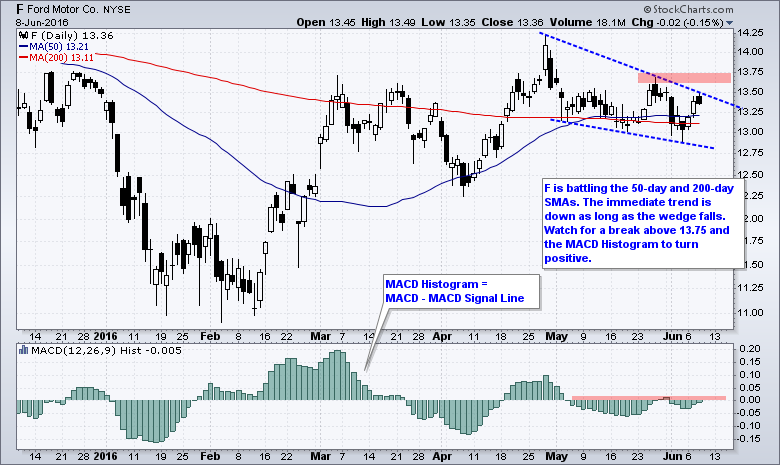
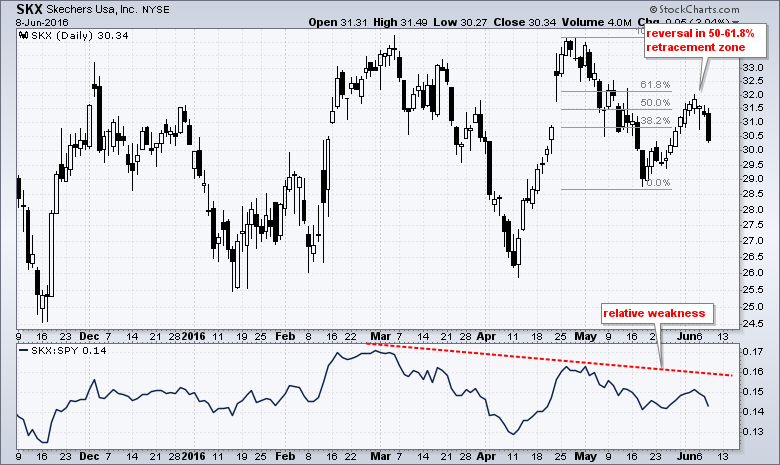
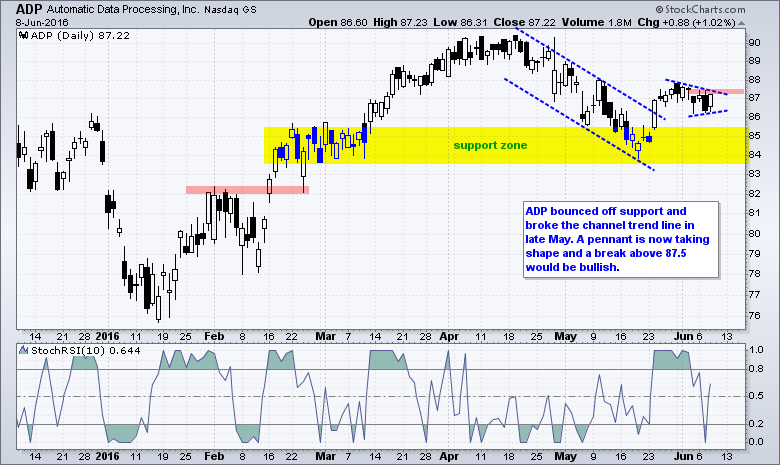
Stocks of Interest: TJX, FCX, GS, CVS, DIS, F, ADP, SKX
******************************************************
Measuring Risk On-Risk Off - Using charts to quantify stock, economic and credit risk.
PPO Trading Strategy - How to use 3 PPOs to develop a trend-reversion trading strategy.
Long-term Trend Indicators - Using the PPO, EMA Slope and CCI to determine the trend.
ETF Master ChartPack - 300+ ETFs organized in a Master ChartList and in individual groups.
Follow me on Twitter @arthurhill - Keep up with my 140 character commentaries.
****************************************
Thanks for tuning in and have a good day!
--Arthur Hill CMT
Plan your Trade and Trade your Plan
*****************************************


