Keep Calm and Carry On // S&P 500 Set for Key Support Test // FTSE Gets Turned Inside Out with Volatility // Smoothing out the Volatility // French and German Markets Bear the Brunt //// .....
Keep Calm and Carry On
The markets are reacting violently to the Brexit vote and one could even say there is panic in the air. It is difficult to analyze a knee-jerk reaction and it is often best to wait for the dust to settle. Furthermore, it is not even clear when the negotiation process between the UK and Europe will begin. When (and if) it does begin, it will likely be a long and drawn out affair with deadlines, extensions and emergency sessions into the wee hours. Thus, we can expect more volatility in the days, weeks and months ahead, particularly in European and UK equities, and related currency markets.

S&P 500 Set for Key Support Test
On the US side, short-term trading has been a challenge and the environment could remain challenging. Longer term, I will keep my eye on the key trend indicators, important support levels and breadth indicators for signal changes. In other words, the charts still rule the roost and I will remain bullish on US stocks until I get a signal to the contrary.
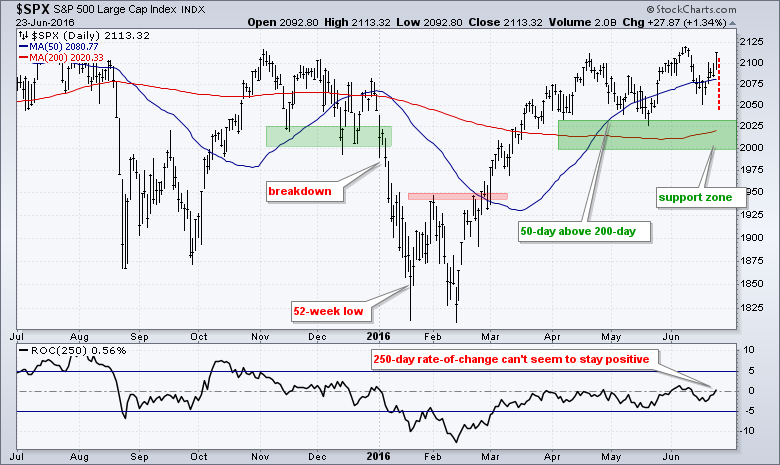
As of this writing, the S&P 500 is projected to open around 2040, or some 70 points lower (~3.5%). It is a big decline, but my eyes are on the April-May lows, the rising 200-day moving average and the 2000 level. This makes for a support zone in the 2000-2030 area. Note that the 200-day moving average is around 2020 and the 50-day SMA remains well above the 200-day SMA. I will update the breadth charts and weekly charts on Monday.
FTSE Gets Turned Inside Out with Volatility
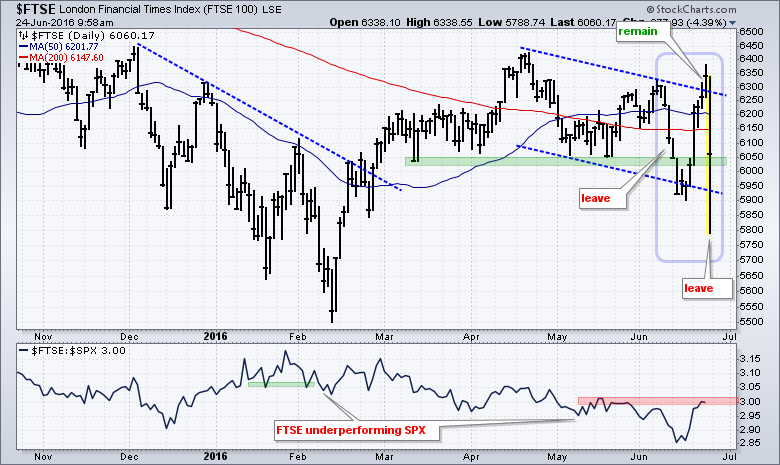
The FTSE 100 Index ($FTSE) has been all over the place the last three weeks with three 5+ percent swings. The chart below shows the index plunging below 6000 as market perceptions shifted from leave to remain to reality. The index broke through 6000 in early trading on Friday and then moved back above this key level. Who knows where it will close.
Smoothing out the Volatility
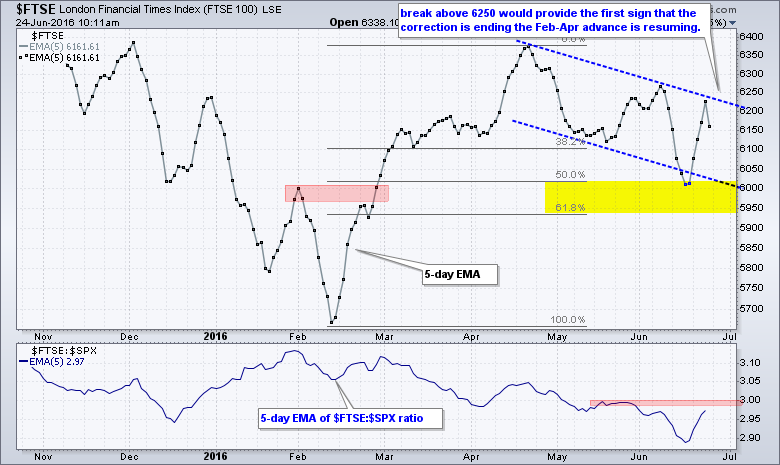
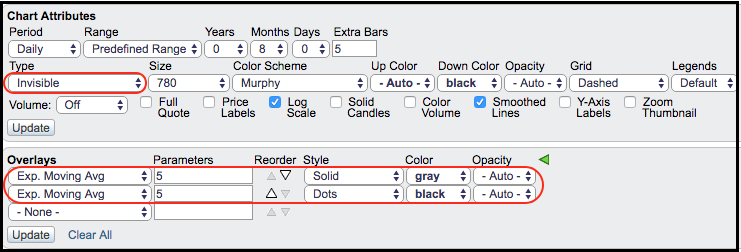
The next chart shows $FTSE as a 5-day EMA to smooth out the price swings. The actual $FTSE plot is invisible and this makes the 5-day EMA the main plot. I included a screen shot of the settings below and you can always click on this chart to see the settings and/or save it to one of your ChartLists. The 5-day EMA has been trending lower since mid April, but the overall pattern still looks like a correction after a sharp advance. Why? Because a falling channel of sorts took shape and the index retraced 50-61.8% of the prior advance. The immediate trend, however, is down as long as the index remains within the channel. Look for the 5-day EMA to close above 6250 for the first signs of a breakout.
French and German Markets Bear the Brunt
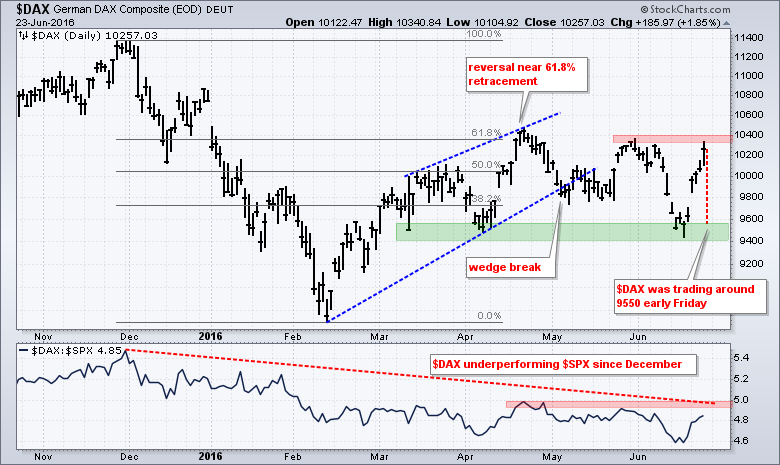
UK stocks are certainly getting hammered today, but the German DAX Index ($DAX) and French CAC Index ($CAC) are getting hammered even harder. $FTSE was down around 5%, while $DAX was down around 6.5% and $CAC was down around 8%. What is the market telling us? At the risk of reading too much into a kneejerk reaction, the bigger declines in Germany and France suggest that Europe has a bigger challenge ahead than the UK.
The charts for the German DAX and French CAC look bearish. The first chart shows $DAX retracing around 61.8% of the December-February decline and reversing near this retracement. The index broke the wedge trend line and then formed lower highs in May and June. A test of support in the 9400-9600 is underway, but I expect a support break because the wedge breakdown signaled a continuation of the December-February decline. In other words, support levels are not expected to hold when the trend is down.
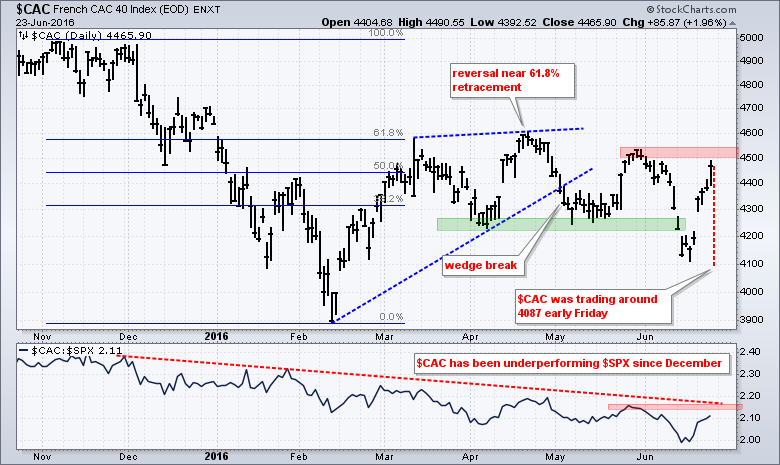
 $CAC is in even worse shape because the index broke the April-May lows in mid June and is trading below these level early Friday.
 ******************************************************
Measuring Risk On-Risk Off - Using charts to quantify stock, economic and credit risk.
PPO Trading Strategy - How to use 3 PPOs to develop a trend-reversion trading strategy.
Long-term Trend Indicators - Using the PPO, EMA Slope and CCI to determine the trend.
ETF Master ChartPack - 300+ ETFs organized in a Master ChartList and in individual groups.
Follow me on Twitter @arthurhill - Keep up with my 140 character commentaries.
****************************************
Thanks for tuning in and have a good day!
--Arthur Hill CMT
Plan your Trade and Trade your Plan
*****************************************


