 |
.... Testing the PPO Strategy |
Testing the PPO Strategy
Today I will test some trading systems using the Percentage Price Oscillator (PPO) and its signal line. These tests will include the classic exponential moving average pair used in MACD so we will essentially be testing MACD signal line crossovers. Instead of testing the major stock indexes, these tests will be on stocks in the S&P 1500. I will look at some different settings for the PPO and then see how we can improve the results. Programming Note: This article was originally published using stocks in the S&P 500. It has since been revised using stocks in the S&P 1500.
Beware of Survivorship Bias
Before getting started, it is important that we understand survivorship bias. I could just run a backtest with the current constituents of the S&P 1500, but this would be quite biased because it would only show the surviving members of the index. Even though changes in the S&P 1500 seem fairly minimal, note that around half the stocks in the index have changed since 1999. Thus, a 20-year backtest using current constituents would not reflect conditions as they were back in 1996.
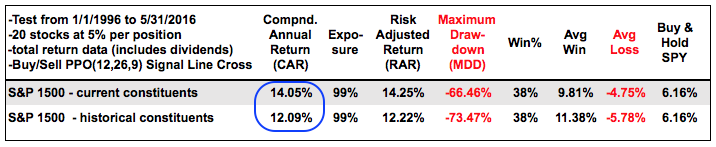
The table above shows results for a backtest using PPO(12,26,9) and its signal line for trading signals. A buy signal triggers when the PPO moves above its signal line and a sell signal triggers when it moves below its signal line. These tests were for long positions only. Notice that the system returned 14.05% based on current constituents and 12.09% based on historical constituents. Thus, there is a clear survivorship bias present when using the current constituents. Where did I get this data? I am running these tests using Amibroker with Premium Data from Norgate. The data is adjusted for dividends, just like we do at StockCharts.
Setting the Ground Rules
Before getting into some other tests with the PPO, let's first establish the common guidelines. The Percentage Price Oscillator (PPO) is just the percentage version of MACD. I am using the PPO instead of MACD because I will add a pullback rule later in the testing. Here are the common criteria:
- S&P 1500 stocks (historical constituents)
- Data is based on total returns and includes dividends
- Tests run from 1/1/1996 to 5/31/2016
- Results are based on a portfolio of 20 stocks
- Portfolio is equally weighted with 5% for each position
- Commission and slippage were not included
- The 125-day Rate-of-Change is used to break ties
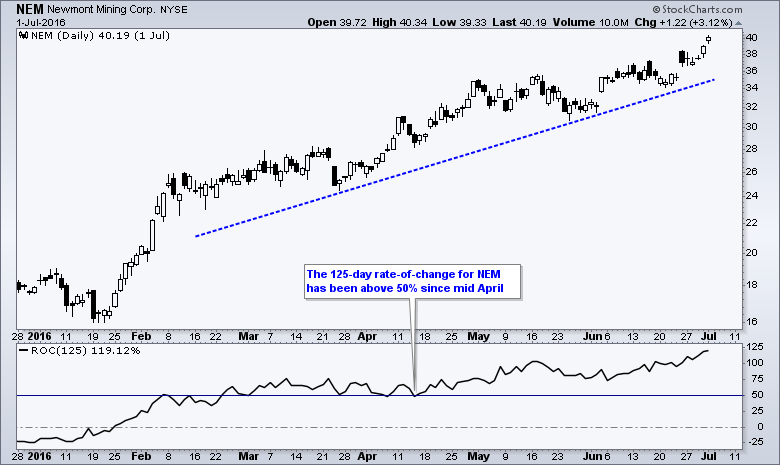
The Rate-of-Change is important because sometimes there are often more than 20 signals at any given time. The system must, therefore, have a means to choose among these signals. I chose the 125-day Rate-of-Change because it is a measure of relative strength when used to rank stocks. Stocks with the biggest gains over this period are the leaders and they will be selected over stocks with smaller gains (less relative strength). Keep in mind that this is only used as a tie-break and not all picks require a tie-break.
Putting Three PPOs to the Test
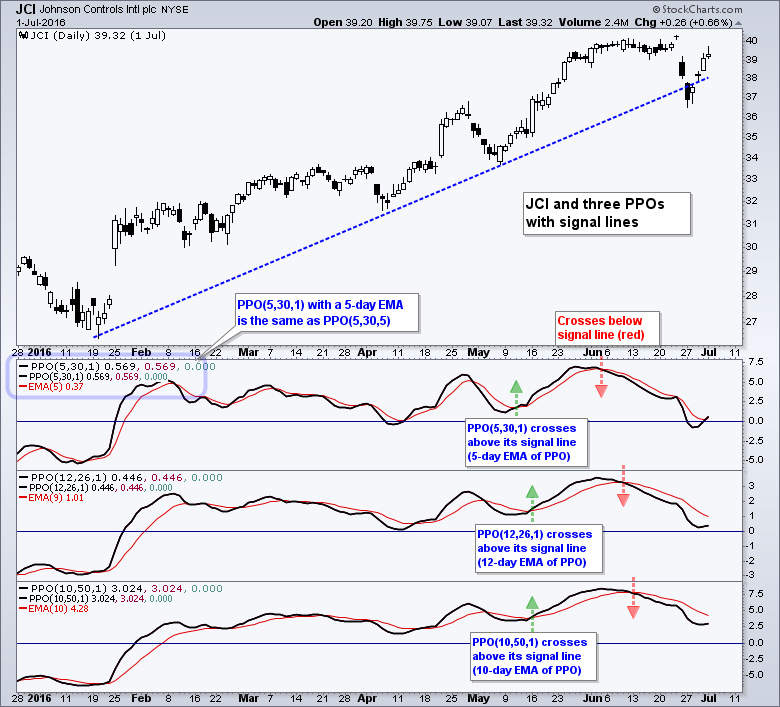
The Johnson Controls chart shows the three PPOs to be tested: PPO (5,30,5), PPO (12,26,9) and PPO (10,50,10). Note that these indicators are shown without the signal lines in the formula so I could remove the histogram. Thus, PPO (5,30,5) becomes PPO (5,30,1) with a 5-day EMA added using the advanced indicator options on the SharpChart.
The table below shows the results for these three tests as well as buy-and-hold for SPY. Note that buy-and-hold SPY returned 6.16% per year with a 56.5% maximum drawdown (loss). The Compound Annual Return (CAR) was best for PPO (12,26,9) and the worst for the PPO(10,50,10). All three systems had very large drawdowns (-74%), which means one would have been down -74% at the worst point over the 20 year test (think 2008).
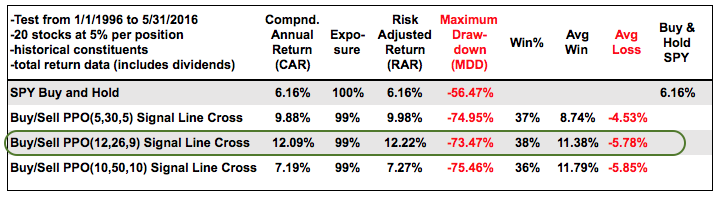
All three systems had a win rate in the upper 30s (36-38%), which means over 60% of the trades lost money. Chartists considering these systems should have a relatively strong stomach! The systems were profitable because the average win was greater than the average loss. The PPO (12,26,9) showed an average gain of 11.38% and the average loss of 5.78% for a win/loss ratio around 2 to 1.
Reducing Drawdowns with Trend Filters
The tests above show that a basic PPO signal line crossover system is unacceptable because the Maximum Drawdowns are way too high. One would have been better off with buy-and-hold, especially if commissions, slippage and mental anguish were included in the calculations.
We need a way to reduce the Maximum Drawdown and improve the Risk-adjusted Return. The next tests will add three rules to help improve the results. I will add these rules one at a time so we can see how the results progress trend. First, I will use the PPO (12,26,9) because it tested best. Second, I will add a trend rule for the S&P 500 (market). I am sticking to a long only strategy and will only consider bullish signals when the 5-day EMA of the S&P 500 is above the 200-day EMA. The system will be out of the market when the 5-day EMA of the S&P 500 is below the 200-day EMA.
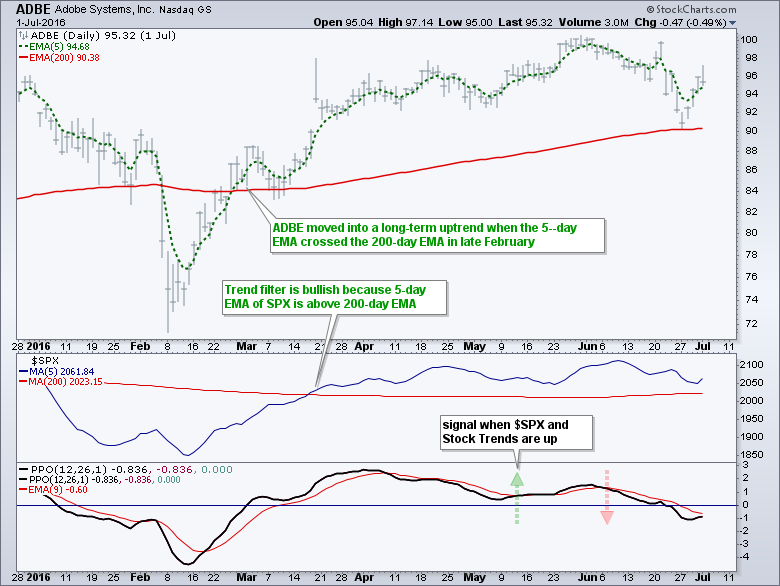
The second rule is a trend rule for the stock itself. I want the 5-day EMA of the stock to be above the 200-day EMA. In other words, I want the stock to be in a long-term uptrend. The two trend rules are designed to reduce the drawdowns by insuring uptrends in both the stock and the stock market benchmark.
Boosting Returns with a Pullback Rule
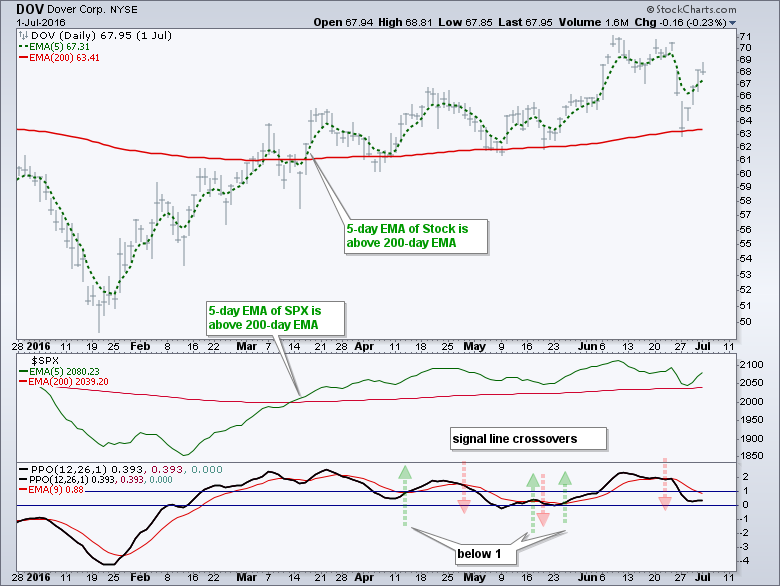
In an effort to boost returns, I am adding a rule to require the PPO(12,26,9) to be below 1% within the last 5 days of the signal. This means the system will ignore signals when the PPO is at relatively high levels (say greater than 3%). This means signal line crossovers will trigger at lower levels. The chart below shows Dover Corp with the S&P 500 in an uptrend and the PPO dipping below 1 in April and May for signal setups.
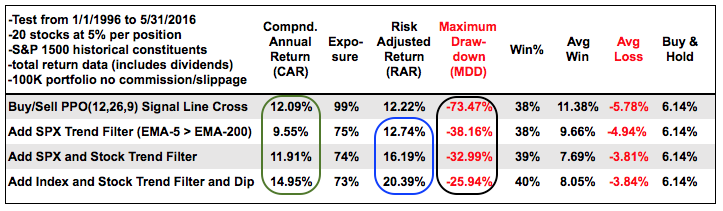
Backtesting the Trend Filters and the Dip
The table below shows backtest results after each filter is applied. First, notice that the Maximum Drawdown fell after each filter was applied. Second, notice that the Risk-adjusted Return increased each time as well (blue oval). Third, notice that the Compound Annual Return jumped when I added the pullback rule. Requiring an uptrend and waiting for a pullback clearly adds value. The low Win% is the downside to these systems. The Win% ranged from 38 to 40 percent and this means the around 60% of the trades were losing trades. The system makes money because Average Gain is around twice the Average Loss.
Testing the Original PPO Strategy
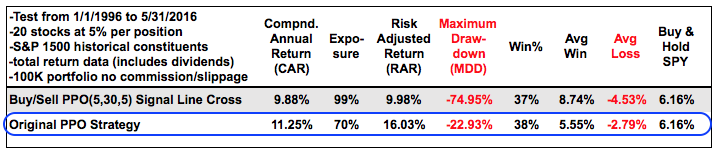
I wrote a lengthy piece detailing a trading strategy using three PPOs (original PPO strategy: the short-term PPO (5,30,1), medium-term PPO (10,60,1) and the long-term PPO (20,120,1). A bullish setup occurs when the medium-term and long-term PPOs are positive, and the short-term PPO dips below 1. A buy signal then triggers when the short-term PPO moves above its signal line (5-day EMA). This is as good at time as any to put this strategy to the test. The table below shows the original PPO strategy outperforming a basic signal line cross system using the PPO (5,30,5). The drawdown is much lower and the Risk-adjusted Return is higher.
Final Thoughts
The Percentage Price Oscillator (PPO) can be part of an effective trading strategy when chartists take into account the trend for the broader market. A basic signal line crossover system for the PPO (12,26,9) improved by requiring an uptrend in the S&P 500, an uptrend in the stock and pullback (PPO < 1).
With just 20 portfolio positions, the PPO(12,26,9) strategy generated around 7000 trades over a 20 year period, which averages out to around 340 trades per yea. The average hold was around four weeks so this is clearly a short-term strategy for active traders.
I run these simulations to get an idea of what to expect when trading in real time. Keep in mind that past performance does not guarantee future performance. This test was performed on stocks in the S&P 1500, which means there were lots of small-caps and mid-caps in the mix. The backtest may not look the same if using the S&P 100 or S&P 500.
These trading strategies were tested using Amibroker with coding help from Cesar Alvarez of AlvarezQuantTrading.com. Cesar wrote High Probability ETF Trading, Short-term Trading Strategies that work. For more information about his testing and consulting services, click here.
******************************************************
Measuring Risk On-Risk Off - Using charts to quantify stock, economic and credit risk.
PPO Trading Strategy - How to use 3 PPOs to develop a trend-reversion trading strategy.
Long-term Trend Indicators - Using the PPO, EMA Slope and CCI to determine the trend.
ETF Master ChartPack - 300+ ETFs organized in a Master ChartList and in individual groups.
Follow me on Twitter @arthurhill - Keep up with my 140 character commentaries.
****************************************
Thanks for tuning in and have a good day!
--Arthur Hill CMT
Plan your Trade and Trade your Plan
*****************************************


