Thinking about Stops and Exits // Surge and Zigzag Advance // Small-caps Continue to Lead // Brexit, the FTSE and the Pound // Industrials Sector Remains Strong // Sector Table Supports Broad Market Uptrend // Index Table Remains Firmly Bullish // Webinar Preview // Scan Code for Outperformance //// .....
Thinking about Stops and Exits
Before getting into some broad market analysis, let's get into the nitty gritty of trading with some talk about exits and stops, which have been on my mind a lot lately. Basically, SPY and QQQ pulled back a little further than I thought they would and then bounced. Grr.... Maybe it was the hype surrounding the Brexit vote, maybe not. Whatever the case, setting stops and exit targets is perhaps the biggest challenge in trading.

The SPY decline from mid April to mid May was always viewed as a pullback within a bigger uptrend. The only question was when would it end. The first clues came with the gaps on 20 and 24 May. A StochRSI signal triggered with a surge above .80 on 24-May (blue dotted line) and SPY broke out on 25-May. The advance from mid May to mid June extended 4% as SPY hit 211 on June 8th and the ETF was entitled to a pullback at this point. I was using CCI (20) and expecting it to hold above -50 on a normal pullback, but it dipped below -50 last week and exceeded my expectations. Even though CCI dipped below -50, I did not view this as a significant bearish development because the decline was still viewed as a pullback within an uptrend.
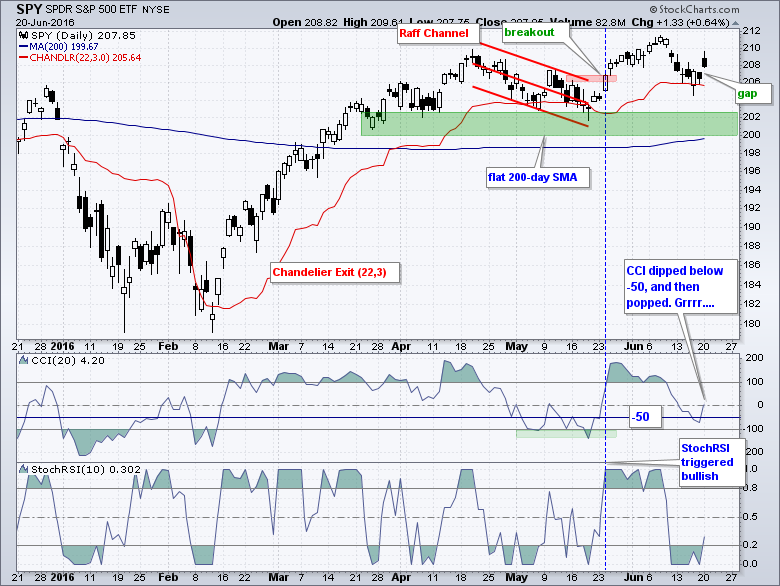 I was looking at some other stop-loss techniques and added the Chandelier Exit to the chart (red line). This line is three ATR values below the 22-day high and it acts as a trailing stop. This stop would have triggered on an intraday basis, but not on a closing basis. It is not necessarily better than my CCI below -50 stop, but it is something chartists can consider when looking for a trailing stop. You can read more the Chandelier Exit in our ChartSchool.
Surge and Zigzag Advance
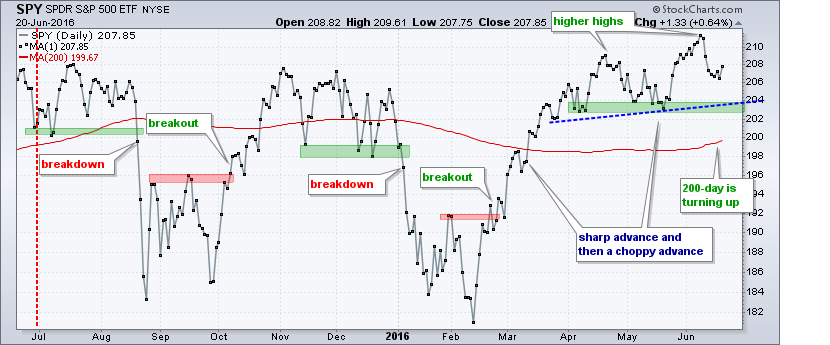
Turning back to the bigger trend, SPY surged from mid February to late March and then began a choppier zigzag advance in April. The bigger trend is still up because SPY forged higher highs and higher lows the last two months. Momentum is less than it was in March, but there is clearly more upside momentum than downside momentum. This is all that really matters. The trend does not turn until there is actual downside momentum and significant selling pressure. Thus, even though last week's decline extended further than though, it is still viewed as an opportunity because the bigger uptrend is still in play. I will maintain this view until the weight of the evidence turns bearish (details below).
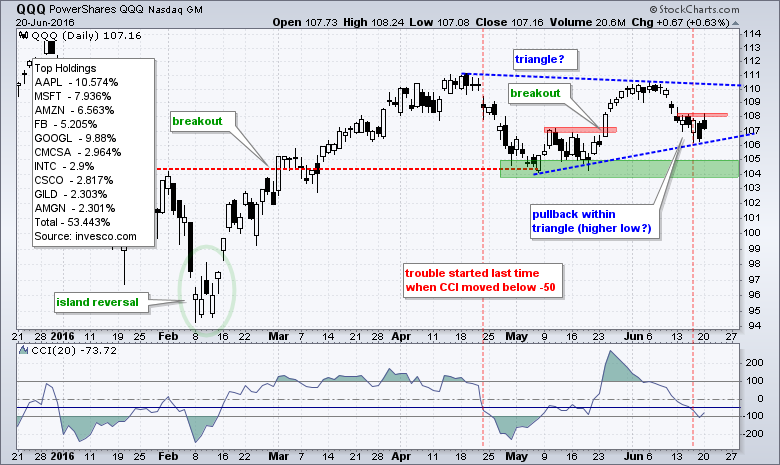
QQQ firmed in early May, gapped up on 20-May and broke out with a gap-surge on 24-May. Again, I did not expect the pullback to dip below 107, but the market is always ready to ruin expectations. In any case, QQQ is trying to firm above the May lows and a triangle could be taking shape. This is a continuation pattern and the prior move was up (mid February to mid April). Chartists can watch 108.5 for a short-term breakout within the triangle and 111 for a triangle breakout that would signal a continuation of the February-March surge.
Small-caps Continue to Lead
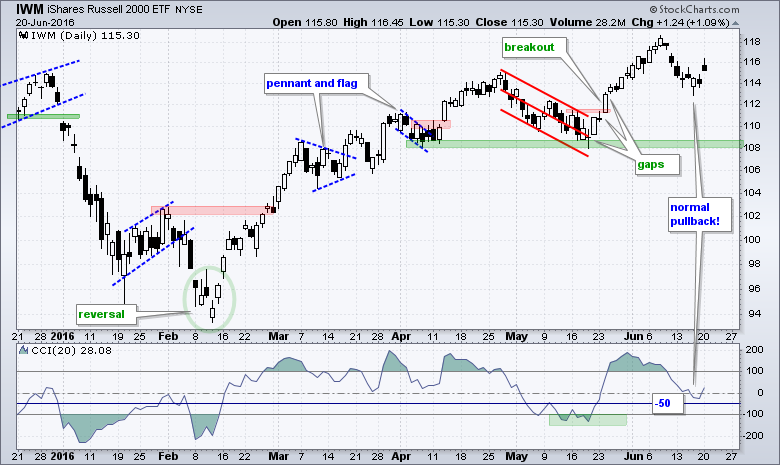
IWM was the only one of the big three that got my memo on using CCI as part of an exit strategy. The ETF led the big three with an 8+ percent surge above 118 and then corrected with a pullback to the 114 area. Notice that CCI held above the -50 level and IWM bounced with a gap on Monday.
Brexit, the FTSE and the Pound
Even though stocks closed near their low of the day on Monday, the gaps held and the bigger trends are up. I would not be surprised if volatility and uncertainty continue the rest of the week so short-term trading could be quite the challenge. The Brexit vote is Thursday and the London is seven hours ahead of New York. Therefore, we can expect big moves on Thursday afternoon because exit polls in the UK will most likely be released before the close of trading in the US. Never mind the polls and the pundits though, listen to the bookies and the real money! Bloomberg reports: The Bookies Say it's Almost all Over as Gamblers see Brexit Rejected.
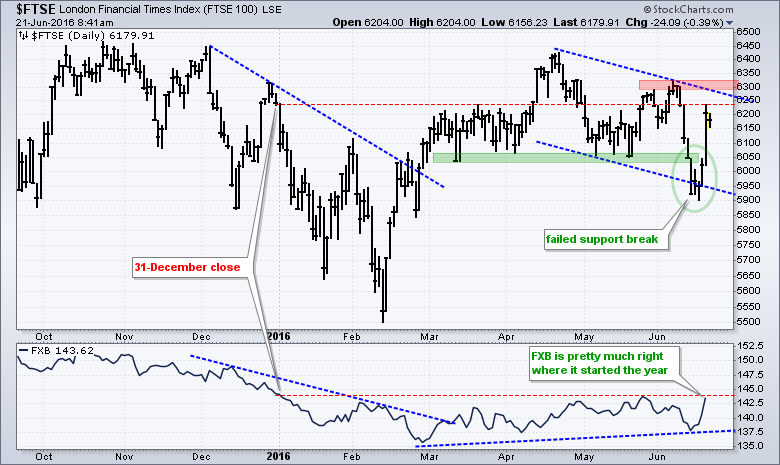 The chart above shows just how bad it has been for the FTSE Index ($FTSE) and British Pound Trust (FXB) this year. I say that with sarcasm because both are pretty much unchanged for the year. $FTSE surged with the rest of the world from mid February to mid April and then corrected over the last two months. Yes, I view this as a correction. The support break around 6050 did not hold and the index is poised to challenge resistance in the 6300 area, a break of which would be quite bullish.
Industrials Sector Remains Strong
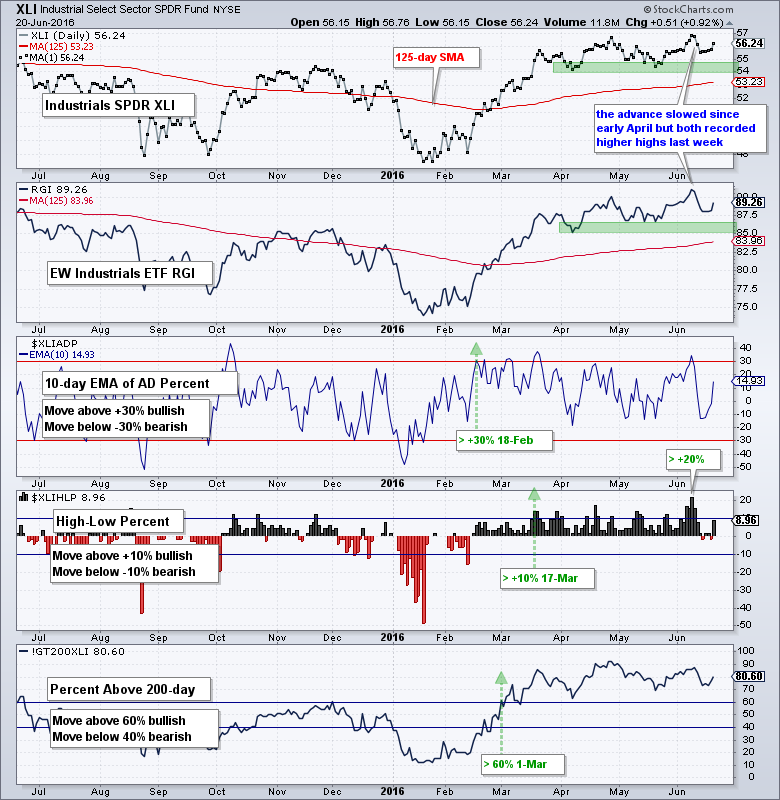
Before showing the sector table, let's review a chart with the key indicators. The chart below shows the Industrials SPDR, the EW Industrials ETF, the 10-day EMA for AD Percent, Industrials HiLo% and XLI %Above 200-day EMA. The chart also shows the bullish and bearish thresholds for each. I set these key levels and try to make this exercise as objective as possible. The industrial ETFs and breadth indicators took a hit last week, but none of them even came close to exceeding their bearish thresholds. The weight of the evidence has been bullish for this sector since March 1st and remains bullish. I will review all sector charts in today's webinar.
Sector Table Supports Broad Market Uptrend
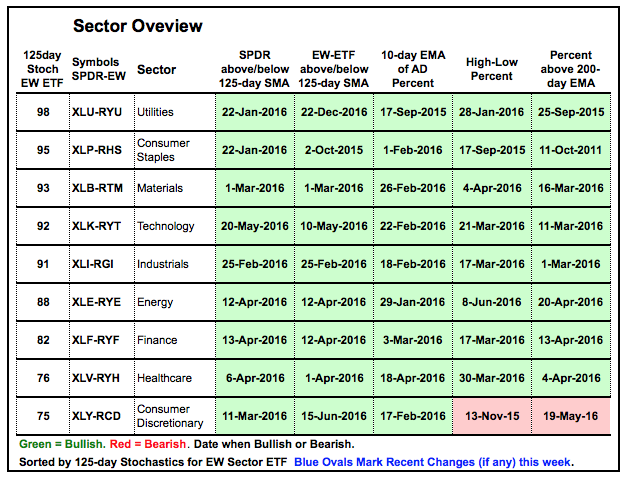
I like to use a weight of the evidence approach when analyzing the broader market. This is done with a sector table and an index table featuring trend and breadth indicators. The sector table below shows the bullish indicators in green and the bearish indicators in red, along with the date these indicators became bullish or bearish. Consumer discretionary is the only sector with two bearish breadth indicators. This means 22 of 24 breadth indicators are bullish still and this is bullish for the broader market. I will not think bear market until half of these breadth indicators turn red.
Index Table Remains Firmly Bullish
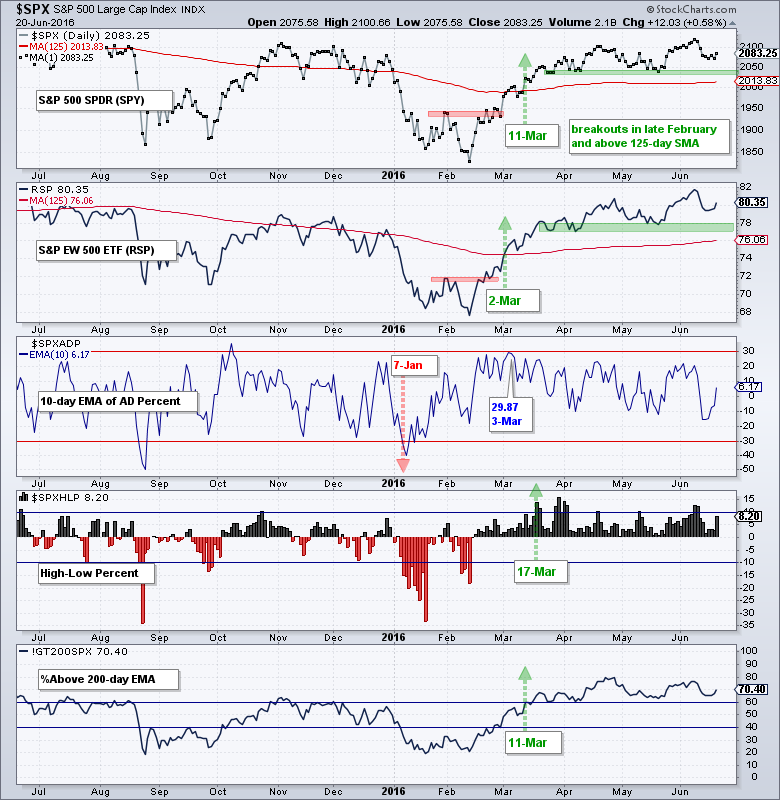
Only one indicator is bearish on the index table: the 10-day EMA of AD Percent for the S&P 500. The surge in early March reached 29.87 and fell .13 short of a bullish signal, which requires a move above +30%. This is why I have other breadth indicators and look at the weight of the evidence. The other three indicators triggered bullish signals and the vast majority of indicators on this table are in bull mode. Who am I to argue.
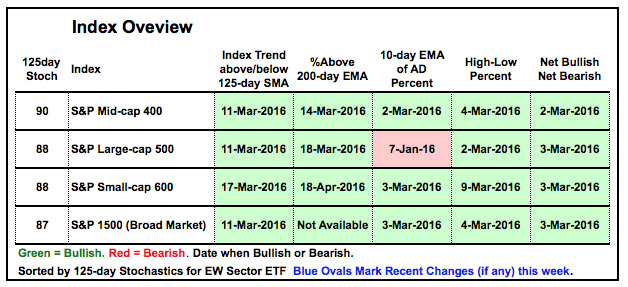 The chart below shows the S&P 500 SPDR, the EW S&P 500 ETF and the three breadth indicators. I see no reason to be medium or long term bearish when new highs are outpacing new lows, 70% of stocks are above their 200-day EMAs and both ETFs are above their April-May lows.
Scan Code for Stocks in Outperforming Sectors
[type = stock]
and [country is us]
and [SMA(50,volume) > 1,000,000] // more than a million shares a day average
and [SMA(50,close) > 10] // $10 or higher
and [PctChange(117,close) > 5.63] // Year to date change in RSPand [Min(20,CCI(10)) < -100] // looking for short-term oversold
and [Stoch RSI(10) x .50] // looking for momentum popand [[group is ConsumerStaplesSector] // leading sector
or [group is EnergySector] // leading sector
or [group is IndustrialsSector] // leading sector
or [group is MaterialsSector]] // leading sector
******************************************************
Measuring Risk On-Risk Off - Using charts to quantify stock, economic and credit risk.
PPO Trading Strategy - How to use 3 PPOs to develop a trend-reversion trading strategy.
Long-term Trend Indicators - Using the PPO, EMA Slope and CCI to determine the trend.
ETF Master ChartPack - 300+ ETFs organized in a Master ChartList and in individual groups.
Follow me on Twitter @arthurhill - Keep up with my 140 character commentaries.
****************************************
Thanks for tuning in and have a good day!
--Arthur Hill CMT
Plan your Trade and Trade your Plan
*****************************************


