SystemTrader // Review of the Golden Cross Tests // Testing Short-term Moving Averages // A Basic 10-50 SMA Cross // Testing the Classic 13-34 EMA Cross // Does a Trend Filter Improve Results? // Final Thoughts //// ........
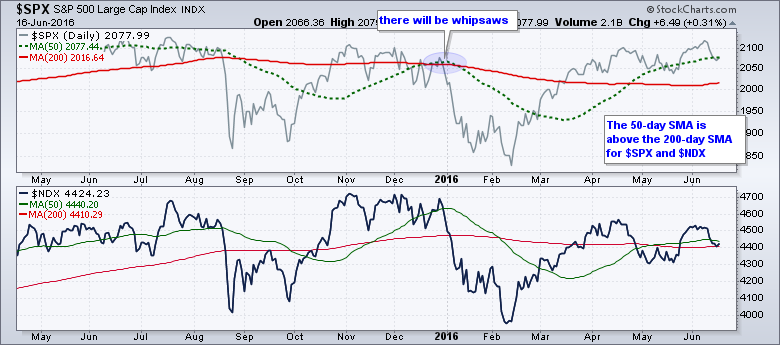
Last week I tested the golden cross for five major stock indexes and optimized these two moving averages to see what works and what doesn't. The golden cross is when the 50-day SMA crosses above the 200-day SMA. I tested this trading strategy from January 1990 until May 2016 and learned four things. First, I found that a long-only golden-cross trading system worked pretty well for the S&P 500 and Nasdaq 100, but did not work well for the Dow Industrials, Russell 2000 and S&P 500 Equal-Weight Index.
Second, I learned that adding short positions reduced returns and increased drawdowns. Third, the type of movaa did not make a big difference (SMAs vs EMAs). Finally, an optimization process showed a big difference between the S&P 500 (large-caps) and the Russell 2000 (small-caps). The S&P 500 worked better with longer moving averages (~35 days for the fast SMA and ~260 days for the slow SMA). The Russell 2000 worked better with shorter moving averages (10-15 days for the fast SMA and 70-80 days for the slow SMA).
Testing Short-term Moving Averages
This week I will turn to shorter moving average pairs. I will first test the 10-day and 50-day moving averages, and then the 13-day and 34-day exponential moving average. I will then add a trend filter to see if trading in the direction of the trend improves returns.
Two programming notes: First, definitions for the terms used can be found in the introduction article (here). Second, I chose test indexes because they are well known, complementary and have liquid ETF equivalents: S&P 500 SPDR (SPY), the EW S&P 500 ETF (RSP), the Dow Diamonds (DIA), the Nasdaq 100 ETF (QQQ) and the Russell 2000 iShares (IWM).
The 10-50 SMA Cross
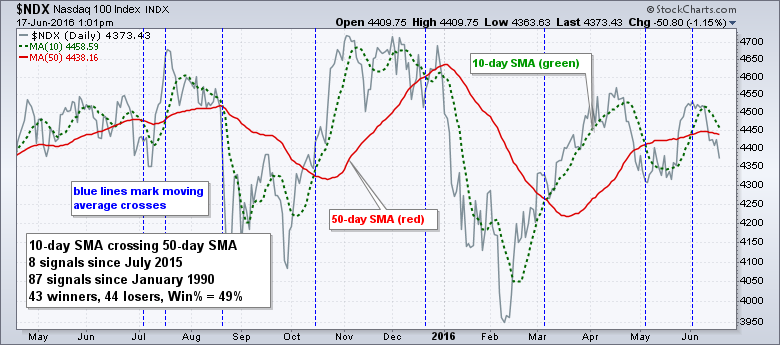
First up we have the 10-50 trading system. The system is long when the 10-day SMA crosses above the 50-day SMA and out when the 10-day SMA crosses below the 50-day SMA.
 Before looking at the table, note that the buy-and-hold column marks the benchmark return and this is the Compound Annual Return (CAR) for holding the index. The Risk-adjusted Return (RAR) of a trading system must beat buy-and-hold to make it worth a second look. Some chartists use CAR and some use RAR. The Risk-adjusted Return is the Compound Annual Return divided by the exposure. For the S&P 500, the CAR was 4.06, the exposure was 64.41% and the RAR was 6.31 (4.06/.6441 = 6.3%).
The table below shows long-only results and only two indexes beat buy-and-hold: the Russell 2000 and the S&P 500 EW Index (green ovals). This tells us that one would have been better off buying and holding the S&P 500, Dow Industrials and Nasdaq 100 over this periods. Better returns with a lot less hassle. 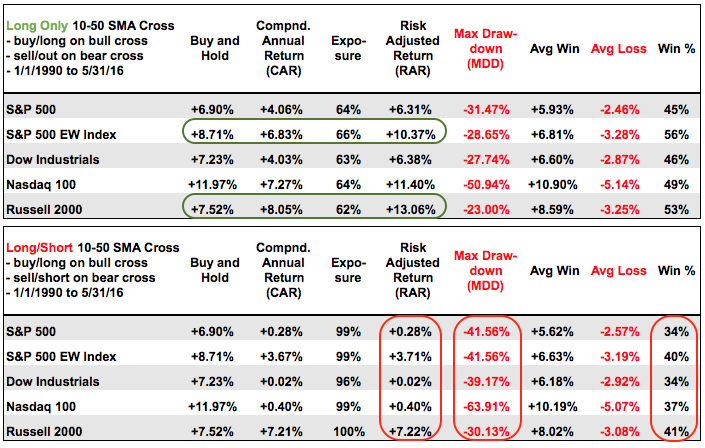
The second table shows the results when short positions were added. The Risk-adjusted Returns were ALL lower, the Maximum Drawdown (MDD) increased and the Win Percent fell well below 50% (red ovals).
Bottom Line: Short positions do not add any value for this moving average crossover system. This short-term moving average system worked better with small and mid cap indexes than large-cap indexes.
Testing the 13-34 EMA Cross
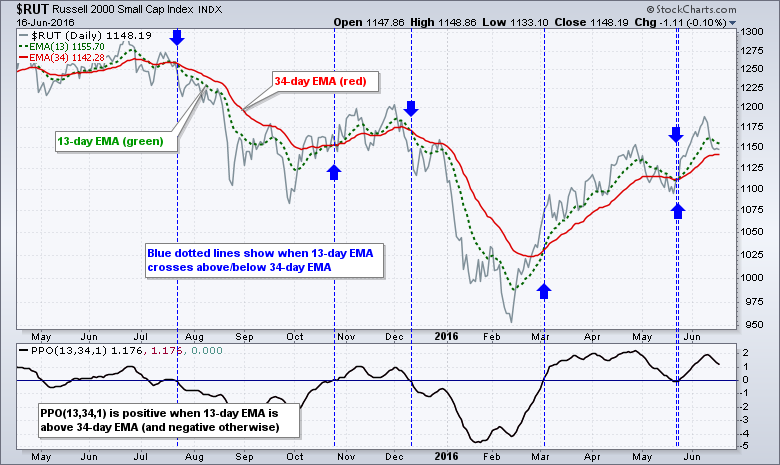
This next test will change to exponential moving averages and use two popular Fibonacci numbers: 13 and 34. The system is long when the 13-day EMA crosses above the 34-day EMA and out when the 13-day crosses below the 34-day. I am not testing with short positions because these do not add value.
The results are fairly similar to those seen with the 10-50 SMA system. Of note, the 13-34 EMA system did not outperform the 10-50 SMA system for the S&P 500, S&P 500 EW Index and Dow Industrials. It did, however, outperform for the Nasdaq 100 and Russell 2000 (red and green ovals). Also notice that the Win Percent ranged from 39% to 48%. This means more than half the trades were losers. The system is net positive because the average gain was greater than the average loss.
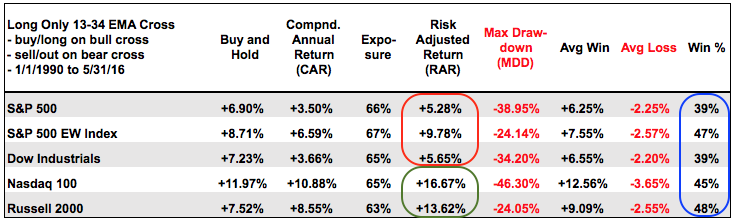
Bottom Line: The 13-34 EMA system performed quite well for the Russell 2000 and Nasdaq 100 as Risk-adjusted Returns exceeded 10% per annum. The Nasdaq 100 and Russell 2000 have higher risk profiles than the S&P 500 and this suggests that the 13-34 system favors more volatile stocks.
Does a Trend Filter Improve Results?
Perhaps we can improve the short-term moving average crossover by adding a trend filter. For example, we could only take long positions when the 5-day SMA is above the 200-day SMA. This would suggest that the long-term trend is up and short-term bullish signals would be in harmony with this uptrend.
The chart below shows the Nasdaq 100 with two moving averages in the main window. The trend filter is bullish (green) when the 5-day SMA is above the 200-day SMA and bearish (red) when the 5-day SMA is below the 200-day SMA.
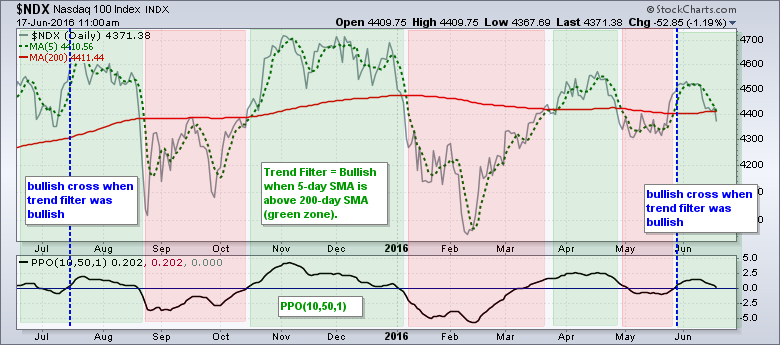
The PPO(10,50,1) is used to identify the moving average crossovers (10-day EMA and 50-day EMA). The PPO turns positive when the 10-day EMA crosses above the 50-day EMA. I opted for exponential moving averages because they seem to be slightly better for short-term trading systems (more on that in a future article). Notice that there were only two signals over the past year. Bullish signals did not trigger in October or March because the trend filter was not bullish at the time of the signals.
The table below shows the results with the added trend filter. It did not make much difference for the S&P 500, S&P 500 EW Index, Dow Industrials or Russell 2000. The Maximum Drawdowns remained high and the Win Percents were still below 50% (red ovals). In fact, the Nasdaq 100 was the only index with higher Risk-adjusted Returns (19.5% with a trend filter versus 12.68% without a trend filter).
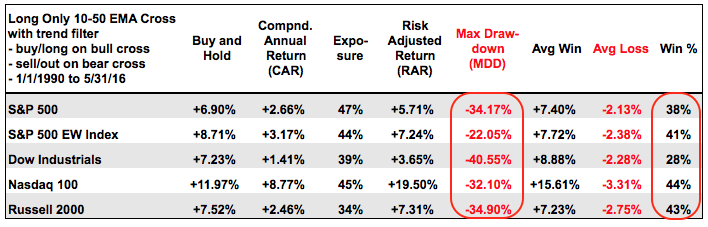
Bottom Line: Then trend filter does not always help. These results were a bit surprising to me because I expected a trend filter to improve returns. I will be putting the PPO Strategy to the test soon.
Final Thoughts
Short-term moving average systems generate lots of trades with more losers than winners. Even though these trading systems did not always beat buy-and-hold, they had a positive expectancy because the profits from the winners exceeded the profits from the losers. Keep in mind that these results are based on every trade from January 1991 to May 2016. In other words, chartists would have to take every trade to expect similar results. We never know which trade will turn out to be the big winner and it is usually the outsized winners that make a trading system look good.
These trading strategies were tested using Amibroker with the help of Cesar Alvarez of AlvarezQuantTrading.com. Cesar wrote High Probability ETF Trading, Short-term Trading Strategies that work. For more information about his testing and consulting services, click here.
******************************************************
Measuring Risk On-Risk Off - Using charts to quantify stock, economic and credit risk.
PPO Trading Strategy - How to use 3 PPOs to develop a trend-reversion trading strategy.
Long-term Trend Indicators - Using the PPO, EMA Slope and CCI to determine the trend.
ETF Master ChartPack - 300+ ETFs organized in a Master ChartList and in individual groups.
Follow me on Twitter @arthurhill - Keep up with my 140 character commentaries.
****************************************
Thanks for tuning in and have a good day!
--Arthur Hill CMT
Plan your Trade and Trade your Plan
*****************************************


