All Time Highs Set the Tone // Four Indecisive Weeks for the S&P 500 EW Index // Bandwidth Hits Lowest Level in over 10 Years // S&P 500 Clears Upper Band // Russell 2000 Remains on Bull Signal //// .....
All Time Highs Set the Tone
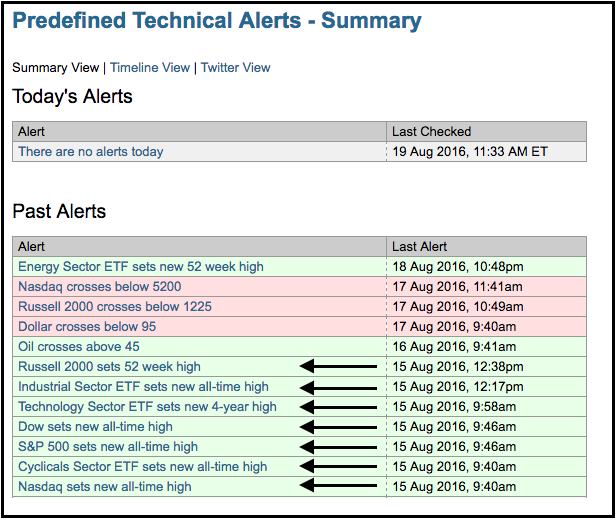
The major stock indexes have traded flat the last five weeks with the S&P 500 locked in a 50 point range since July 15th. With a current price near 2280, this represents a 2.3% range. The bears can point out that buying pressure is waning and upside momentum is slowing. The bulls can point to 52-week highs on Monday and limited selling pressure. I am still erring on the bullish side because of broad market strength and Bollinger Band breakouts shown further down. The image below comes from the predefined technical alerts page and it shows several new all time highs and new highs earlier this week. Even though the market seems ripe for a correction, it is hard to be negative on stocks when three key indexes (Russell 2000, Nasdaq, S&P 500) and three important sectors (technology, industrials and cyclicals) hit fresh 52-week highs.
Four Indecisive Weeks for the S&P 500 EW Index
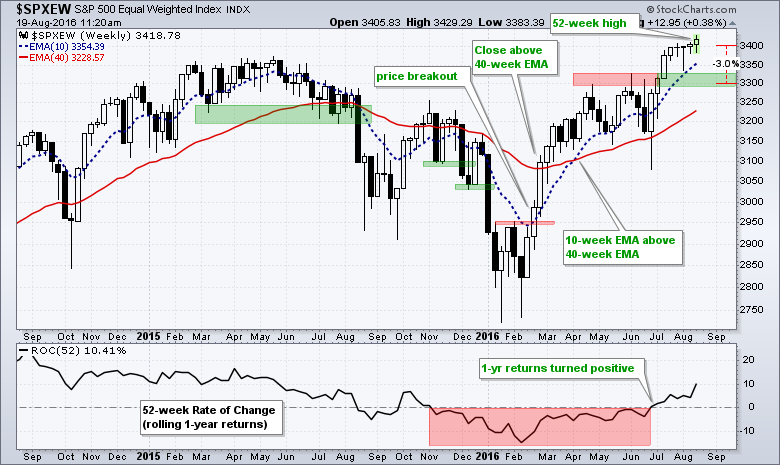
The chart below shows the S&P 500 Equal-Weight Index ($SPXEW). The long-term trend indicators remain bullish and the index hit a fresh 52-week high just this week. There is nothing much open to interpretation on the long-term. Short-term, the index is stalling in the 3400 area with indecisive candlesticks the last four weeks. These candlesticks show indecision because the weekly open is near the weekly close each week and index remains stuck near 3400. At this point, I would mark first support in the 3300 area (broken resistance turns support). A decline back to 3300 would be around 3% and be relatively minor.
Bandwidth Hits Lowest Level in over 10 Years
Chartists can quantify the recent trading range using Bollinger Bands and the BandWidth indicator. The chart below shows the S&P 500 with the BandWidth indicator over the last five years. BandWidth measures the percentage difference between the upper and lower Bollinger Band. The bands narrow and BandWidth falls when volatility contracts. The bands widen and BandWidth rises when volatility expands. John Bollinger theorized that a volatility contraction is often followed by a volatility expansion. Bollinger Bands, however, do not provide any directional clues.
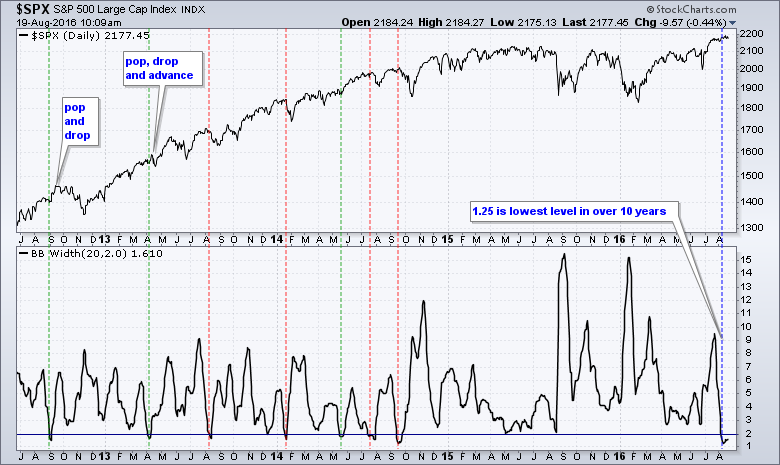
Of the seven prior times when BandWidth dipped below 2, the S&P 500 advanced three times and declined four times. Note that this is not a very scientific study and the moves are quite short-term. In fact, as the first two signals show, trading can turn quite choppy before the index establishes a clear directional bias.
S&P 500 Clears Upper Band
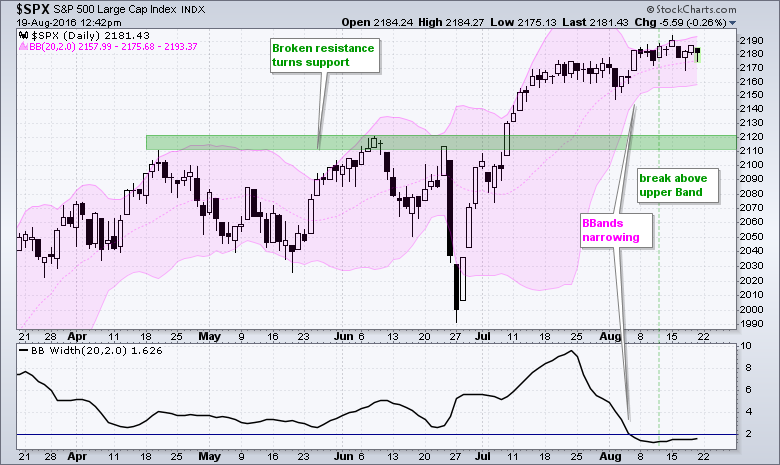
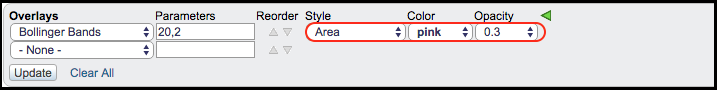
The next chart shows daily candlesticks with the Bollinger Bands in pink. This overlay (indicator) is shown shaded by setting the "Style" as Area, the "Color" as Pink and the "Opacity" at .3 (see image below chart). Once Bollinger Bands contract, the first signal triggers with a break of the upper or lower band. BandWidth dipped below 2 in early August and the S&P 500 closed above the upper band on August 11th. This is a bullish signal and it remains valid until proven otherwise. A whipsaw is certainly possible and chartists should watch the lower band for a counter signal. Even though a break below the lower band would be negative, I would not turn that bearish because the bigger trend is still up and I would expect support in the 2100-2120 area.
Russell 2000 Remains on Bull Signal
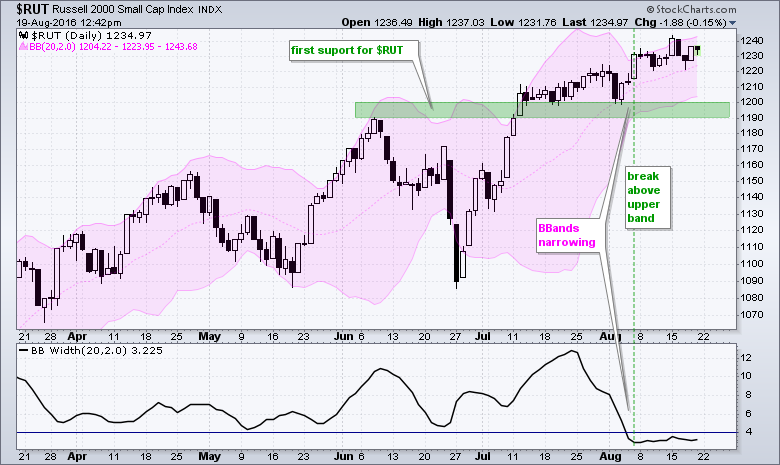
The next chart shows the Russell 2000 with Bollinger Bands and BandWidth. Notice that BandWidth is a little higher on average for the Russell 2000 than the S&P 500. This is because the Russell 2000 is a little more volatile. BandWidth for the Russell 2000 dipped below 4 in early August and this was the lowest level since June 2015. The index did not waste any time and promptly broke above the upper band the very next day. This is the most recent signal and it remains bullish until proven otherwise.
******************************************************
Measuring Risk On-Risk Off - Using charts to quantify stock, economic and credit risk.
PPO Trading Strategy - How to use 3 PPOs to develop a trend-reversion trading strategy.
Long-term Trend Indicators - Using the PPO, EMA Slope and CCI to determine the trend.
ETF Master ChartPack - 300+ ETFs organized in a Master ChartList and in individual groups.
Follow me on Twitter @arthurhill - Keep up with my 140 character commentaries.
****************************************
Thanks for tuning in and have a good day!
--Arthur Hill CMT
Plan your Trade and Trade your Plan
*****************************************


