Bulls Maintain Short-term Edge // Nasdaq and Russell 2000 Outperforming // Energy Complex Weakens Across the Board // Energy-related ETFs Could be Vulnerable // Bullish Setups in HealthCare Providers and Telecoms // Regional Bank SPDR and Finance SPDR Stutter after Breakouts ///// .....
Bulls Maintain Short-term Edge
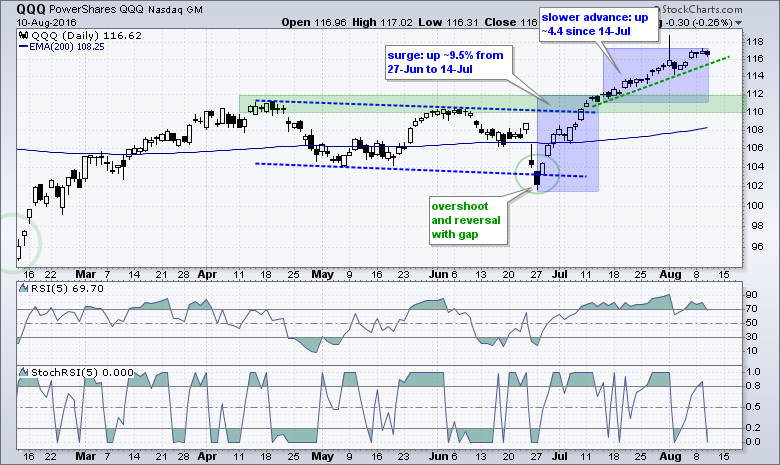
Long-term, the stock market is in bull mode, which means the bullish evidence is stronger than the bearish evidence. Short-term, there is not much happening with the major index ETFs (SPY, QQQ and IWM). All three surged from late June to early July and then embarked on a slower advance the last 4-5 weeks. "Advance" is the key word because buying pressure is still stronger than selling pressure. QQQ reversed in late June with an island reversal and broke channel resistance in early July. The advance slowed after the initial surge, but momentum is still positive and we have yet to see any kind of a short-term support break. I am using the green dotted trend line to define the five week advance and a close below 115 would break this trend line. Broken resistance marks next support in the 110-112 area.
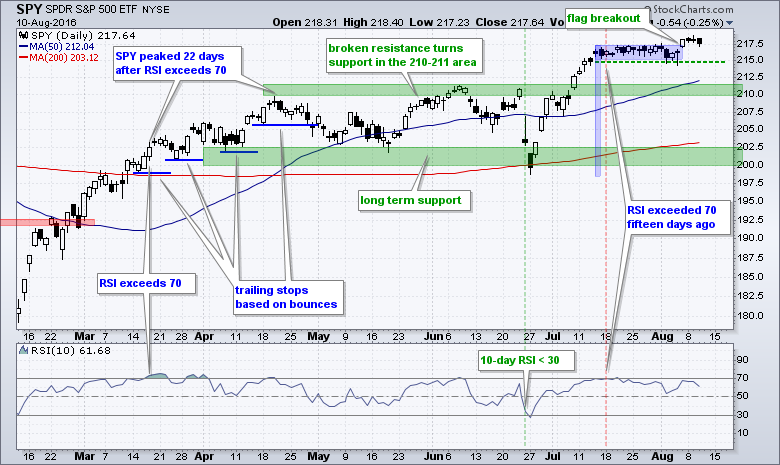
SPY broke flag resistance four days ago and this breakout is largely holding. 215 marks first support and a close below this level would negate the flag breakout. Broken resistance marks next support in the 210-211 area.
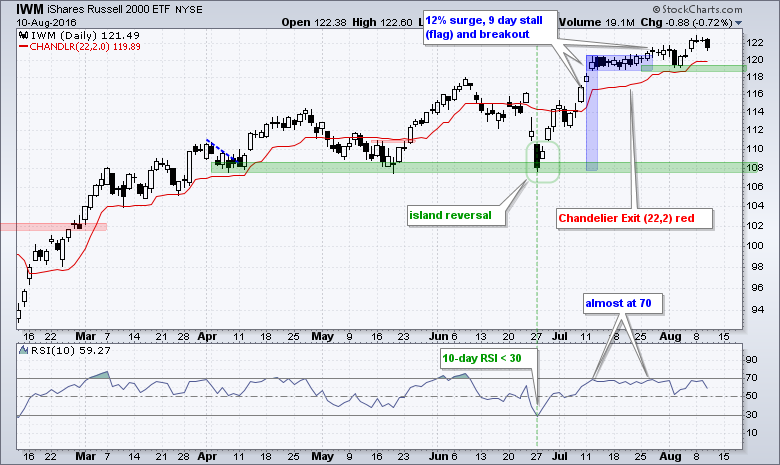
IWM broke flag resistance before SPY and shows some relative strength. The flag lows mark first support at 118.5 and the Chandelier Exit (22,2) is at 119.89 (fielder's choice). Overall, the island reversal in late June, higher high in mid July and flag breakout in late July set the bullish tone. Even though IWM has not moved much the last few weeks, the flag breakout is the latest signal and it has yet to be negated.
Nasdaq and Russell 2000 Outperforming
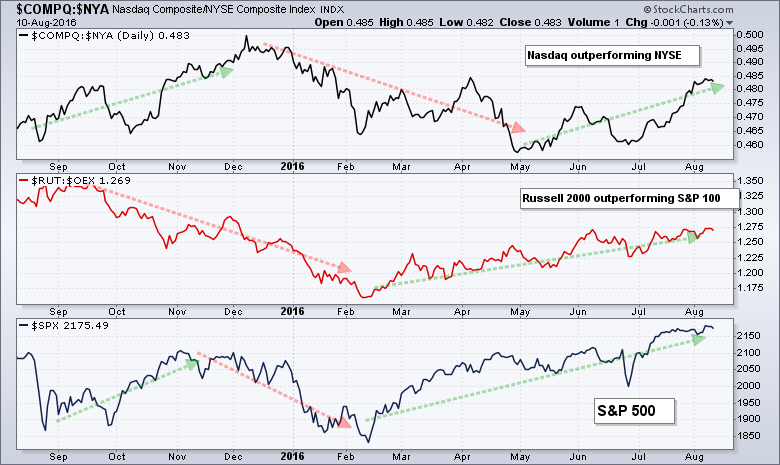
The appetite for risk appears to be strong because the Nasdaq is outperforming the NY Composite and the Russell 2000 is outperforming the S&P LargeCap 100. I like using these pairs because there is no overlap in the component stocks. In contrast, there is lots of overlap between the Nasdaq 100 and S&P 500. The Nasdaq Composite has been outperforming since early May and the Russell 2000 has been outperforming since mid February. Stocks in these to indexes have higher betas and higher risk profiles. Relative strength in these two, therefore, points to a good appetite for risk and this is net positive for stocks.
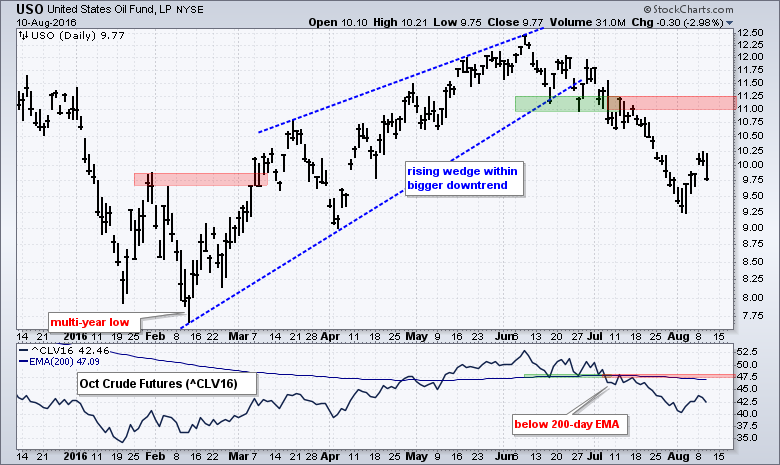
Energy Complex Weakens Across the Board
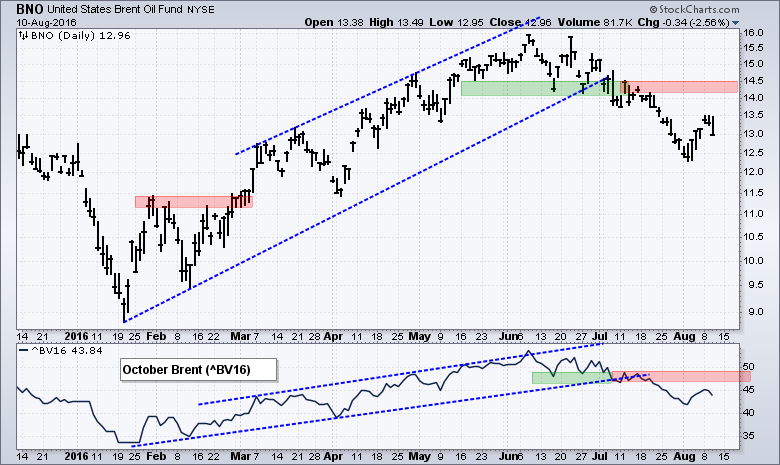
Oil reversed its uptrend with a breakdown in mid July and remains in bear mode. Overall, the USO Oil Fund (USO) hit a multi-year low in February and then formed a rising wedge with a four month advance. The ETF broke the wedge trend line and support in late June and early July. These breaks reversed the uptrend and signaled a continuation of the bigger downtrend. The indicator window shows October Crude (^CLV16) breaking its 200-day EMA. The second chart shows the US Brent Oil ETF (BNO) for reference.
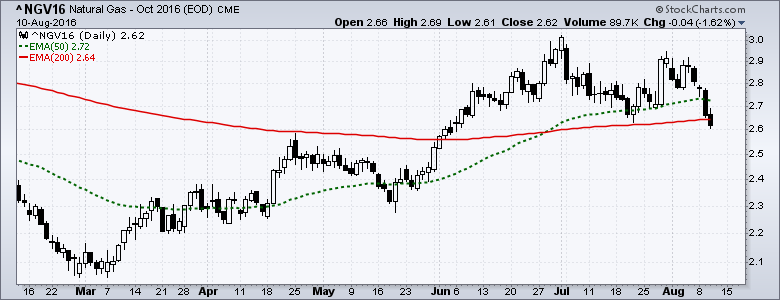
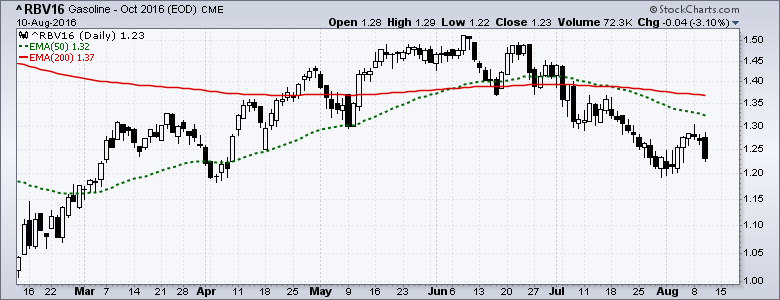
Also note that October Gasoline (^RBV16) broke down in early July and October NatGas (^NGV16) broke its 200-day EMA on Wednesday. In short, the energy complex is looking weak. The corresponding ETFs are Gasoline ETF ($GASO) and Natural Gas (UNG).
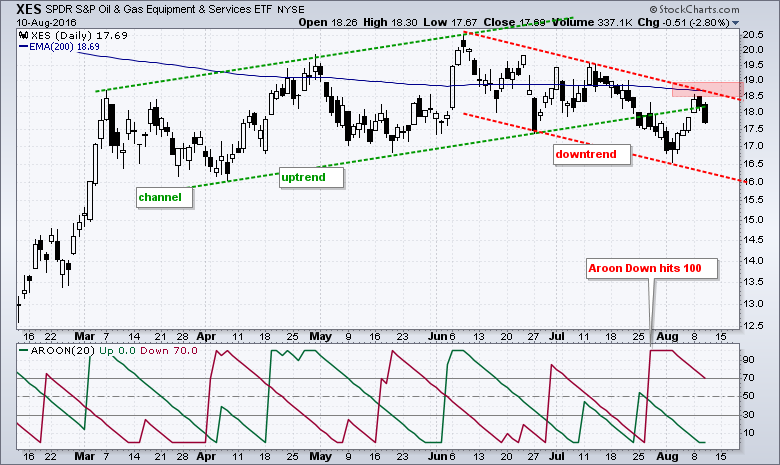
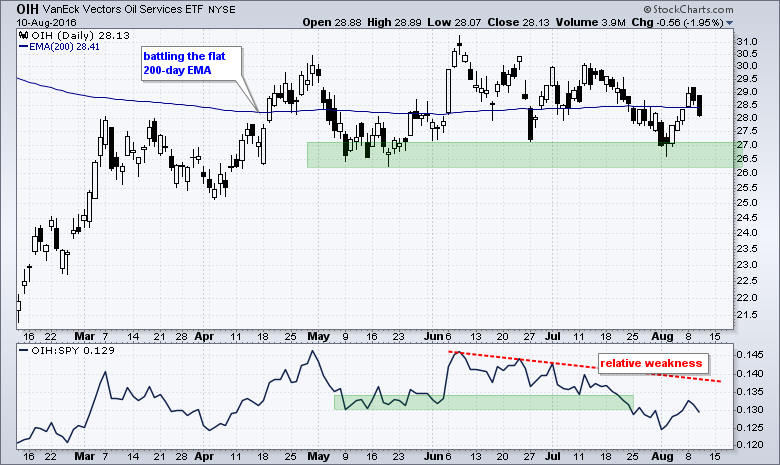
Energy-related ETFs Could be Vulnerable
The first chart shows the Oil & Gas Equip & Services SPDR (XES) breaking the lower trend line of a rising channel and moving below its 200-day EMA in July. A downward sloping channel now marks the downtrend with resistance set in the 18.5-19 area.
The Oil Service ETF (OIH) has been battling the flat 200-day EMA since late April. The chart shows clear support in the 26.5 area and a break below this zone would be bearish. The indicator window shows the OIH:SPY ratio falling, which means OIH is underperforming SPY.
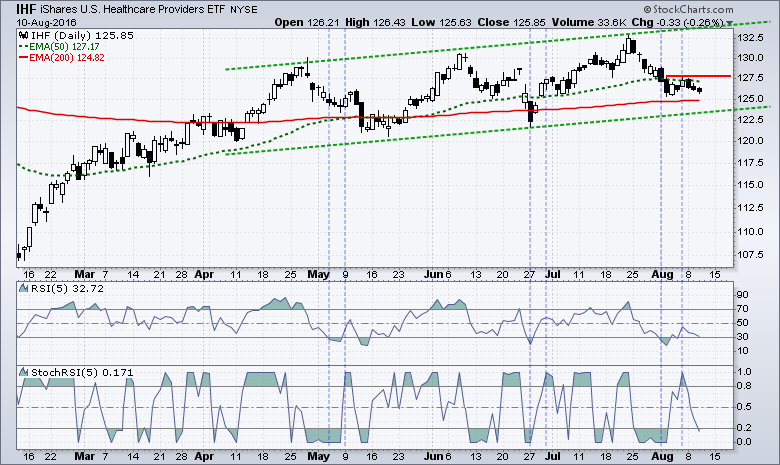
Bullish Setups in HealthCare Providers and Telecoms
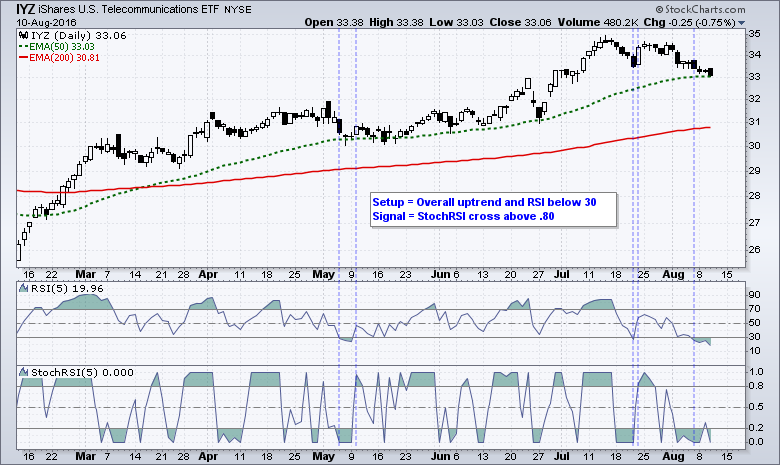
There is a bullish setup in the HealthCare Providers ETF (IHF) using the RSI-StochRSI strategy. This is a short-term mean-reversion strategy designed to identify pullbacks within an uptrend. IHF is clearly trending higher with higher highs and higher lows the last four months. The ETF is above the 200-day and the 50-day is above the 200-day. RSI(5) moved below 30 to become oversold on August 1st and StochRSI surged above .80 for a bullish signal on Friday. On the price chart, the stock needs to exceed 128 for a price breakout and chartists can mark support at 125. The Telecom iShares (IYZ) also sports a bullish setup. You can read more about the RSI strategy here.
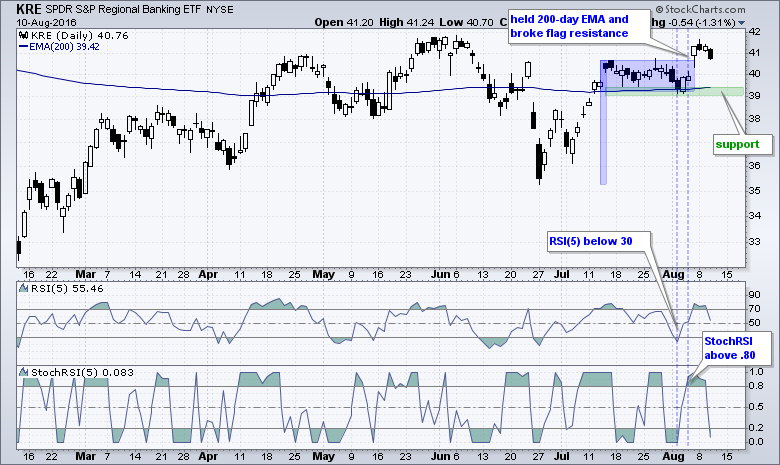
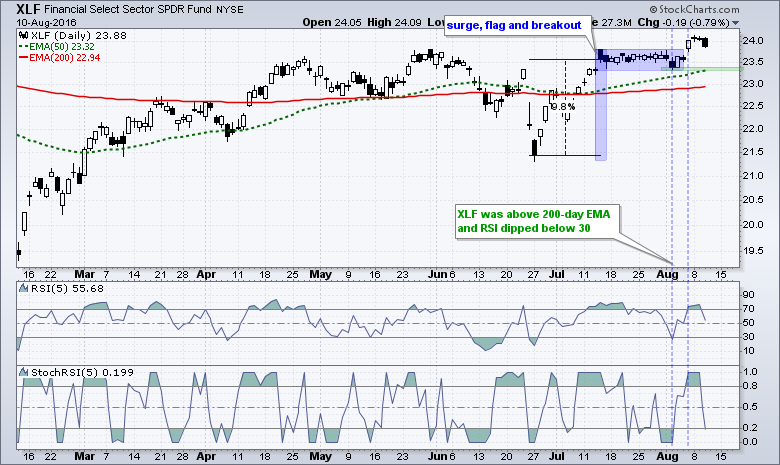
Regional Bank SPDR and Finance SPDR Stutter after Breakouts
My eyes are still on the Finance SPDR (XLF) and the Regional Bank SPDR (KRE). In particular, I am watching to see if the flag lows and 200-day EMAs hold. The flag lows mark support based on actual buying pressure. The 200-day EMAs are a long-term reference point we can use to identify the trend. KRE and XLF are bullish right now and above the 200-day EMAs. A break below flag support would be the first negative. Breaks below the 200-day EMAs to be the second negative. Finance is the second biggest sector in the S&P 500 and the biggest sector in the Russell 2000.
******************************************************
Measuring Risk On-Risk Off - Using charts to quantify stock, economic and credit risk.
PPO Trading Strategy - How to use 3 PPOs to develop a trend-reversion trading strategy.
Long-term Trend Indicators - Using the PPO, EMA Slope and CCI to determine the trend.
ETF Master ChartPack - 300+ ETFs organized in a Master ChartList and in individual groups.
Follow me on Twitter @arthurhill - Keep up with my 140 character commentaries.
****************************************
Thanks for tuning in and have a good day!
--Arthur Hill CMT
Plan your Trade and Trade your Plan
*****************************************
