Large-techs and Small-caps Outperforming // SPY and the Stealth Correction // Golden Crosses remain for All Nine Sector SPDRs // XLI, XLF and XLY Trigger Bullish Short-term Signals // Utilities and Staples Continue to Lag // PPO Strategy versus RSI-StochRSI and Moving Averages // Webinar Preview ///// .....
Large-techs and Small-caps Outperforming
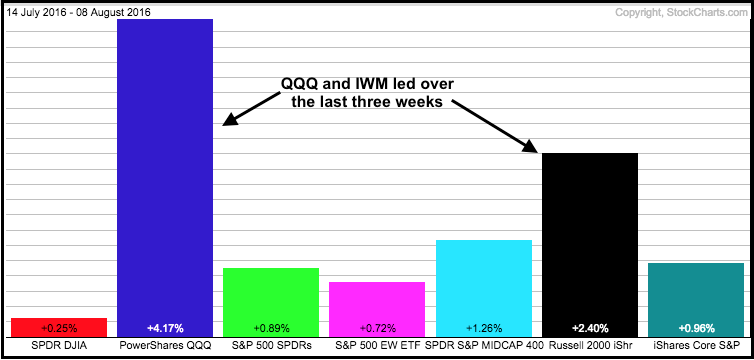
Once again, there is no real change in the big three (aka the broad market trend). SPY, QQQ and IWM surged from June 22nd to July 14th with 8-12% moves. SPY and IWM then moved into trading ranges as QQQ continued its advance. QQQ remains the strongest of the three since July 14th because it has the largest post-surge gain (QQQ +4.17%, SPY +.89%, IWM +2.4%). The PerfChart below shows the post-surge gains from July 14th to August 8th. Also note that small-caps are outperforming large-caps over this period.
SPY and the Stealth Correction
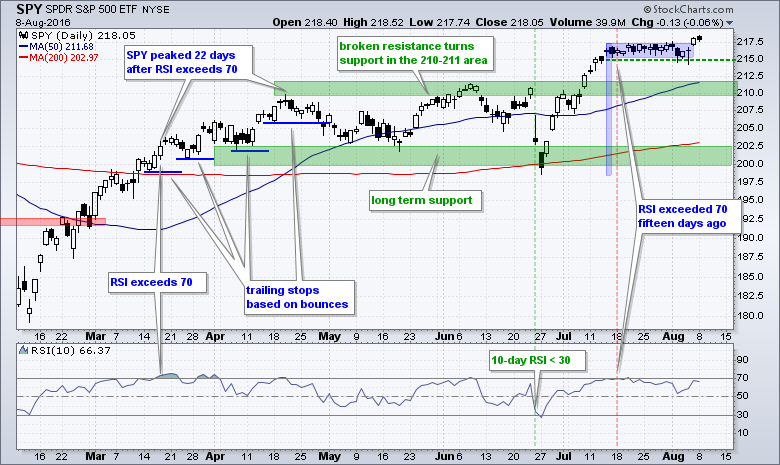
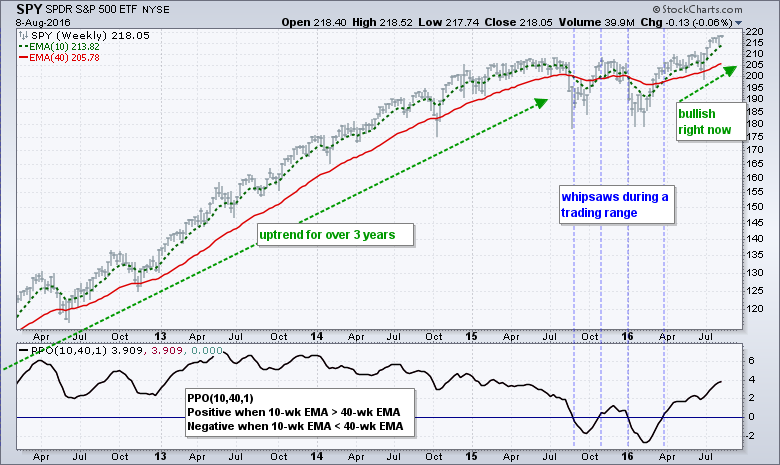
SPY and QQQ were "overbought" three weeks ago when RSI moved above 70. However, as we have seen time and time again, overbought is not actually bearish and overbought conditions do not always foreshadow a pullback. On the SPY chart below, note that RSI moved above 70 in mid March and the index peaked 22 days later. RSI moved above 70 fifteen days ago and flat trading range then formed. This sideways price action amounts to a stealth correction and the upside breakout signals a continuation of the prior advance. As with XLF, the pattern in SPY looks like a flat flag (blue shading) with first support marked at 215. A close below this level would provide the first sign of selling pressure that could lead to a pullback. I would not get too bearish on a break because the bigger trend is clearly up. Next support is set in the 210-211 area and long-term support remains in the 200-202 area.
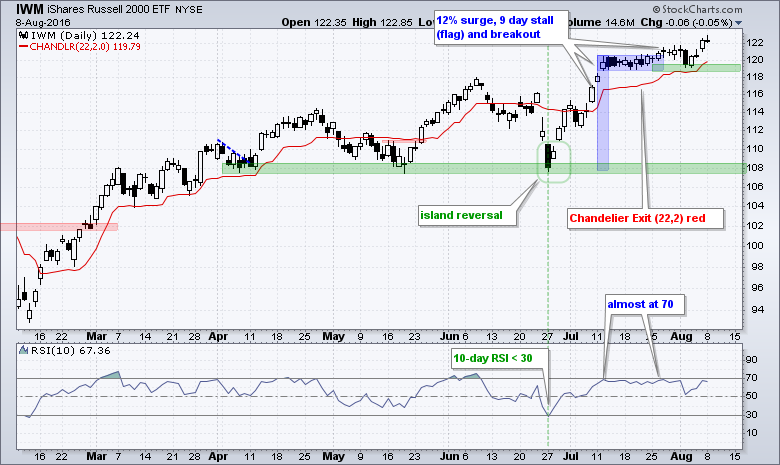
On the IWM chart below, the ETF surged around 12%, stalled for two weeks with a flat flag and broke out in late July. The breakout was challenged with the decline below 120 in early August, but IWM held support and moved above 122 on Friday-Monday. The flag lows mark first support at 118.50 and the Chandelier Exit (22,2) rose to 119.79 with Monday's high.
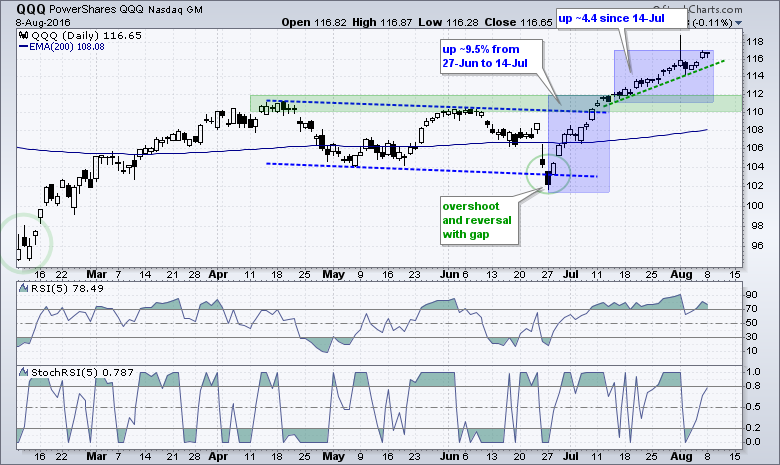
The QQQ chart below, the green trend line defines the three week advance with support marked at 115. The green zone marks support from broken resistance in the 110-112 area. A break below 115 could usher in a pullback to this area.
Golden Crosses remain for All Nine Sector SPDRs
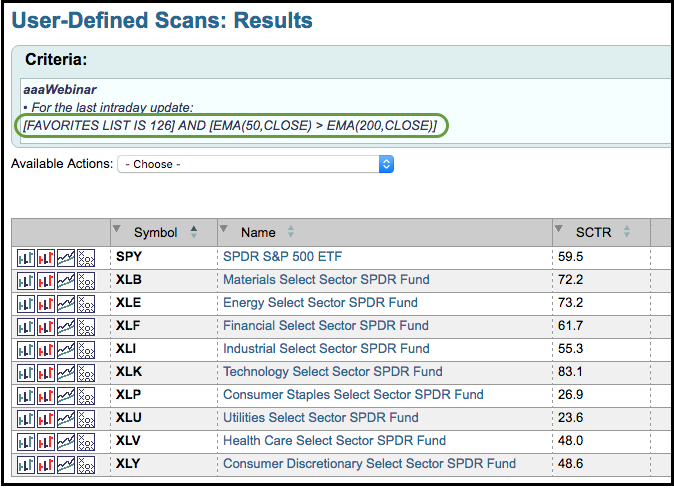
The next charts show the nine sector SPDRs with the 50-day EMA (green), the 200-day EMA (red), RSI(5) and StochRSI(5). The trend is up when the 50-day is above the 200-day and we want to look for bullish setups when the trend is up. The trend is down when the 50-day is below the 200-day and we want to be out or looking for bearish setups when the trend is down. Before looking at the current setups, note that the 50-day EMA is above the 200-day EMA for all nine sectors and this supports an uptrend in the S&P 500. I will not become concerned with a broad market downtrend until the 50-day moves below the 200-day for four of the nine sectors. Elsewhere, XLU is the only sector below its 50-day EMA. XLP is very close to its 50-day and XLE moved back a its 50-day EMA on Friday.
XLI, XLF and XLY Trigger Bullish Short-term Signals
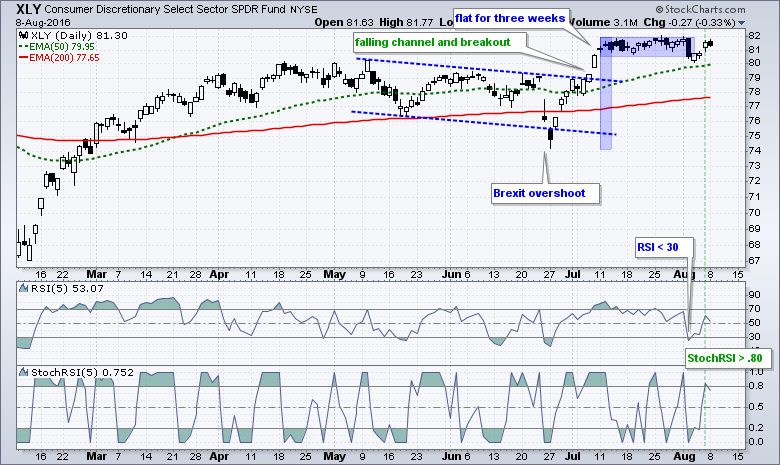
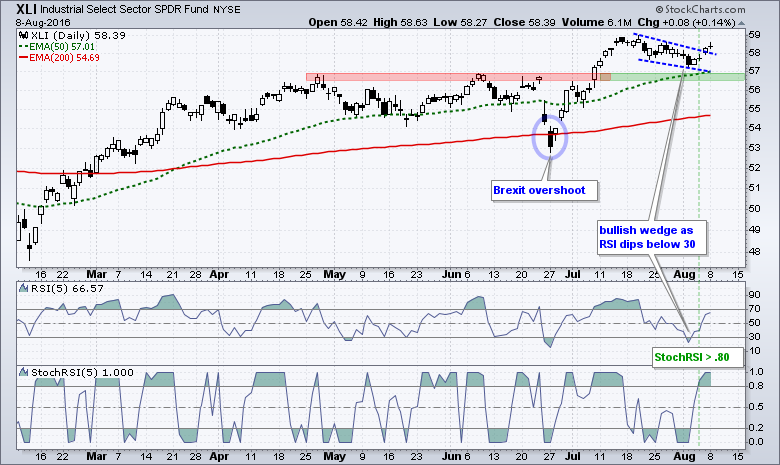
There are two possible short-term bullish signals using RSI(5) and StochRSI(5). First, a move below 30 in RSI(5) signals a short-term pullback or consolidation. Some traders buy on this move and do not wait for a small reversal. Chartists looking for a small reversal can turn to StochRSI and wait for a pop above .80. These signals are marked with green dotted lines on the following charts. Chartists need to think about an exit strategy and perhaps use the Chandelier Exit or Parabolic SAR.
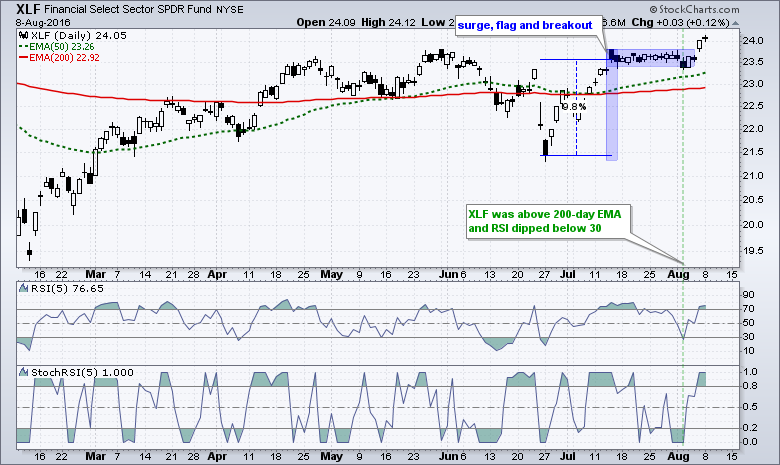
On the XLY chart below, RSI moved below 30 with what seemed line a break below flag support. This break did not last long as StochRSI surged above .80 on Friday. It is not the strongest of signals, but it is valid as long as XLY holds above 80. Also note that XLI and XLF triggered signals on Friday.
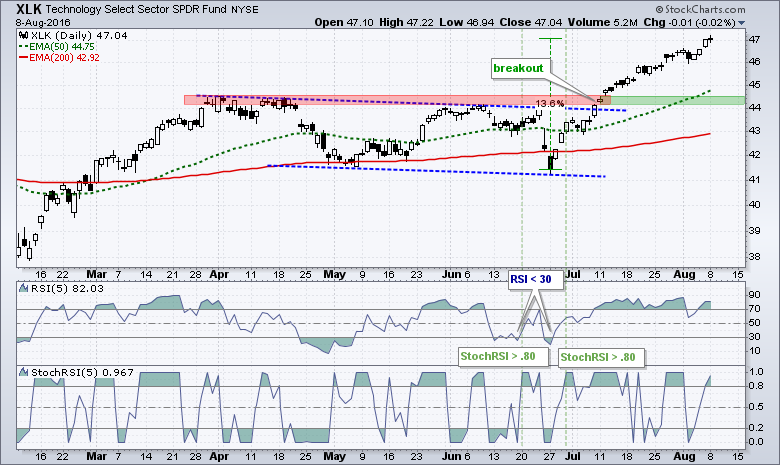
XLK led the market over the last few weeks and RSI remains well above 30. Thus, we will have to wait a while for a setup or signal here. Broken resistance turns into the first support level in the 44-44.5 area.
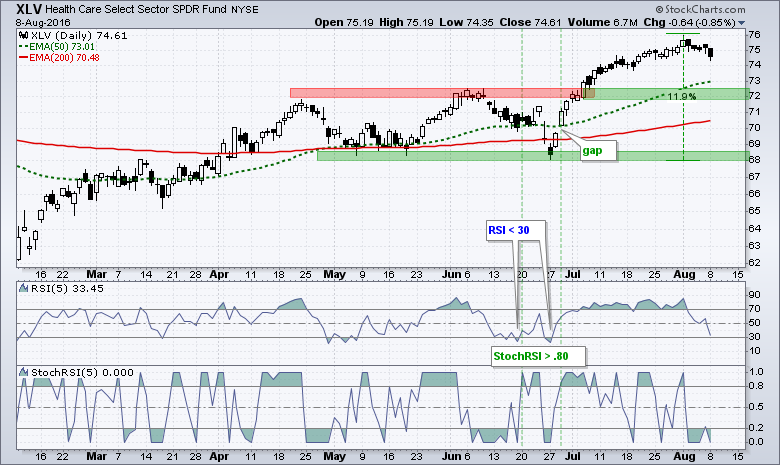
XLV is getting close to a setup as RSI fell to 33.45 on Monday. XLV fell sharply on Monday because BMY gapped sharply lower. First support for the ETF is set in the 72 area (broken resistance).
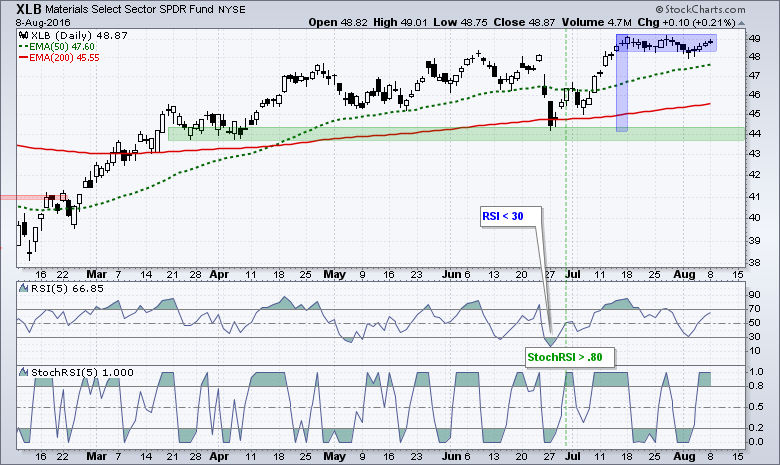
The Materials SPDR (XLB) remains stuck in a consolidation. The last signal triggered in late June and chartists can watch the August lows near 48 for the first sign of weakness.
XLE triggered a pair of bullish signals in late July and early August. The ETF also reversed off the 200-day EMA and broke out with a surge the last five days. I am not too keen on energy because I think oil resumed its long-term downtrend with a support break in July. Nevertheless, a signal is a signal and remains valid until evidence to the contrary. A close below 67 would argue for a reassessment.

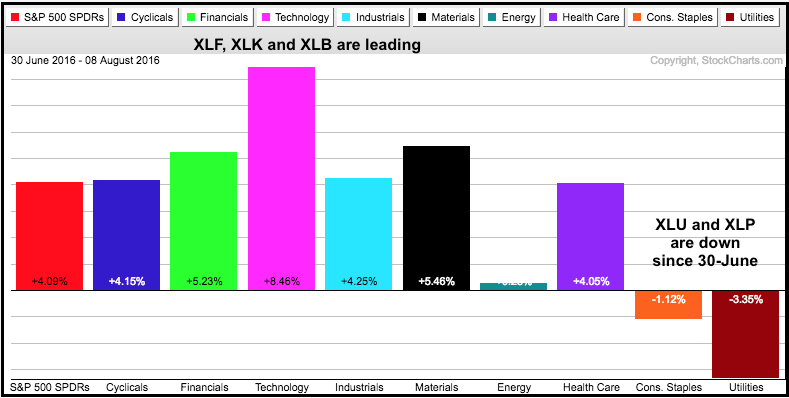
Utilities and Staples Continue to Lag
XLU and XLP are the two weakest sectors over the last five weeks (since June 30th). As the PerfChart below shows, they are the only two showing a loss for this period. This suggests that the market is more offensive oriented and this is positive overall. Also notice that XLK and XLF are leading.
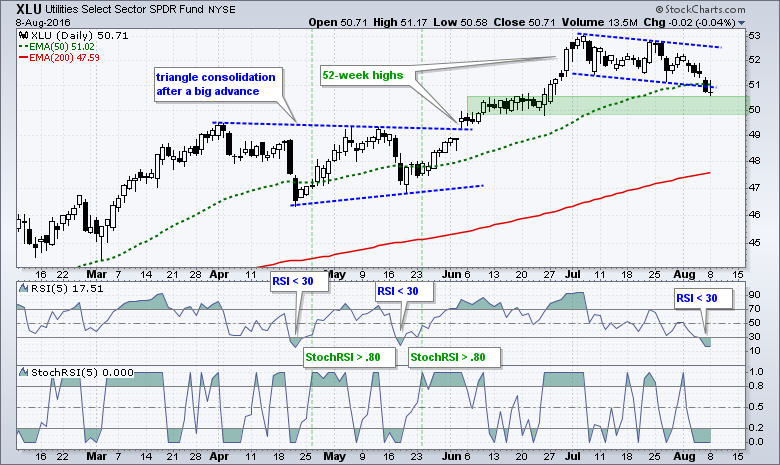
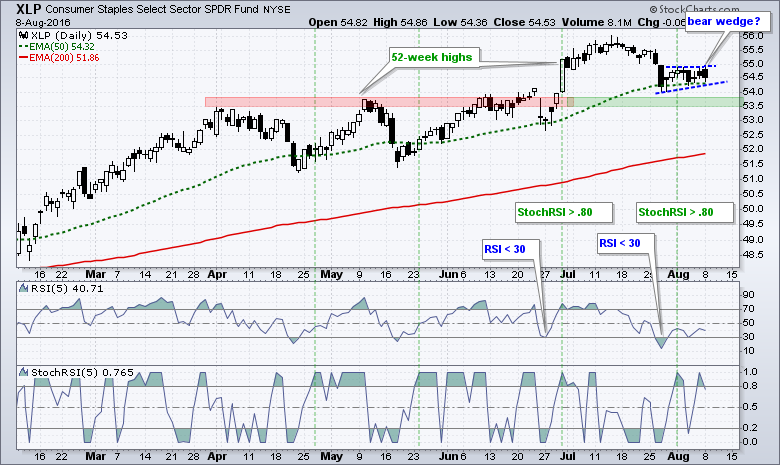
The overall trends are still up for XLU and XLP. In fact, XLP triggered a bullish signal at the beginning of August and the signal remains valid. My concern here is that a bearish wedge or pennant could be forming. A break below 54 would signal a continuation of the late July decline. XLU has a bullish setup working over the last few days as RSI moved below 30. StochRSI, however, has yet to surge and signal a short-term reversal in downward momentum.
PPO Strategy versus RSI-StochRSI and Moving Averages
I get a lot of questions asking me if I have abandoned the PPO Strategy in favor of RSI-StochRSI and weekly EMAs. The System Trader post on Saturday showed how a 10-week/40-week EMA crossover system returned 10% per year in the S&P 500 Total Return Index since 1990. This is based on long-only signals and there were just 9 signals over the last 25 years. Talk about an armchair trading strategy! Simply buy when the 10-week EMA crosses below the 40-week EMA and sell when the 10-week EMA moves below. Short positions were not considered because they reduced the Compound Annual Return and increased risk (exposure).
A couple of notes. First, the 10-week/40-week EMA crossover is a long-term trend-following strategy for the S&P 500 (and maybe the S&P 500 Equal-weight Index and Nasdaq 100). It does not work near as good with the Russell 2000 and Dow Industrials. The idea us to help define the broad market environment. This way we know when to be "IN" the stock market and when to be "OUT" and the S&P 500 is the single best index for this purpose. This does not, however, mean that the 10-week/40-week crossover strategy works on all stocks or ETFs. It doesn't. There are other ways to select stocks and I will be covering that in my ChartCon presentation. I will give you a hint: it involves momentum.
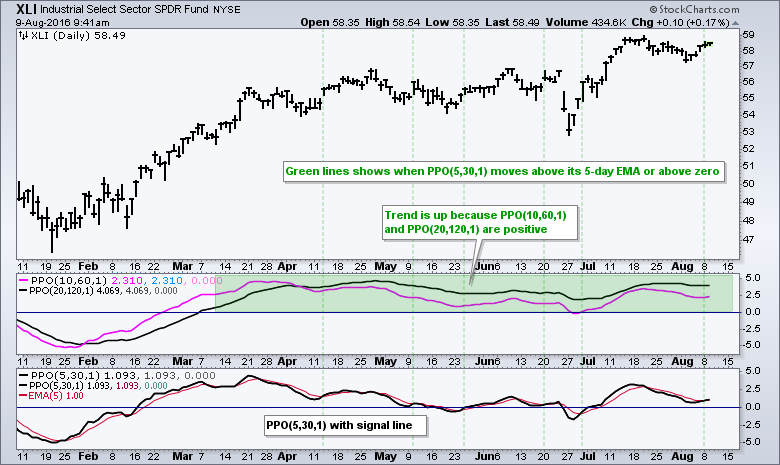
Secondly, the PPO Strategy is not very different from the RSI-StochRSI strategy I just showed with the sector SPDRs. The concept is exactly the same and there are three components to each strategy. First, there is a trend condition that must be met. The PPO Strategy requires the 10-day EMA to be above the 60-day EMA and/or the 20-day EMA to be above the 120-day EMA. Second, there is a setup. This happens when PPO (5,30,1) moves to the zero area. Third, there is a trigger. This occurs when PPO (5,30,1) moves back above the zero line or above its 5-day EMA (signal line). The RSI-StochRSI strategy is just a different recipe for the same dish (mean reversion trading).
The chart below shows XLI with the PPOs. The green shading shows when PPO (10,60,1) and PPO (20,120,1) are positive and the trend condition is bullish. The green dotted lines show when the PPO (5,30,1) moves above zero or above its signal line (5-day EMA). Chartists should compare the PPO Strategy and the RSI-StochRSI Strategy to see what works best for their needs.

******************************************************
Measuring Risk On-Risk Off - Using charts to quantify stock, economic and credit risk.
PPO Trading Strategy - How to use 3 PPOs to develop a trend-reversion trading strategy.
Long-term Trend Indicators - Using the PPO, EMA Slope and CCI to determine the trend.
ETF Master ChartPack - 300+ ETFs organized in a Master ChartList and in individual groups.
Follow me on Twitter @arthurhill - Keep up with my 140 character commentaries.
****************************************
Thanks for tuning in and have a good day!
--Arthur Hill CMT
Plan your Trade and Trade your Plan
*****************************************


