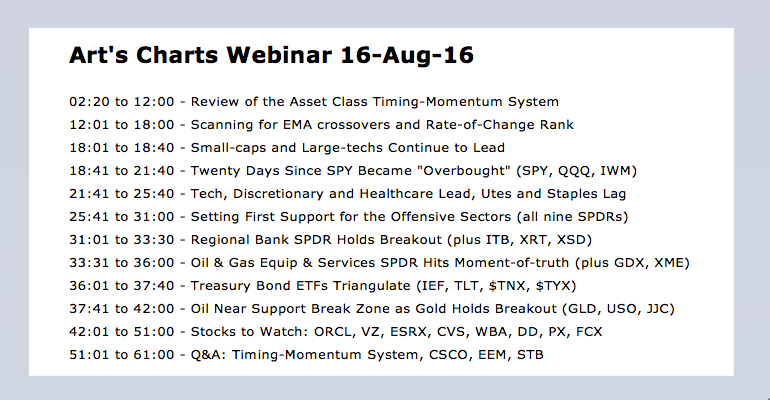
 Click here for the Webinar video - Click here for the Webinar ChartList
Twenty Days Since SPY Became "Overbought" // RSI for IWM finally Hits 70 // Small-caps and Large-techs Continue to Lead // Tech, Consumer Discretionary and Healthcare Lead // Utilities and Staples are Lagging // Setting First Support for the Offensive Sectors // Treasury Bond ETFs Triangulate // Webinar Preview
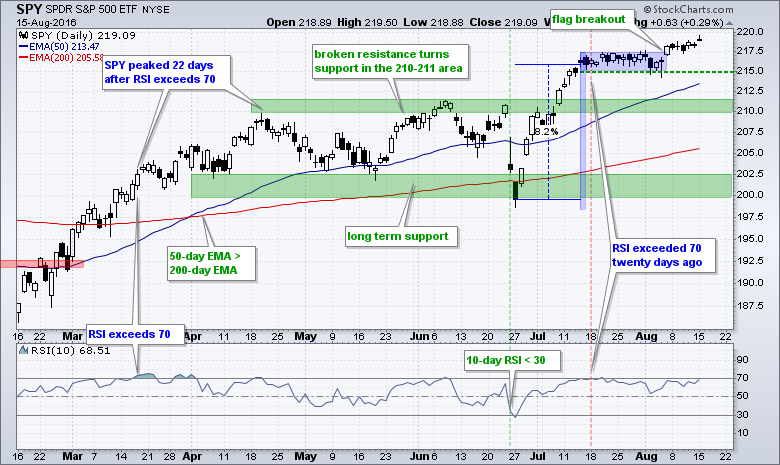
Twenty Days Since SPY Became "Overbought"
Guess what? There is no real change in the major index ETFs. Buying pressure may seem weak, but selling pressure is even weaker and the bullish bias remains. SPY surged some 8%, formed a flat flag and then broke flag resistance with the move above 217.50 on 5-Aug. The ETF has not moved much since this breakout, but the breakout is largely holding and selling pressure has been limited. The flag lows mark first support at 215. Broken resistance turns next support in the 210-211 area. For those counting RSI days, note that RSI first moved above 70 twenty days ago. SPY peaked 22 days after RSI moved above 70 in mid March. This is just an observation and my focus remains on the trend and flag support.
Programming Note: I revised the article on Asset Class Trading with Timing and Momentum. I added a paragraph on commissions and re-calculated the backtest using the next open for entry and exit prices.
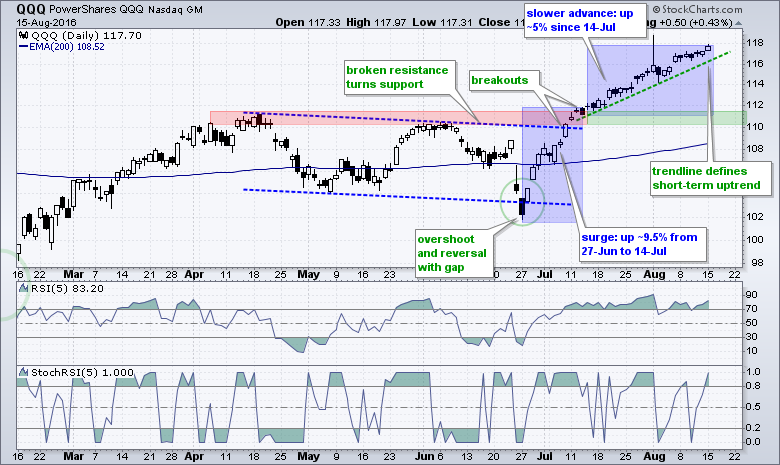
QQQ continues to march higher and hold the dotted green trend line. With the recent move above 117.50, I would now set 116 as the level to watch for a short-term trend reversal. Again, I do not think such a reversal is playable as a short-position. It is only something to consider for stops. The bigger trends are up and pullbacks are deemed opportunities, not threats.
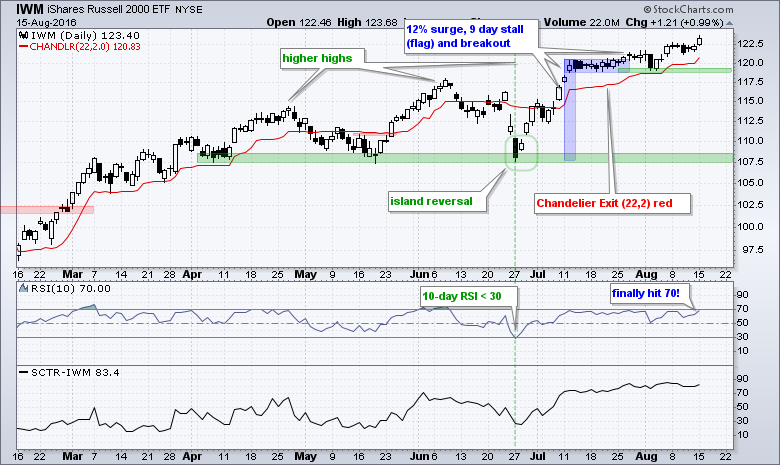
RSI for IWM finally Hits 70
IWM surged around 12%, stalled for nine days and has since been working its way higher. The ETF even got a momentum spark as RSI hit 70 for the first time since this rally began. Medium-term, the chart shows higher highs in April, June, July and now August. Short-term, I could mark support with last week's low, but this looks a little tight so I will leave key support at 118.50 for now (green zone). The red line shows the Chandelier Exit (22,2) moving higher as the ETF notched another higher high. In a separate, but soon related, note IWM has the highest SCTR (83.4) of the major index ETFs (SPY, QQQ, DIA, MDY, RSP).
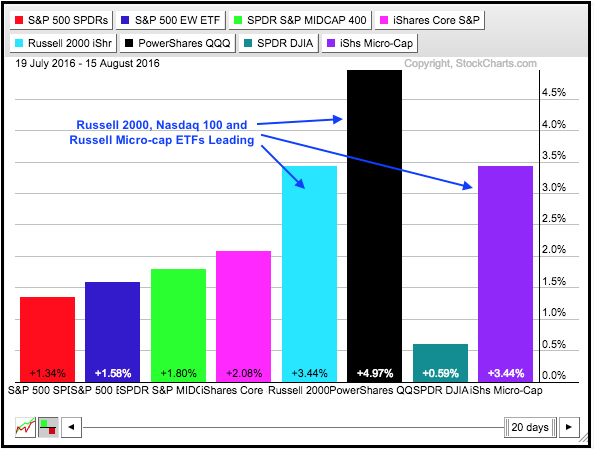
Small-caps and Large-techs Continue to Lead
The PerfChart below shows four week performance for eight major index ETFs. Notice that the Russell 2000 iShares (IWM), Nasdaq 100 ETF (QQQ) and Russell MicroCap iShares (IWC) are leading with the biggest gains. This shows a healthy appetite for risk and this is positive for the broader market.
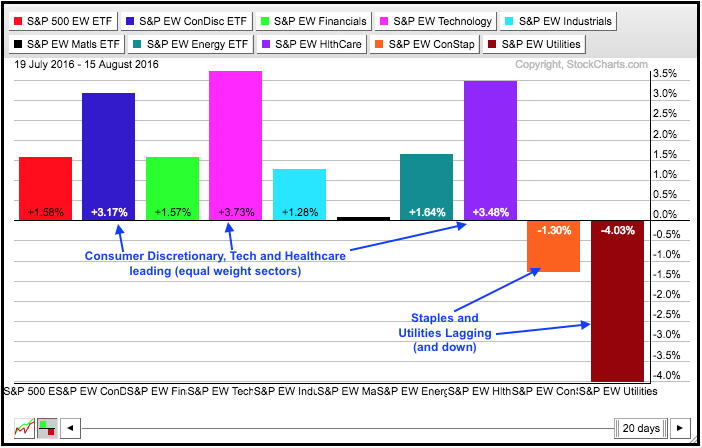
Tech, Consumer Discretionary and Healthcare Lead
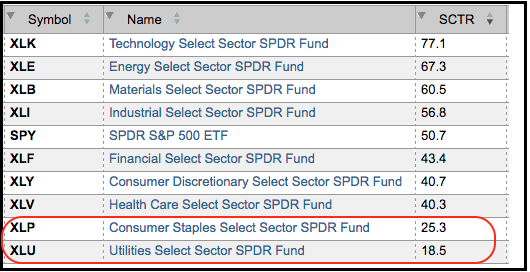
We can also see a risk-on preference when we look at the equal-weight sector PerfChart over the last four weeks. Notice that the EW Consumer Discretionary ETF (RCD) and EW Technology ETF (RYT) are leading, as is the EW Healthcare ETF (RYH). This means two of the four offensive sectors are leading over the past month. The EW Consumer Staples ETF (RHS) and EW Utilities ETF (RYU), which are defensive sectors, are lagging. Not only are they lagging, but they are also down over the last four weeks. XLU (18.5) and XLP (25.3) also have the lowest SCTRs of the nine sector SPDRs.
 We cannot really trade the equal-weight sector ETFs because volume is quite thin, but this does not make them less valuable for analysis. The equal-weight versions provide a better idea of broad sector performance. The sector SPDRs, on the other hand, are weighted by market cap and reflect large-cap performance within the sector.
Utilities and Staples are Lagging
Before hitting the sector charts, note that the 50-day EMAs are above the 200-day EMAs for all nine sectors, and all nine are trading above their 200-day EMAs. These sectors trends clearly support a bull market and I will not become concerned with the broader market (S&P 500) until four of the five sector SPDRs experience death crosses (50-day EMA crosses below 200-day EMA). Elsewhere, the Utilities SPDR (XLU) is the only sector trading below its 50-day EMA and it can be considered the weakest right now.
Setting First Support for the Offensive Sectors
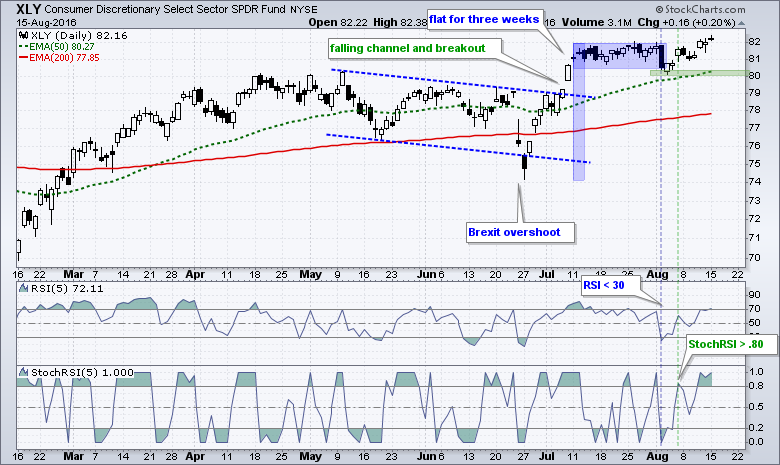
The first four charts focus on the offensive sectors (consumer discretionary, technology, finance and industrials). I am marking short-term support with the early August lows. All four are in bull mode and well above support right now. We should become concerned for a broad market correction when/if two of the four break short-term support. On the chart below, the Consumer Discretionary SPDR (XLY) edged above its July highs on Monday and remains bullish overall. Chartists can watch the flag lows and support at 80 for the first signs of weakness.
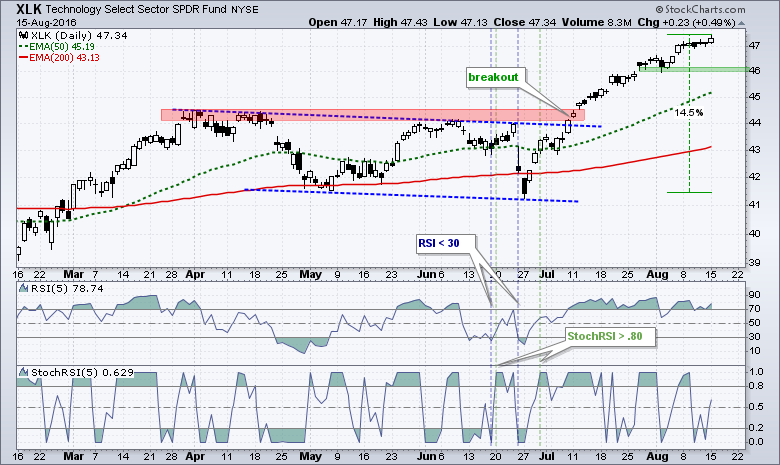
 The Technology SPDR (XLK) is the strongest of the nine sectors with a steady advance the last five weeks. Notice how 5-day RSI has been above 70 most of this timeframe as the ETF stayed overbought.
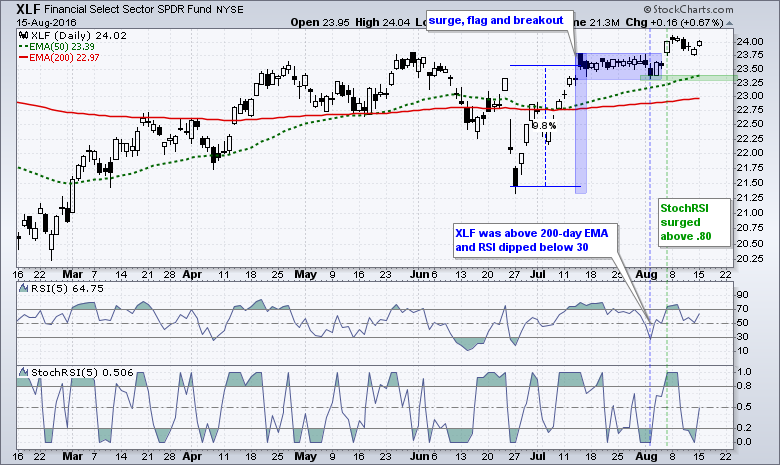
 The Finance SPDR (XLF) broke flag resistance last week and this breakout is holding for the most part. The flag lows mark first support.
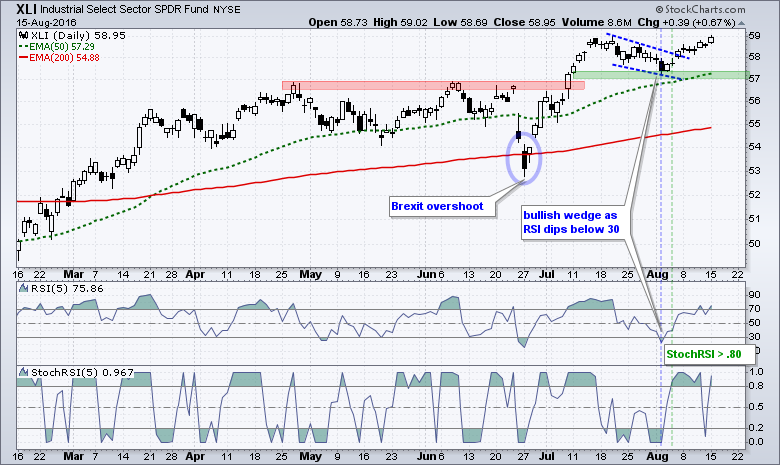
 The Industrials SPDR (XLI) broke wedge resistance on August 5th and this breakout is holding. The wedge lows mark first support at 57. Note: I will cover the other five sectors in today's webinar.
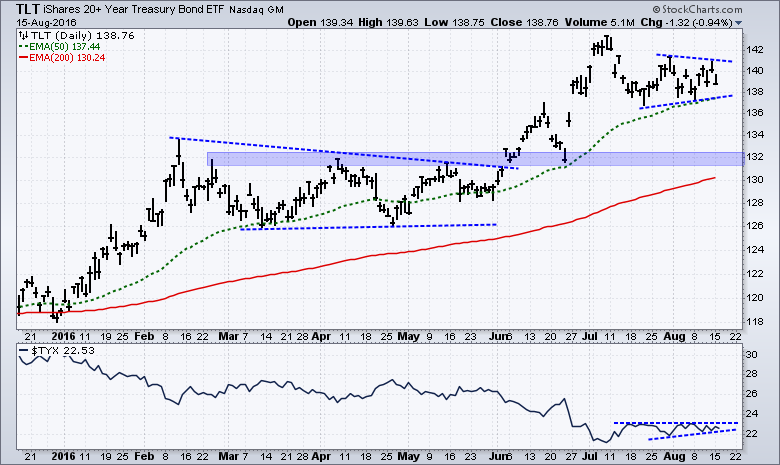
Treasury Bond ETFs Triangulate
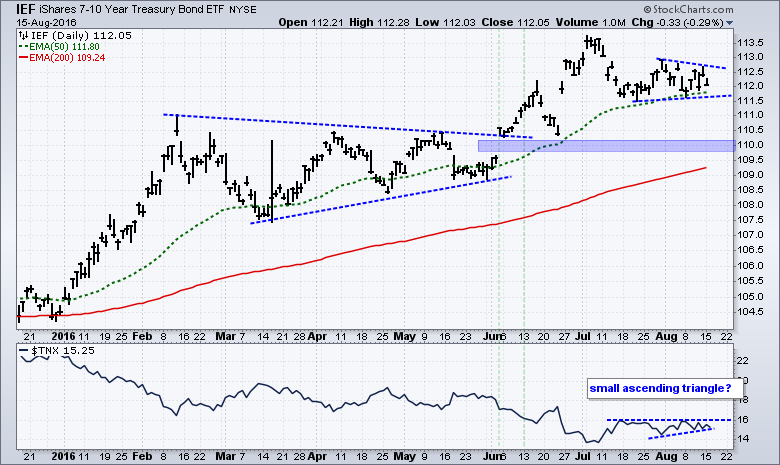
The 7-10 YR T-Bond ETF (IEF) and the 20+ YR T-Bond ETF (TLT) moved into trading ranges the last five weeks and triangles are taking shape. I am watching the triangle boundaries for the next directional clue. Even though the long-term trends are up for IEF and TLT, both fell sharply in early July and then formed these triangles. Support breaks would signal a continuation lower and target a move to the 110 area. Full Disclosure: this downside target is a guesstimate. The indicator window shows the 10-YR Treasury Yield ($TNX) with a small ascending triangle and an upside breakout would target a move to the 18 area (1.8%). A rise in Treasury yields would be bullish for the finance sector and bearish for utilities, telecom and other yield alternatives.
******************************************************
Measuring Risk On-Risk Off - Using charts to quantify stock, economic and credit risk.
PPO Trading Strategy - How to use 3 PPOs to develop a trend-reversion trading strategy.
Long-term Trend Indicators - Using the PPO, EMA Slope and CCI to determine the trend.
ETF Master ChartPack - 300+ ETFs organized in a Master ChartList and in individual groups.
Follow me on Twitter @arthurhill - Keep up with my 140 character commentaries.
****************************************
Thanks for tuning in and have a good day!
--Arthur Hill CMT
Plan your Trade and Trade your Plan
*****************************************


