Trend > Seasonality // QQQ and IWM Hold Support // EW Finance ETF Nears 52-week High // Measuring Correlations with the 10-yr Yield ///// .....
Trend > Seasonality
.... I pointed out the negative seasonal pattern for August over the last 20 years, but this does not guarantee a correction or pullback in the stock market. Remember, August has closed higher 50% of the time over the last twenty years so it is still just a coin flip. As far as I am concerned, there is a pecking order of importance and the seasonal patterns are less important than the broad market environment. The broad market environment has been bullish since early March and remains bullish. I do not know when it will turn bearish, but I will continue expect higher prices in the broad market indexes over the next two to six months as long as this bullish environment remains.
QQQ and IWM Hold Support
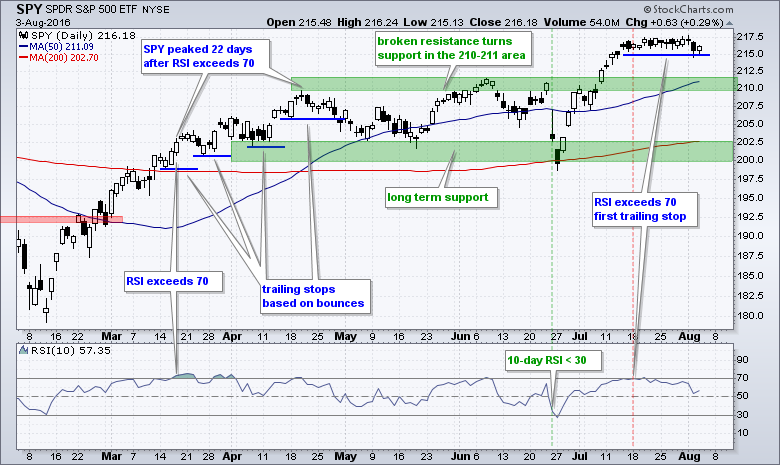
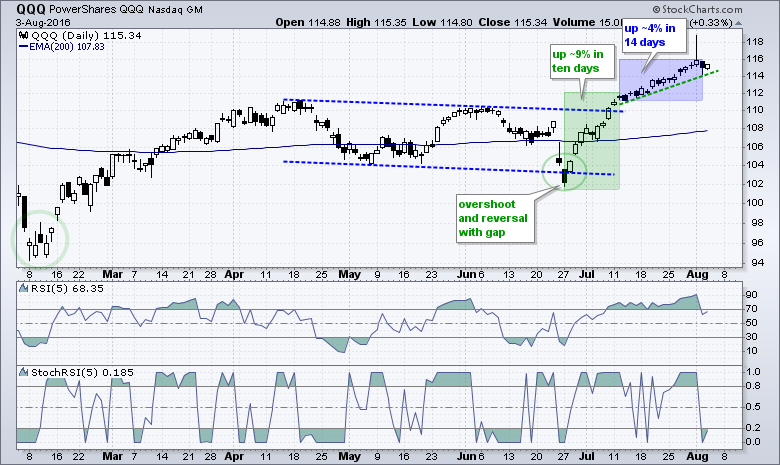
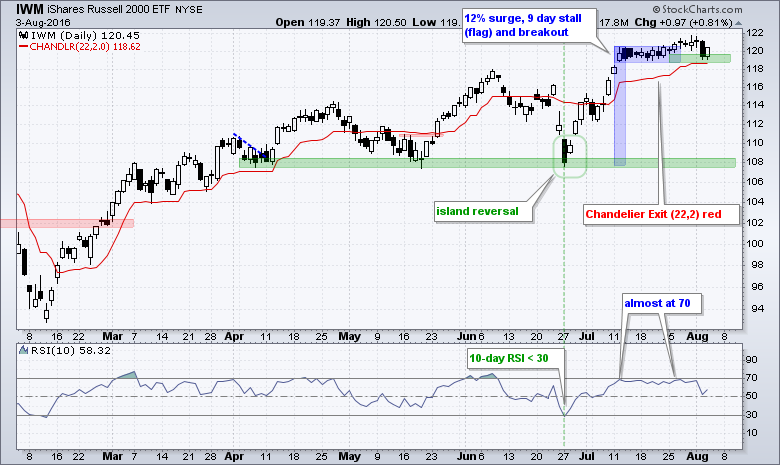
The long-term trends for the major index ETFs are obviously up when the broad market environment is bullish. Thus, seasonal patterns gain importance when we see price action aligning with said patterns. A long-term downtrend and bearish seasonal pattern is a powerful combination. A long-term uptrend, short-term downtrend and bearish seasonal pattern is negative, but not that bearish because the long-term uptrends still hold more sway. At this stage, I do not even see short-term support breaks for the big three (SPY,QQQ,IWM). SPY is holding the 215 level, QQQ is holding above 114 and IWM has yet to break its late July lows.
EW Finance ETF Nears 52-week High
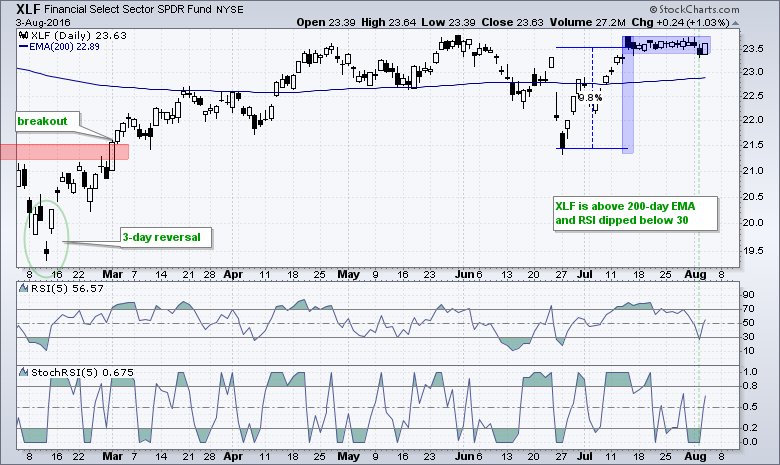
The finance sector got a lot of attention on Wednesday as banks bounced. Even though the Finance SPDR (XLF) is still consolidating near its May high, the EW Finance ETF (RYF) shows more strength because it is above its May high. The first chart shows XLF oscillating above/below the 200-day EMA, which has been rising the last four weeks. After a ~10% surge, the ETF rested as a flag flat formed the last few weeks (blue shading). This is a bullish continuation pattern and a breakout would signal a continuation of the June-July surge. The indicator window shows RSI(5) moving below 30 for a bullish setup (short-term correction within bigger uptrend).
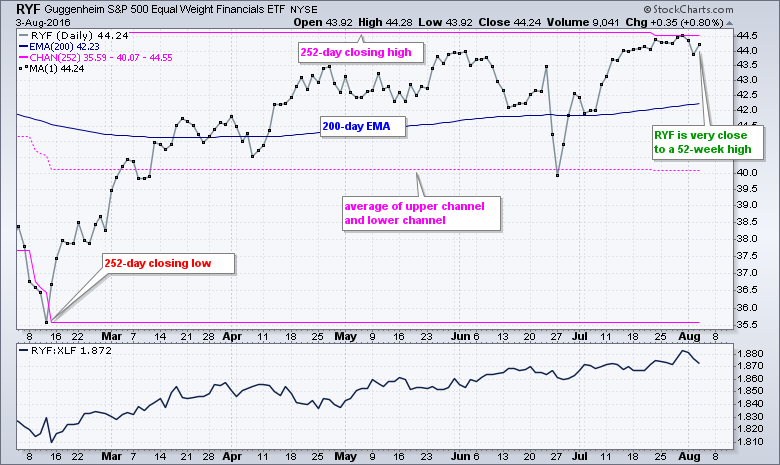
The next chart shows the close-only plot for the EW Finance ETF with a 252-day price channel (~one year) and the price relative (RYF:XLF ratio). On a close-only chart, the 252-day price channel shows the highest close of the last 252 days, the lowest close of the last 252-days and the average of these two lines (dotted line). The 252-day closing low is at 35.59, the 252-day closing high is at 44.55, and RYF is very close to a new high. The indicator window confirms relative strength in RYF because the RYF:XLF ratio has been rising the last six months. XLF is heavily weighted towards the big banks. RYF is equally weighted and benefits more from strength in REITs and insurance stocks.
Measuring Correlations with the 10-yr Yield
John Murphy wrote about banks, bond proxies and the possibility of a bottom in the 10-YR Treasury Yield on Wednesday. John noted the surge in the Japanese 10-yr Yield as a potential catalyst and also noted the positive effect of rising rates on banks. Also note that the employment report is Friday and the bond market could react further after this report. Don't ask me which way because I have no clue! Just watch the charts.
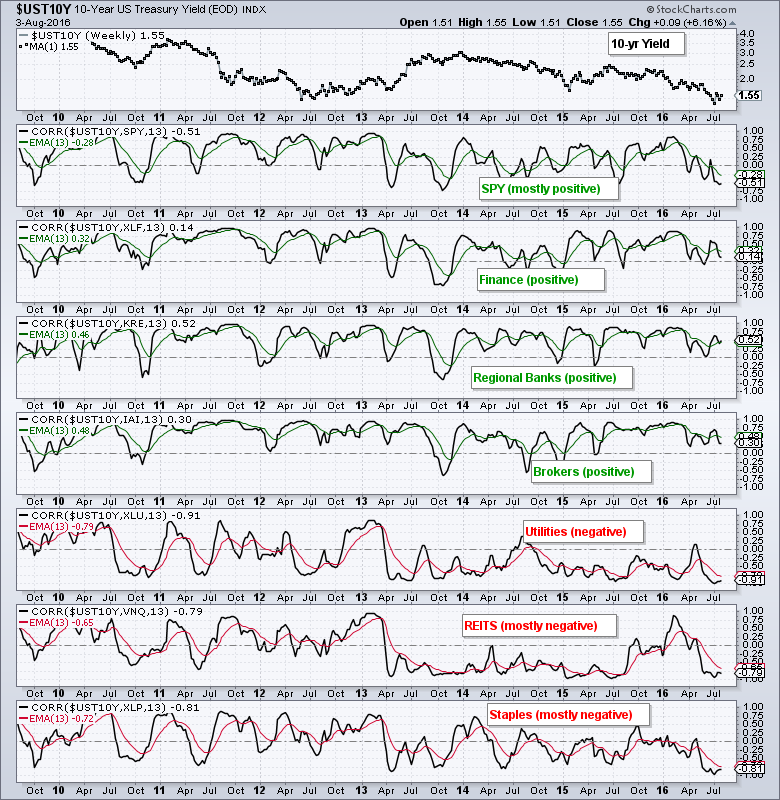
Whichever way the 10-yr yield moves, we can anticipate its effect on other groups using the Correlation Coefficient. The correlation between the 10-YR Treasury Yield and SPY can fluctuate, but banks and utilities have a pretty strong relationship. The chart below shows the 10-YR T-Yield in the top window with the Correlation Coefficient in the lower windows. This is a weekly chart with a 13-week Correlation Coefficient and a 13-week EMA of the Correlation Coefficient. Banks and brokers have a strong POSITIVE correlation with the 10-yr Yield. Utilities have a strong negative correlation, while REITs and Staples are mostly negatively correlated. This means that a rise in the 10-yr Yield would be positive for banks and brokers, but negative for utilities, staples and REITs.
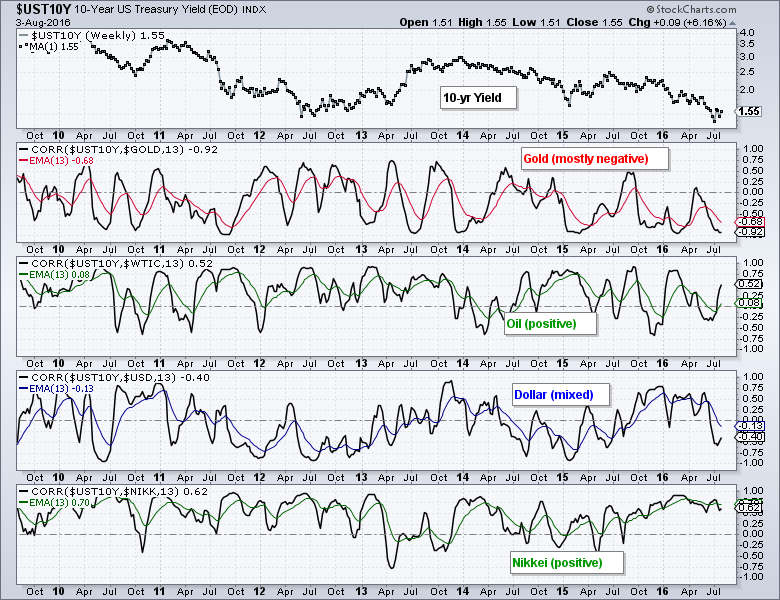
The next chart shows the 10-yr Yield and Correlation Coefficients for gold, oil, the Dollar and the Nikkei 225. Note that gold is mostly negatively correlated and this means a rise in the 10-yr yield could weight on gold. Conversely, the Nikkei has a strong positive correlation and this means a rise in the 10-yr Yield would be bullish for Japanese stocks.
******************************************************
Measuring Risk On-Risk Off - Using charts to quantify stock, economic and credit risk.
PPO Trading Strategy - How to use 3 PPOs to develop a trend-reversion trading strategy.
Long-term Trend Indicators - Using the PPO, EMA Slope and CCI to determine the trend.
ETF Master ChartPack - 300+ ETFs organized in a Master ChartList and in individual groups.
Follow me on Twitter @arthurhill - Keep up with my 140 character commentaries.
****************************************
Thanks for tuning in and have a good day!
--Arthur Hill CMT
Plan your Trade and Trade your Plan
*****************************************


