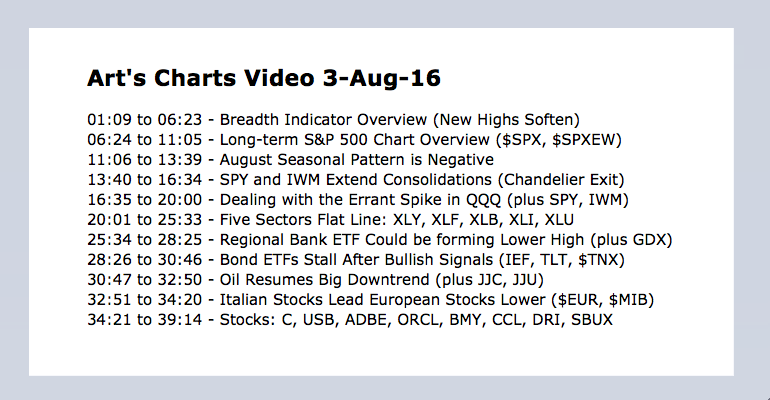
Tuesday's webinar for Art's Charts was cancelled due to technical difficulties. Most of the webinar is based on the charts from Tuesday's commentary, which are posted again below. In addition to these charts, I am also covering the nine sector SPDRs, T-Bond ETFs, Gold, Oil and a few stocks. The timeline for the full video is shown above.
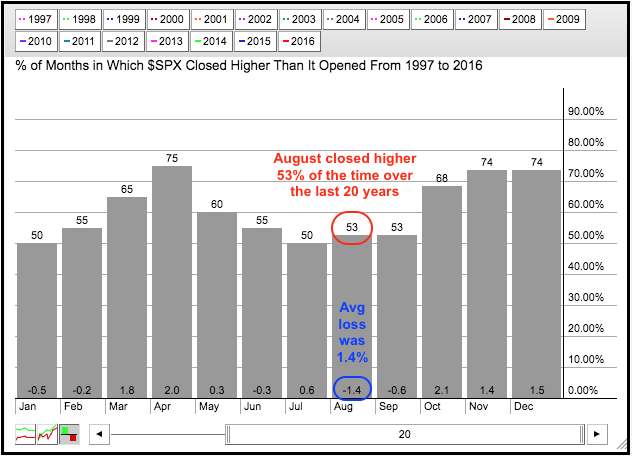
Seasonality Chart for S&P 500
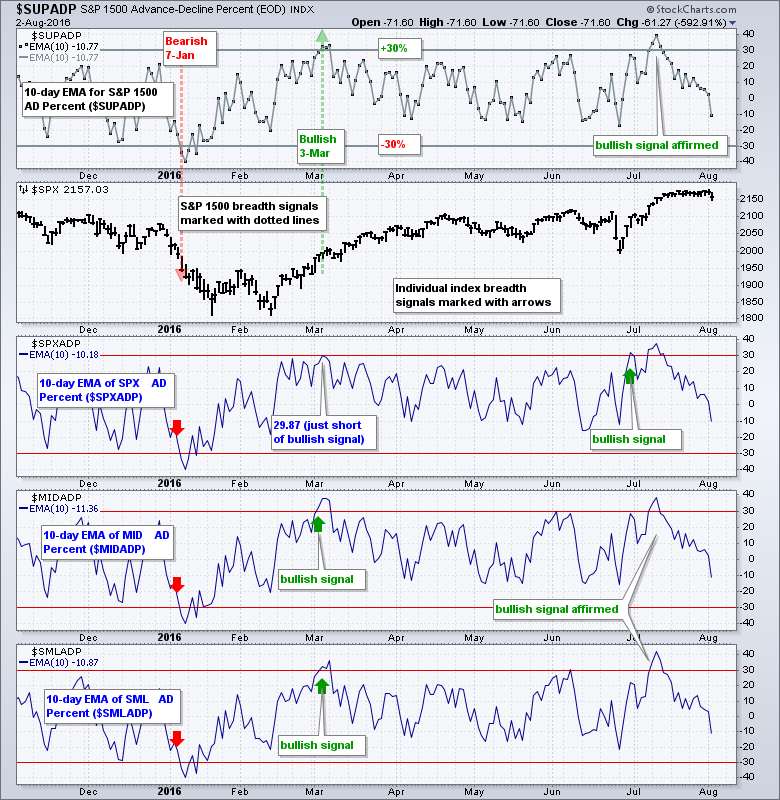
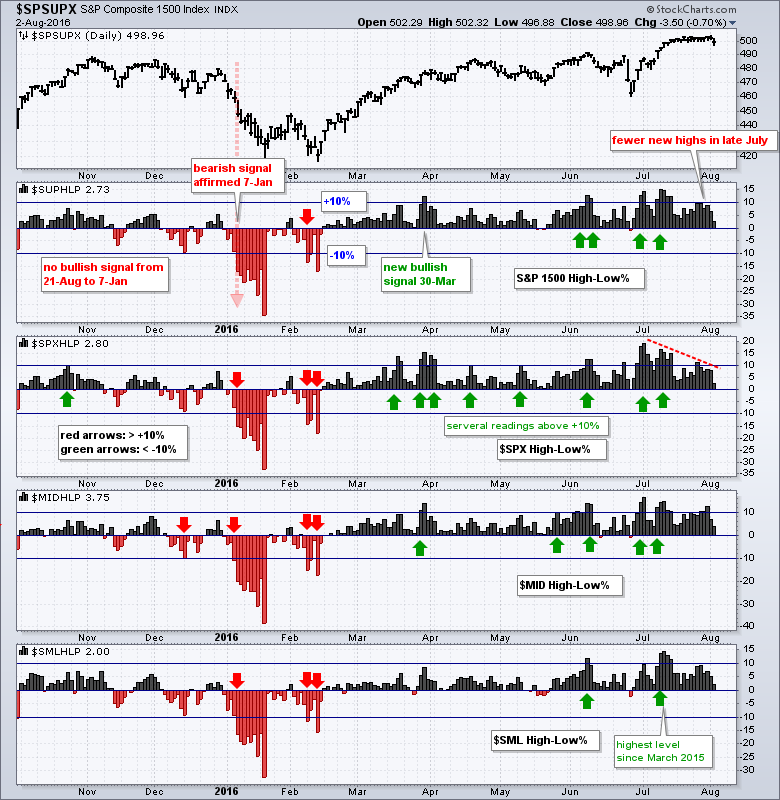
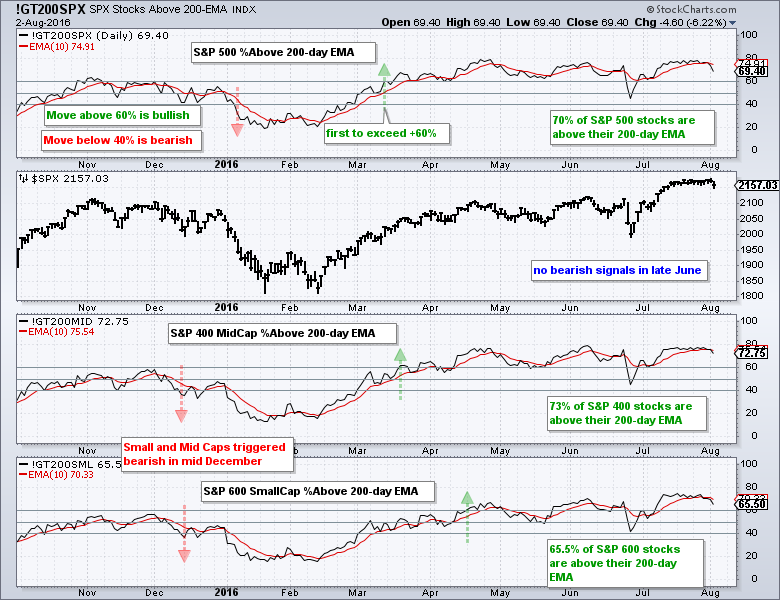
Breadth Indicator Review
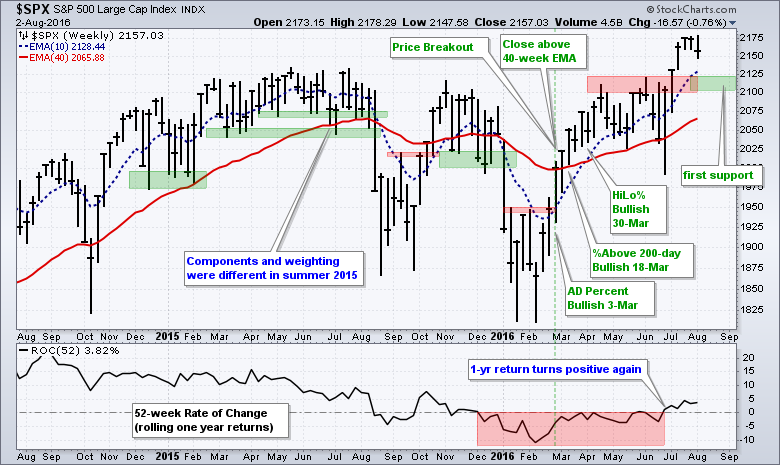
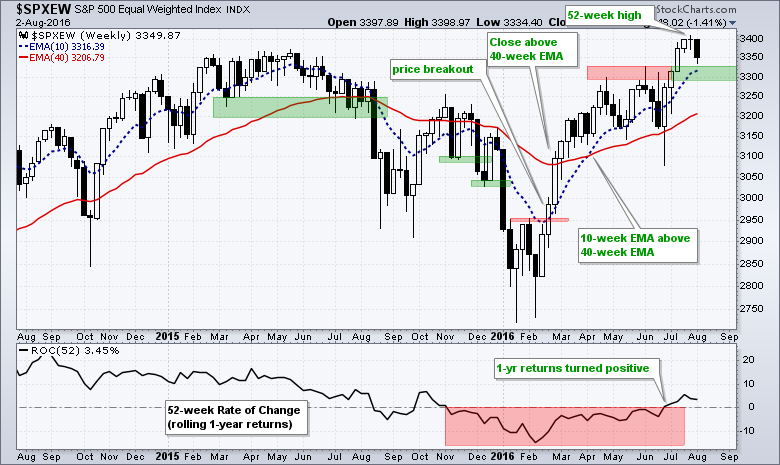
Long-term S&P 500 Chart
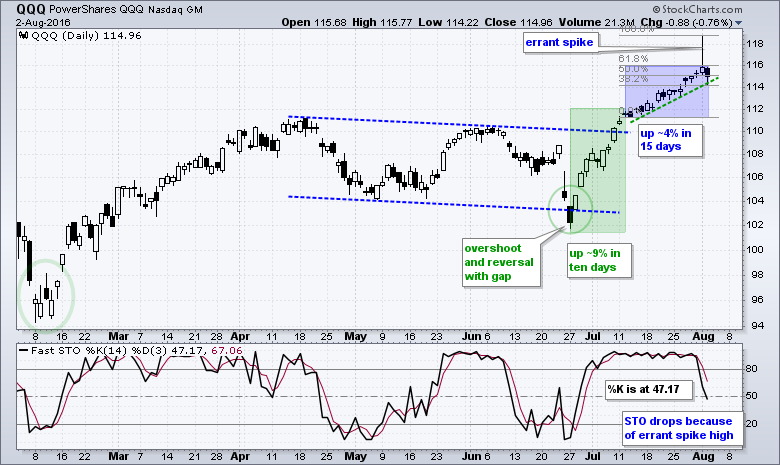
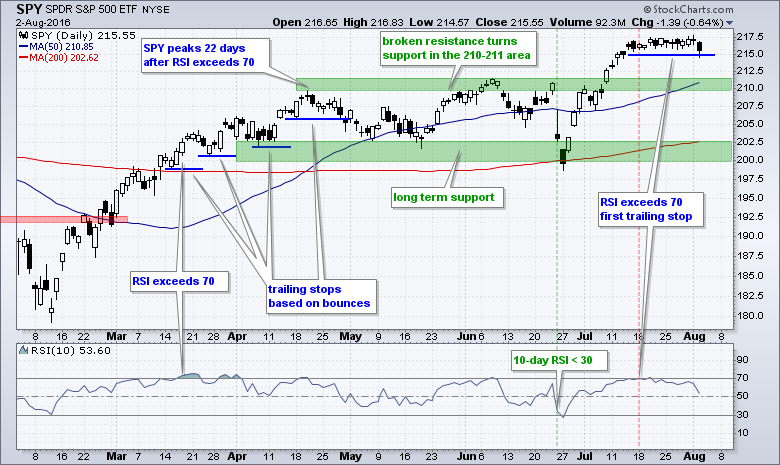
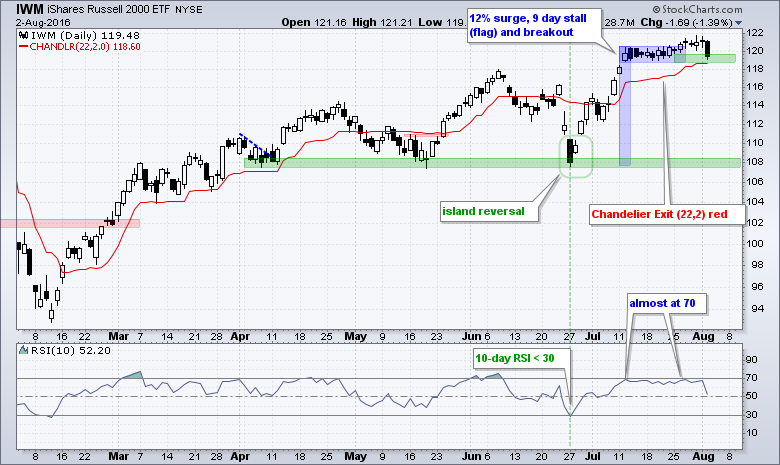
QQQ, SPY and IWM Charts
******************************************************
Measuring Risk On-Risk Off - Using charts to quantify stock, economic and credit risk.
PPO Trading Strategy - How to use 3 PPOs to develop a trend-reversion trading strategy.
Long-term Trend Indicators - Using the PPO, EMA Slope and CCI to determine the trend.
ETF Master ChartPack - 300+ ETFs organized in a Master ChartList and in individual groups.
Follow me on Twitter @arthurhill - Keep up with my 140 character commentaries.
****************************************
Thanks for tuning in and have a good day!
--Arthur Hill CMT
Plan your Trade and Trade your Plan
*****************************************


