REITs and Banks go their Separate Ways // Financial Services Starts to Outperform // Real Estate Starts to Underperform // Notes on XLRE and XLFS // REITs are Negatively Correlated to Treasury Yields // Banks are Positively Correlated to Yields //// .....
REITs and Banks go their Separate Ways
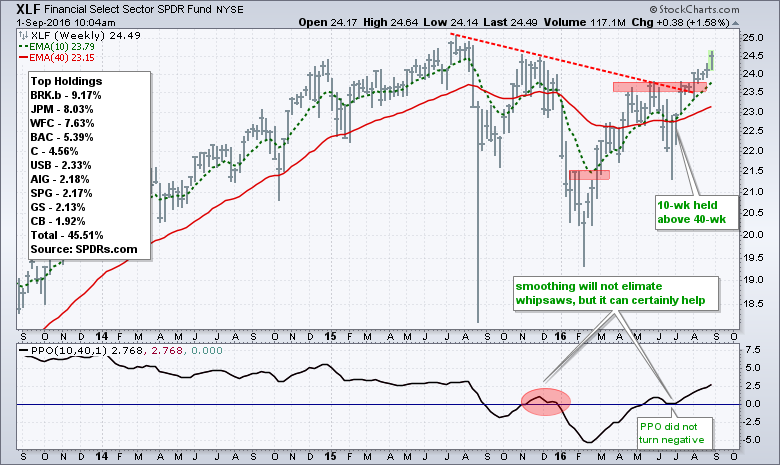
Standard and Poor's is removing REITs from the S&P Finance Sector ($SPF) and creating a new Real Estate sector. This split could affect ETFs based on the S&P Finance sector and it most definitely will effect the Finance SPDR (XLF), and eventually the EW Finance ETF (RYF). Before delving into some details, the weekly chart below shows XLF breaking the red line and resistance zone five week's ago. Prior to that, the 10-week EMA moved above the 40-week EMA in early May and held above during the June dip (BREXIT). This is one of the stronger sectors right now, with or without REITs. The chart also shows the top ten holdings right now and Simon Property Group (SGP) weighs in at 2.17%.
Financial Services Starts to Outperform
State Street, sponsor of SPDRs, is splitting XLF into two separate sector SPDRs, the Financial Services SPDR and the Real Estate SPDR (XLRE). State Street will issue a special dividend that will be comprised of XLRE shares. Please check the State Street press release for more details. Note that the Financial Services SPDR (XLFS) has been trading for a while, but volume is erratic. This will likely change by the end of the month, which is when State Street plans the special dividend. XLFS appears to be the tracking ETF for XLF after the spin-off. From a technical perspective, XLFS broke out over the past week and the 50-day moved above the 200-day. Also notice that XLFS is starting to outperformed XLRE as the price relative (XLFS:XLRE) broke above the red trend line.

Real Estate Starts to Underperform
The next chart shows XLRE peaking in early August and falling over the last four weeks. REIT ETFs were top performers from February to early July, but they started to underperform in early July. The bigger trend is still up because the 50-day EMA is well above the 200-day EMA, but relative weakness suggests that there are better opportunities out there right now. The indicator window show the price relative (XLRE:XLFS ratio) peaking in early July and moving lower the last eight weeks. A small pennant may now be forming and a break below 33 would target a move to the 31.50 area.

A Couple More Notes on XLRE and XLFS
As this article at ETF.com explains, the REIT portion of the finance sector has grown from 0.6% in 2001 to 20% today. XLF has around $16 billion in assets under management (AUM) and this means the new REIT SPDR will have around $3.2 billion in AUM. Note that the Materials SPDR (XLB) has $2.75 billion in AUM and the new REIT SPDR will already be the second biggest sector. The REIT SPDR will not include Mortgage REITs, which will remain part of the Financial Services SPDR.
REITs are Negatively Correlated to Treasury Yields
The next chart shows the REIT iShares (IYR), which has a long history and is better suited for long-term analysis. It is also very liquid, as is the Vanguard REIT ETF (VNQ). The long-term trend is clearly up so there is no change with the XLRE analysis. Notice that IYR tends to move in tandem with the 20+ YR T-Bond ETF (TLT). This is because REITs, like utilities, are bond surrogates. They are attractive for their yield and this means they are affected by changes in Treasury yields. Also note that the yield for XLF will drop significantly when REITs are removed.

The indicator window shows the Correlation Coefficient ($TYX, IYR) in negative territory for most of the time. This means Treasury yields and REITs tend to move in opposite directions. An upside breakout in the 30-YR Treasury Yield, therefore, would be quite negative for REITs.
Banks are Positively Correlated to Yields
It looks like Standard and Poor's is on to something with this separation because banks and REITs act totally different to changes in Treasury yields. The next chart shows the iShares Financial Services ETF (IYG), which is the closest thing I can find to the Financial Services SPDR (XLFS) - a market-cap weighted finance ETF with big banks dominating. There are no REITs, but the ETF does include Visa (V) and Mastercard (MA), which are part of the Technology SPDR (XLK). In any case, IYG shows a strong positive correlation to the 2-year Treasury Yield ($UST2Y) and a mostly positive correlation to the 30-YR Treasury Yield. Thus, REITs would be negatively affected by a rise in Treasury yields and banks would be positively affected.

******************************************************
Measuring Risk On-Risk Off - Using charts to quantify stock, economic and credit risk.
PPO Trading Strategy - How to use 3 PPOs to develop a trend-reversion trading strategy.
Long-term Trend Indicators - Using the PPO, EMA Slope and CCI to determine the trend.
ETF Master ChartPack - 300+ ETFs organized in a Master ChartList and in individual groups.
Follow me on Twitter @arthurhill - Keep up with my 140 character commentaries.
****************************************
Thanks for tuning in and have a good day!
--Arthur Hill CMT
Plan your Trade and Trade your Plan
*****************************************


