Is Stalling Bullish or Bearish? .... Key Risk Indicators Remain Net Bullish .... Technology, Finance and Energy Lead .... Consumer Discretionary Groups Lag Long-term, But Lead Short-term .... Retail SPDR Attempts Breakout, But Housing Breaks Down .... //// ....
Is Stalling Bullish or Bearish?
Stocks started their stall in mid July and continued that stall into early October. Except for a brief respite with a plunge-recovery in September, the S&P 500 and S&P MidCap 400 are stalling again near their mid July levels. The S&P Small-Cap 600 is outperforming because it remains just above the July highs and the Nasdaq 100 is the strongest because it hit a new high yesterday. Using the S&P 500 as the stock market benchmark, note that the index hit new highs in August and remains in a clear uptrend. The index is above the rising 200-day EMA and the 50-day EMA is above the 200-day EMA. A stall within an uptrend is typically a rest within the uptrend or a bullish continuation pattern. This means I expect a bullish resolution to the consolidation. Click here for the webinar video
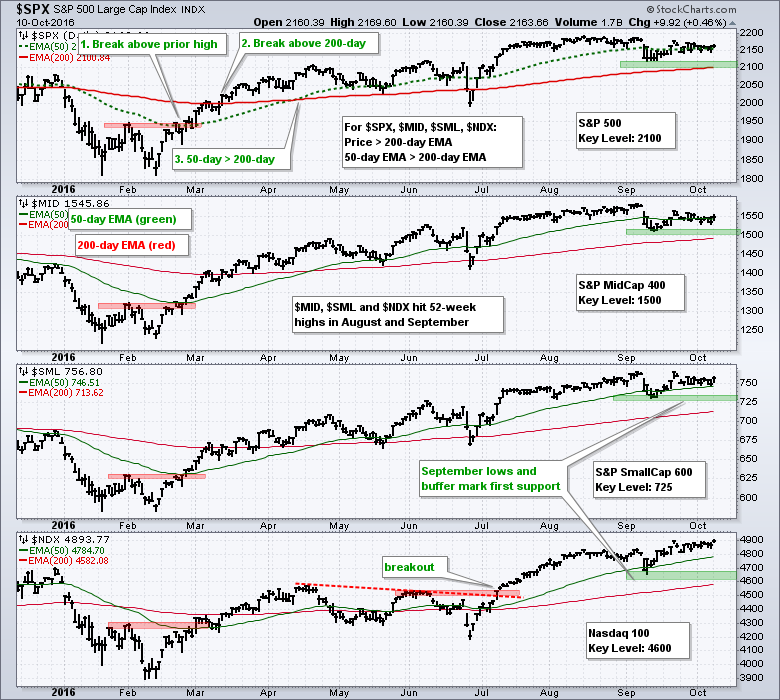
The chart above shows four key indexes with the green areas marking key support near the mid September lows. These are reaction lows that mark a price area where buying pressure overpowered selling pressure. Stocks fell in early September when selling pressure increased. The indexes stopped falling as buying pressure appeared in mid September and rebounded on renewed buying. These lows mark the first "demand" points to watch. A break below the support zones would show an increase in selling pressure and call for a re-evaluation of the existing uptrends.
Key Risk Indicators Remain Net Bullish
The next chart shows SPY and five risk ratios and the 120-day EMAs. All five are bullish with the green zones marking key lows to define the uptrends. Even though two are close, I would not become concerned unless three of the five break below the green zones. The first three ratios measure the relative performance of mid-caps, small-caps and the equal-weight S&P 500. The risk appetite is strong when these higher risk stocks outperform the S&P 500 SPDR. Mid-caps are leading overall, but the MDY:SPY ratio fell over the last few weeks and is near the green zone. No break yet. Small-caps are clearly leading large-caps. The EW S&P 500 ETF (RSP) is performing in-line with SPY. Equal-weights are neither leading nor lagging so this one is a push (neutral).
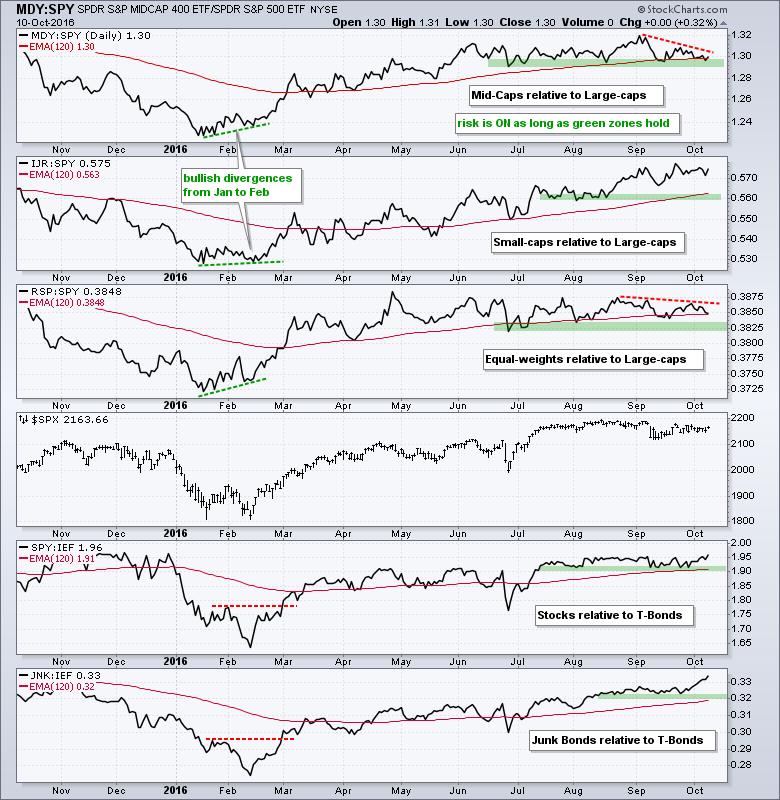 The last two ratios tap into the bond market by showing stocks relative to T-bonds and junk bonds relative to T-Bonds. The risk appetite is strong when stocks (risk assets) outperform bonds and the SPY:IEF ratio rises (which it is). The risk appetite is also strong when higher-risk junk bonds outperform safe-haven Treasury bonds and the JNK:IEF ratio rises (which it is).
Technology, Finance and Energy Lead
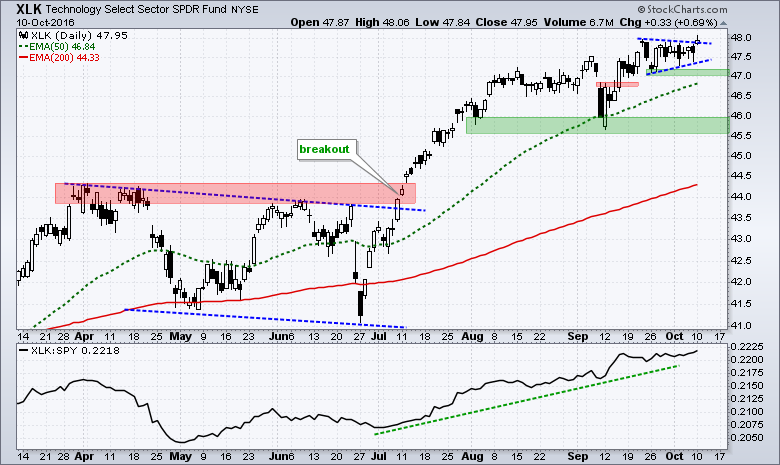
The Technology SPDR (XLK) and Energy SPDR (XLE) hit new highs on Monday and the Finance SPDR (XLF) is quite close to a new high. The first chart shows XLK surging in mid September, forming a triangle and attempting a triangle breakout on Monday. There is nothing bearish on this chart and leadership in technology is positive for the market. Short-term support is set at 47 and long-term support at 45.5-46.
 The next chart shows XLF forming a piercing pattern near support in late September and breaking flag resistance with a surge above 19.4 last week. Notice that the XLF:SPY ratio surged the first week of October as XLF seriously outperformed SPY.
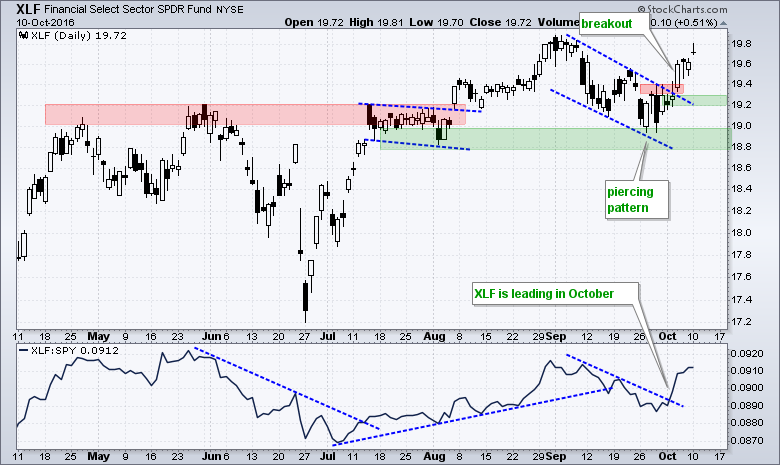 XLE has been within a rising channel for some six months now and the SPDR is nearing the upper trend line. This is not bearish, but it does suggest that the bounce is getting extended. Notice that XLE hit a 52-week high and the price relative (XLE:SPY ratio) hit a 51-week high. Energy continues to lead. Note that I will review the other five sector SPDRs in today's webinar.

Discretionary Groups Lag Long-term, But Lead Short-term
The consumer discretionary sector and associated industry groups have underperformed the broad market over the last three and six months, but this did not prevent SPY and IWM from posting nice gains. The PerfChart below shows SPY up 6.79% since April 8th and IWM up a whopping 14.86%. In contrast, the Consumer Discretionary SPDR (XLY) is up just 3.32%, the EW Consumer Discretionary ETF (RCD) is up 1.86%, the Retail SPDR (XRT) is up a mere 1.07% and the Home Construction iShares (ITB) is up 1.05%.
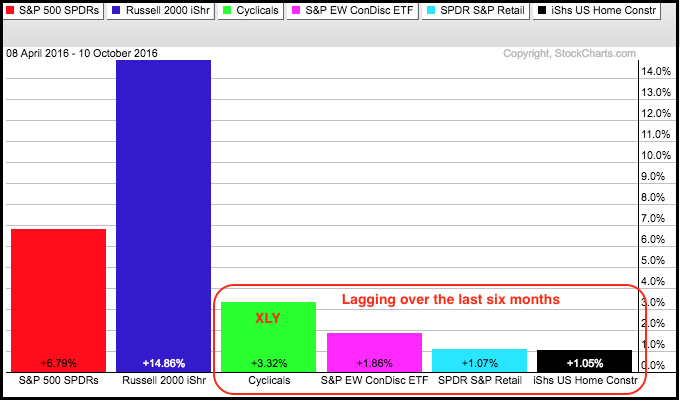 These four are clearly lagging the broader market, but note that relative weakness had little effect on the broad market performance. The market is clearly more than just this sector and these industry groups. Basically, the market goes up when the majority of its sector weightings go up. It does not matter which sectors lead because the market rises as long as 50 + 1 percent of the sectors are going up.
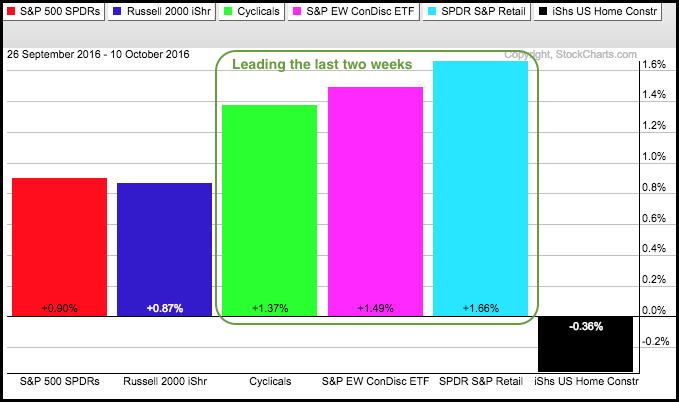
Even though the groups above are lagging long-term, I noticed that we are starting to see some relative strength in XLY, RCD and XRT over the last two weeks. The next PerfChart shows these three up more than SPY and IWM since September 26. ITB remains a laggard and is actually down over the timeframe.
Retail SPDR Attempts Breakout, But Housing Breaks Down
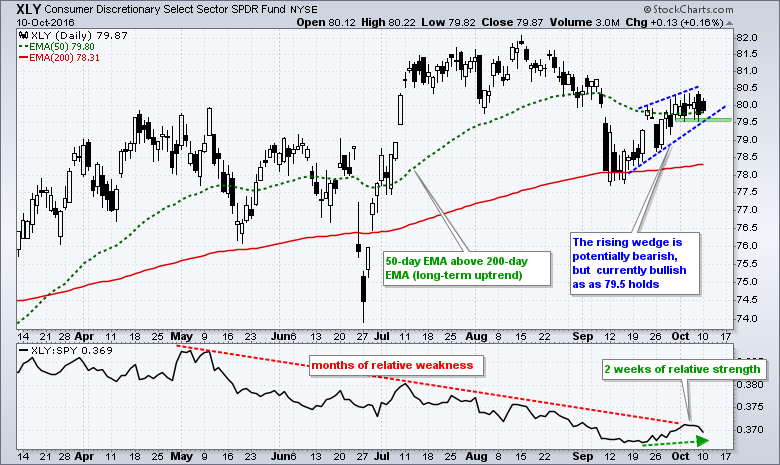
XLY remains with a rising wedge defining the short-term uptrend. The early October lows mark first support at 79.5.
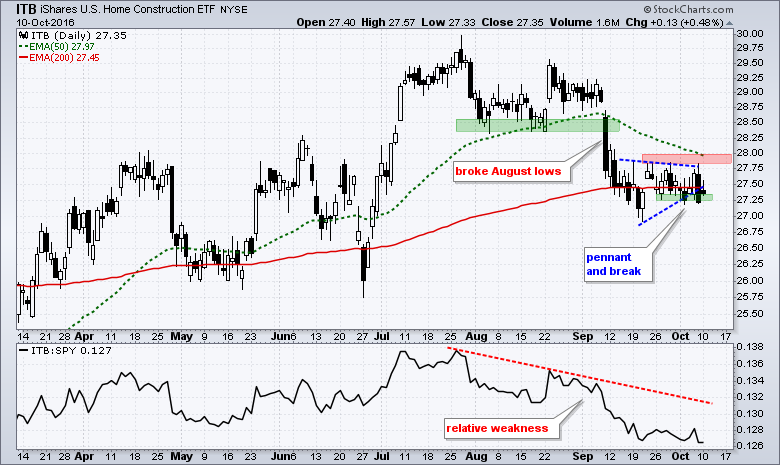
 ITB broke pennant support last week and the price relative (ITB:SPY ratio) hit a six-month low. ITB needs a close above 28 to reverse the downtrend.
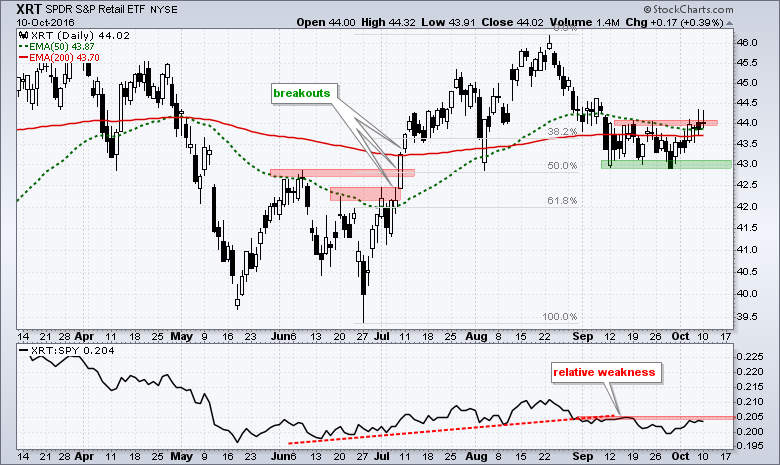
 XRT is making a breakout bid with the close above 44 (44.02 to be exact). Notice that the 50-day EMA is above the 200-day EMA and the stock firmed near the 50% retracement. A successful breakout would be quite positive for retail and the consumer discretionary sector. Failure to hold the breakout and a subsequent support break would be most bearish.
******************************************************
Measuring Risk On-Risk Off - Using charts to quantify stock, economic and credit risk.
PPO Trading Strategy - How to use 3 PPOs to develop a trend-reversion trading strategy.
Long-term Trend Indicators - Using the PPO, EMA Slope and CCI to determine the trend.
ETF Master ChartPack - 300+ ETFs organized in a Master ChartList and in individual groups.
Follow me on Twitter @arthurhill - Keep up with my 140 character commentaries.
****************************************
Thanks for tuning in and have a good day!
--Arthur Hill CMT
Plan your Trade and Trade your Plan
*****************************************


