Introduction .... Background for the Best Six Month Strategy .... Seasonal Patterns Don't Always Work .... Testing the Classic Six-Month Cycle .... Tweaking the Cycle to Account for Seasonality .... Add Market Timing with weekly MACD .... SPY, MACD and Seasonality Now .... Tough to Beat EMA Crossover System .... Final Thoughts as Q4 Hits .... //// ....
Introduction
November is right around the corner and this means we will soon enter the "Best Six Months" period for the stock market. Today I will look at the six-month cycle in detail and provide some performance numbers for this strategy. I will also show a tweak to this cycle and add a MACD timing mechanism. After all this work, I will then compare the results with basic market timing. Does the six-month cycle add value or would we be better off with basic market timing? You might be surprised.
Background for the Best Six Months Strategy
Yale Hirsch of the Stock Trader's Almanac discovered the "Best Six Months" switching strategy. By the way, the Stock Trader's Almanac is a great resource and the 2017 edition is already out and available in our bookstore. According to the almanac, November to April is the best six-month period for the stock market and May to October is the worst six-month period. The chart below shows the beginning and end of each period over the last 12 years. The red lines mark the start of the weakest six-month period and the green lines mark the start of the strongest six-month period.
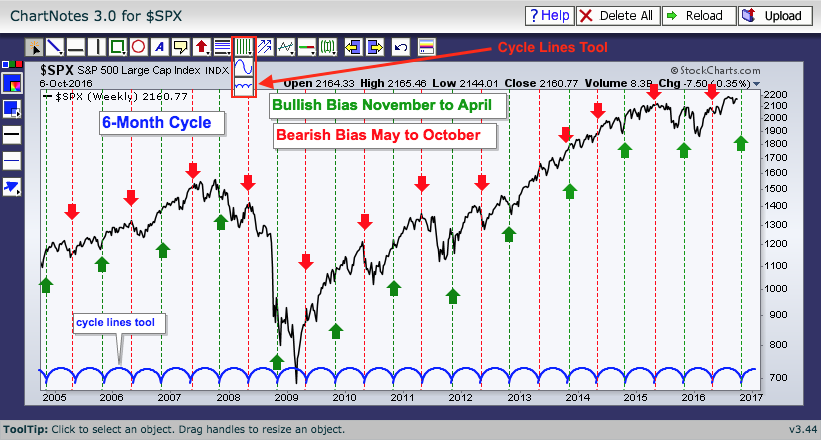
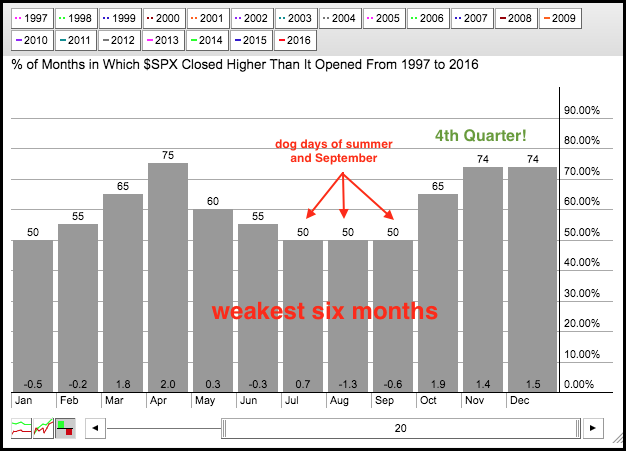
The weakest six-month period includes the dog days of summer and September, which is traditionally a weak month for the S&P 500. The seasonal chart below shows monthly performance for the S&P 500 from 1997 to 2016. January, June, July, August and September were the weakest months. October, November, December, March and April were the strongest months. Despite its reputation, October is more positive than negative and the market has a habit of bottoming in October. In fact, notice that the fourth quarter is traditionally a very strong quarter and this quarter just started.
Seasonal Patterns Don't Always Work
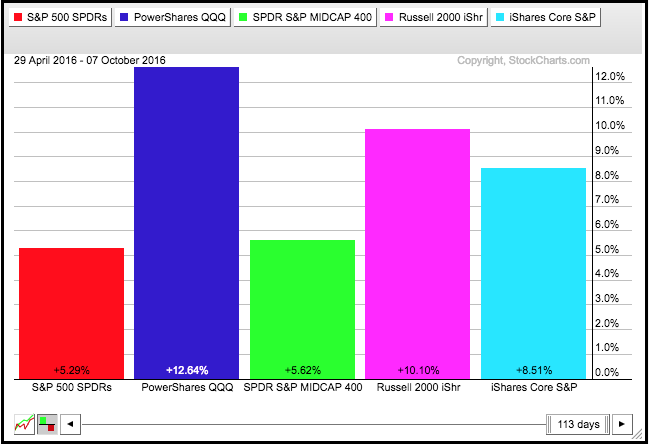
As with all cycles, the best six-month pattern does not always work. Barring a major decline over the next three weeks, it looks like the current worst six-month period (May to October) will finish very positive and outperform the prior six-month period, which was a best six-month period. The PerfChart below shows the performance for five major index ETFs from April 29th to October 6th. SPY is up a respectable 5.65%, while QQQ and IWM are up double digits. Large-cap techs and small-caps are clearly leading the market and performing well during this seasonally weak period. Perhaps that is testament to underlying strength in the stock market.
Testing the Classic Six-Month Cycle
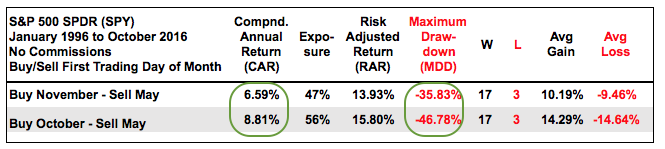
Now let's put the six-month cycle to the test. The table below shows the results for three backtests using total return data for the S&P 500 SPDR (SPY) from 1/1/1996 to 10/1/2016 (total return data includes dividends). The first line shows buy-and-hold for SPY, which acts as the base case scenario. The second line shows the results for buying on the first trading day of November and selling on the first trading day of May. The third line shows the results for a long-short system using the six-month cycle. Instead of selling on the first trading day of May, the system shorts the index and then covers on the first trading day of November.
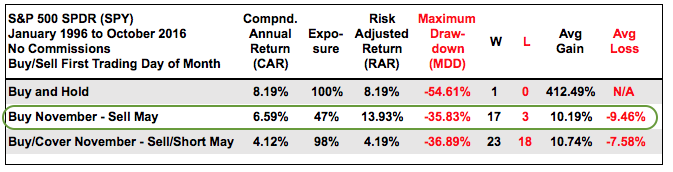
Buy-and-hold had a Compound Annual Return (CAR) of 8.19% and a Maximum Drawdown of -54.61% (thanks to the 2008 plunge). The CAR for the Best Six Months switching strategy was less than buy-and-hold, but it beat buy-and-hold for the Risk-adjusted Return and the Maximum Drawdown (MDD) was lower. Even so, the MDD of -35.83% is unacceptable. As is the case with most long-term systems, the numbers were worse when short positions were added.
Tweaking the Cycle to Account for Seasonality
The seasonality chart above showed that October was one of the strongest months because it closed higher 65% of the time over the last 20 years, which ties it for fourth place. Using this information, I re-ran the backtest with a buy on the first trading day of October and a sell on the first trading day of May. We can all this the Adjusted Seasonal Strategy As the table below shows, the Compound Annual Return was more than 2% higher, but the Maximum Drawdown was still high (-46.78%) because of the 2008 plunge. There were still 17 winning trades and just 3 losing trades for a Win Percent of 85%.
Add Market Timing with weekly MACD
The late Sy Harding added a MACD timing element to the seasonal strategy and also started the bullish period in October. I am not sure if Harding used daily or weekly MACD, but I am going to use weekly MACD for more smoothing. The system will buy when the seasonal period is bullish (Oct-Apr) and weekly MACD is above its signal line. The system will sell when the seasonal period is bearish (May to Sep) and weekly MACD is below its signal line. The table below compares the results with the adjusted seasonal strategy.
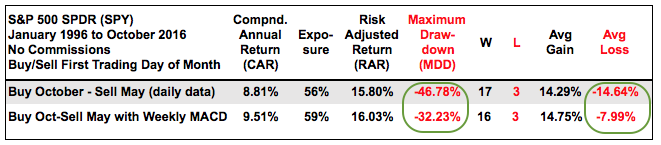
Adding a MACD timing filter improved the Compound Annual Return, the Maximum Drawdown and the Average Loss. The improvement in CAR was incremental, but the MDD was cut by 1/3 and the Average Loss was cut in half. Reducing drawdowns and losses is just as important as improving returns - in my humble opinion.
SPY, MACD and Seasonality Now
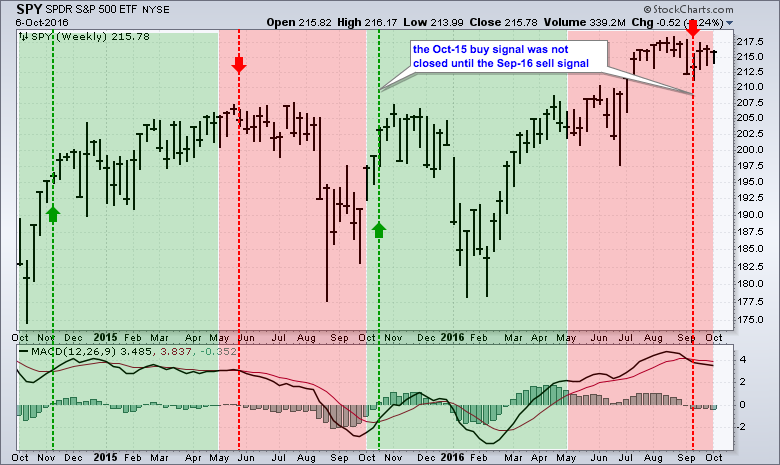
The chart below shows SPY over the last two years with the bullish seasonal period in green (October to April) and the bearish seasonal period in red (May to September). The green and red dashed lines mark the bullish and bearish MACD signals during these periods. Notice that the bullish signal in October 2015 was not reversed until the bearish signal four weeks ago. This means a system trader would have remained long during the January swoon. This may not seem practical from a trading point of view, but it is the nature of a trading system. It is important to take all signals and follow the system - no exceptions. Cherry picking the signals will not work. Having said that, traders exiting after the January plunge would have re-entered when MACD crossed above its signal line in late February.
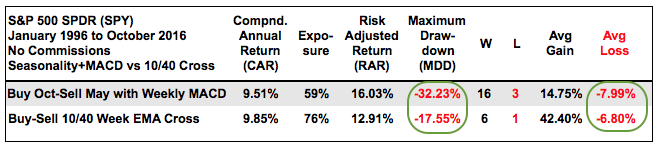
Tough to Beat EMA Crossover System
While Adjusted Seasonality with MACD timing looks interesting, I think the bigger trend and basic chart analysis are more important - far more important. In fact, it is pretty hard to beat a 10/40 week EMA crossover system for the S&P 500 (and SPY by extension). This EMA pair is similar to the 50-day EMA and 200-day EMA. As the table below shows, buying when the 10-week EMA crosses above the 40-week EMA produced a similar Compound Annual Return with half the Maximum Drawdown (-17.55%). Moreover, there were just seven trades with six winners and one loser. The loser occurred from November 2015 to January 2016. It is not a perfect system, but the long-term results are good enough and this system can help preserve capital during bear markets.
Final Thoughts as Q4 Hits
Even though weekly MACD moved below its signal line in September, I think the broad market trend is up and this favors further gains as we move into the bullish seasonal period. SPY is currently consolidating above the recent breakout and the 10-week EMA is above the 40-week EMA. A close below 208 would break the rising 40-week EMA and suggest a breakout failure. I would then re-evaluate my bullish stance.
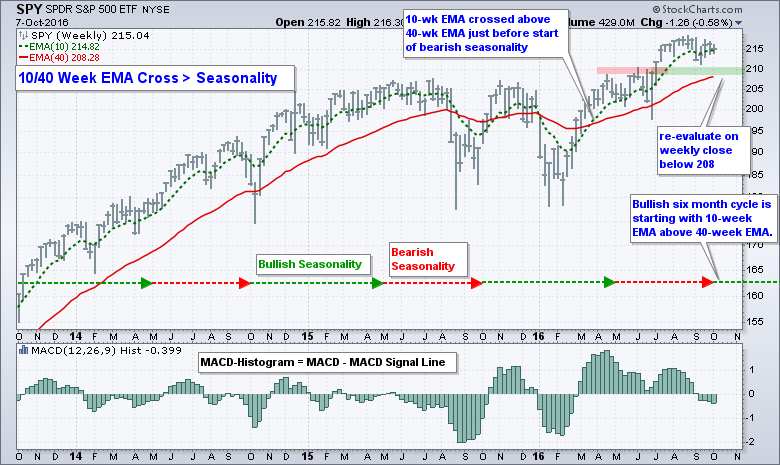
The indicator window shows the MACD Histogram, which plots the difference between MACD and its signal line. The histogram is positive when MACD is above its signal line and negative when below. The bearish signal line crossover occurred four weeks ago and the MACD Histogram has been negative the last four bars. A move into positive territory would trigger a bullish signal during the bullish seasonal period. This would also be a bullish signal the historically strong fourth quarter.
Credits
These trading strategies were tested using Amibroker with the help of Cesar Alvarez of AlvarezQuantTrading.com. For more information about his testing and consulting services, click here.

******************************************************
Other Articles in the SystemTrader Series:
- Introduction to Key Performance Metrics - Quantifying the Golden Cross for the S&P 500
- Golden Cross and 5 Major Indexes - EMAs versus SMAs - Do Short Positions Add Value?
- Short-term Moving Average Crosses - Differences in Major Indexes - Do Trend Filters Work?
- MACD Crosses - Rules to Reduce Drawdowns and Increase Gains - Testing PPO Strategy
Follow me on Twitter @arthurhill - Keep up with my 140 character commentaries.
******************************************************
Thanks for tuning in and have a good day!
--Arthur Hill CMT
Plan your Trade and Trade your Plan
******************************************************


