Nowhere is not Necessarily Bearish .... Consumer Discretionary Shows Relative Strength .... Five Key Risk Ratios Remain Bullish .... Breadth Indicators Soften During Correction .... Mean-reverting with Breadth Indicators .... SPY Holds Mean-Reversion Bounce .... QQQ Continues to Lead .... IWM Tests Big Support Zone .... //// ....
Nowhere is not Necessarily Bearish
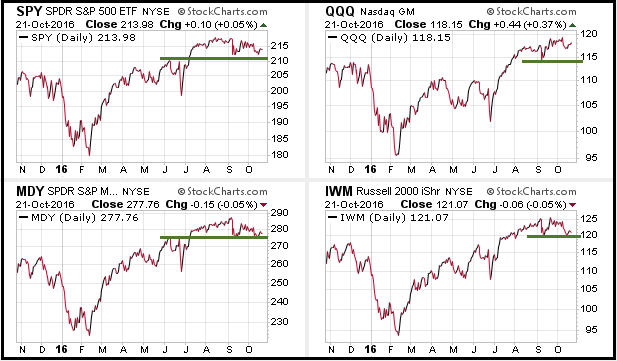
The S&P 500 has gone nowhere since mid July, but this is not necessarily a bad thing. First, note that SPY hit a 52-week high in August, IWM and MDY hit 52-week highs in September, and QQQ hit a 52-week high in October. All three remain above their mid September lows and the bigger trends are clearly up. A little sideways price action within a bigger uptrend seems perfectly normal to me. Even though a top could ultimately form here, we have yet to see significant support breaks on the price charts and the breadth indicators remain on bull signals. Bottom Line: the trend is in force until proven otherwise and the bears have yet to prove the bulls wrong.
Consumer Discretionary Shows Relative Strength
The PerfChart below shows why the S&P 500 has been flat since mid July. Finance, technology and energy are up and leading, but the other six sectors are down. Even though six sectors are down, notice that consumer discretionary (cyclicals) is down the least of the six and showing some relative strength. Also notice that healthcare, consumer staples and utilities are the weakest and these are traditionally the defensive sectors. Seems that the offense is working better than the defense right now and this is net positive for stocks.

Five Key Risk Ratios Remain Bullish
The chart below shows five risk ratios designed to measure the risk appetite in the stock market. The first three compare small-caps, mid-caps and equal-weights to the S&P 500 (large-caps). The risk appetite is strong when the ratios rise, which means they are outperforming the S&P 500. The greened dashed lines define a long rise in these three ratios and the red lines mark a smaller decline over the last 1-3 months. These are NOT trend lines to mark support or resistance. Instead, they are just there to define the directional move. Despite the recent declines, these ratios have yet to break below key lows marked by the green zones. A move below these green zones would reverse the larger uptrends and suggest a move to risk aversion within the stock market.
 The last two ratios use Treasury bonds to measure the risk appetite. The 7-10 YR T-Bond ETF (IEF) represent the safe-haven asset (denominator) so these ratios rise when money is moving out of safe-haven assets (and into riskier assets). The SPY:IEF ratio flattened over the last three months, but has yet to reverse its uptrend. The JNK:IEF ratio moved to new highs in October and this shows a strong risk appetite within the bond market.
Breadth Indicators Soften During Correction
The next chart shows the S&P 1500 with three breadth indicators. The 10-day EMA of AD Percent triggered a bullish breadth thrust on March 3rd. High-Low Percent and the %Above 200-day EMA followed on March 31st. Note that S&P 1500 %Above 200-day is a user-defined index I created using data from !GT200SPX, !GT200MID and !GT200SML. Even though these breadth indicators have weakened in September-October, they have yet to generate bearish signals and this means the bullish signals remain active. The S&P 500 has moved sideways the last three months and this represents a correction of sorts. Breadth indicators are supposed to weaken during a correction so this is normal. It is beyond normal when these breadth indicators break below their bearish thresholds and trigger bearish signals. Such moves would point to a significant increase in downside participation and I would then change my stance on the broader market environment. In short, I am bullish until these indicators show a significant increase in selling pressure that would warrant a bearish stance.

Mean-reverting with Breadth Indicators
Mean-reversion is my preferred method of short-term trading. This means I define the bigger trend and look for short-term counter-trend moves. The idea is that short-term pullbacks will revert back to the mean of the bigger uptrend. A mean-reversion strategy can be applied to breadth indicators for broad market timing. The breadth indicators above imply that the broad market environment is bullish. This means I can use short-term breadth indicators to look for short-term oversold conditions. The chart below shows the %Above 20-day EMA for four major indexes. A move below 30% triggers a short-term oversold signal and this occurred the second week of October. The indicators bounced last week and this means they are in the midst of an oversold bounce. In other words, the short-term trend is turning up.

SPY Holds Mean-Reversion Bounce
Mean-reversion systems can seem at odds with what is happening on the chart because sharp declines lead to short-term oversold conditions. This is the nature of the beast. The mean-reversion strategy looks for bullish setups when the 50-day EMA is above the 200-day EMA and ignores bearish setups. Actually, I think this is a good rule in general. Do not consider short-term bearish setups or trades when the bigger trend is up. A mean-reversion system would go long when a short-term momentum indicator becomes oversold, such as RSI(5) dipping below 30. The green arrows show the last four completed trades and the current signal, which triggered on October 17th. An exit signal will trigger when RSI(5) moves above 70 or a stop-loss is triggered (fielder's choice).
 Turning to the price chart, the gray dashed lines define the correction over the last three months. A break from this channel would signal an end to the correction and resumption of the bigger uptrend. Within the channel, I am focused on the rising wedge and Friday's low (112.76). A close below this level would break wedge support and signal a continuation of the mid October decline. This level could be used as a stop-loss on short-term trades. While a close below 12.76 would be negative, it would likely lead to the next bullish setup when the short-term momentum indicators become oversold.
QQQ Continues to Lead
It is a big week for QQQ because Apple, Alphabet and Amazon report this week. We are currently in the middle of earnings season so there are several other Nasdaq 100 stocks reporting as well. This means short-term trading could be choppy. The overall trend for QQQ is up and I am watching the small rising wedge for the first signs of small breakdown that could lead to a pullback. A close below 117 would break wedge support and could be used for short-term stops.

IWM Tests Big Support Zone
IWM opened weak, but closed strong to stave off a flag support break. This is why I use closing prices for signals. A close below 120 would break flag support and be short-term bearish. Even so, I would not use such a break to trade a decline because the broad market environment remains bullish. Instead, a break could be used for stops. RSI(5) became oversold in mid October to trigger a short-term bullish mean-reversion signal. Look for a break above 122 to trigger a signal on the price chart.
 ******************************************************
Measuring Risk On-Risk Off - Using charts to quantify stock, economic and credit risk.
PPO Trading Strategy - How to use 3 PPOs to develop a trend-reversion trading strategy.
Long-term Trend Indicators - Using the PPO, EMA Slope and CCI to determine the trend.
ETF Master ChartPack - 300+ ETFs organized in a Master ChartList and in individual groups.
Follow me on Twitter @arthurhill - Keep up with my 140 character commentaries.
****************************************
Thanks for tuning in and have a good day!
--Arthur Hill CMT
Plan your Trade and Trade your Plan
*****************************************


