Quantifying the Reaction to Earnings .... Scan Code for Big Movers .... Low Volume and JETS .... Apple Dwarfs the Entire Airline Group .... Using PerfCharts to Compare Airlines Performance .... Using RRGs to Measure Relative Performance for Airlines .... Emerging Markets Continue to Outperform .... //// ....
Quantifying the Reaction to Earnings
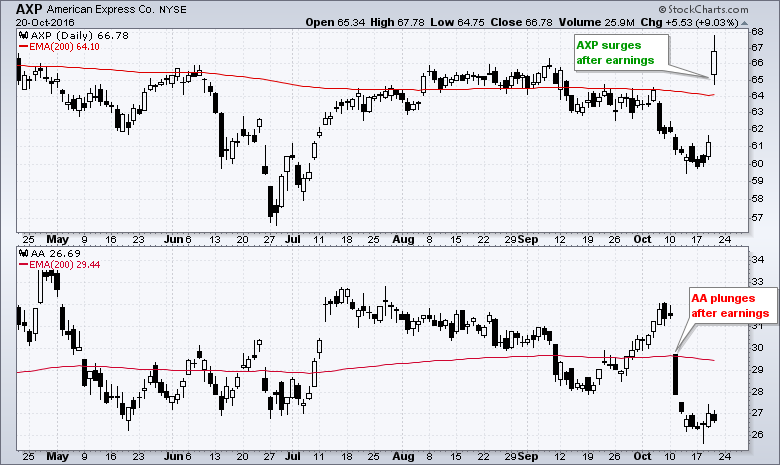
I was trying to get an idea of how stocks are reacting to earnings so I developed a scan looking for stocks that made significant moves over the last eight trading days. Earnings season kicked off eight days ago with Alcoa (AA) and its big miss on October 10th. The scan looks for stocks in the S&P 500 with a 1-day Rate-of-Change greater than 5% or less than -5%. While not all big movers are earnings related, this scan helps set the tone during earnings season.
The table below sums up the results for S&P 500 stocks:
- 13 with ROC(1) > +5% over last 8 days
- 14 with ROC(1) < -5% over last 8 days
SPY is down around 1% during this timeframe, 13 stocks experienced a pop greater than 5% during earnings season and 14 stocks experienced a plunge greater than 5%. Negative reactions are edging out positive reactions by 1 so the game remains close. Keep in mind that were are still in the middle of earnings season and there are many more reports to come. Taken together, it looks like earnings season is mixed right now and fitting for a market that has been flat for three months.
Scan Code for Big Movers
Here is the scan code looking for big declines or stocks that fell more than 5% in two days over the last eight days. This code focuses on the S&P 500 [group is SP500] and ignores the other three indexes because of the forward slashes at the front of the phrases.
Stocks Surging over 5%
[group is SP500]
// [group is SP400] // precede with 2 forward slashes to ignore a line
// [group is SP600]
// [group is NASDAQ100]
and [[ROC(1) < -5.0]
or [1 days ago ROC(1) < -5.0]
or [2 days ago ROC(1) < -5.0]
or [3 days ago ROC(1) < -5.0]
or [4 days ago ROC(1) < -5.0]
or [5 days ago ROC(1) < -5.0]
or [6 days ago ROC(1) < -5.0]
or [7 days ago ROC(1) < -5.0]]
A Better Way to Scan
The scan code above is clunky and there is a much easier way to write this using the "Max" function. The code below accomplishes the same results with just one line. This line returns stocks when the maximum value of the 1-day Rate-of-Change is greater than 5% over the last eight days.
[group is SP500]
and [Max(8,ROC(1)) > 5]
We can use the "Min" function to find the big decliners. Here is this same scan looking for stocks with a 1-day Rate-of-Change that is less than -5% over the last eight days.
[group is SP500]
and [Min(8,ROC(1)) < -5]
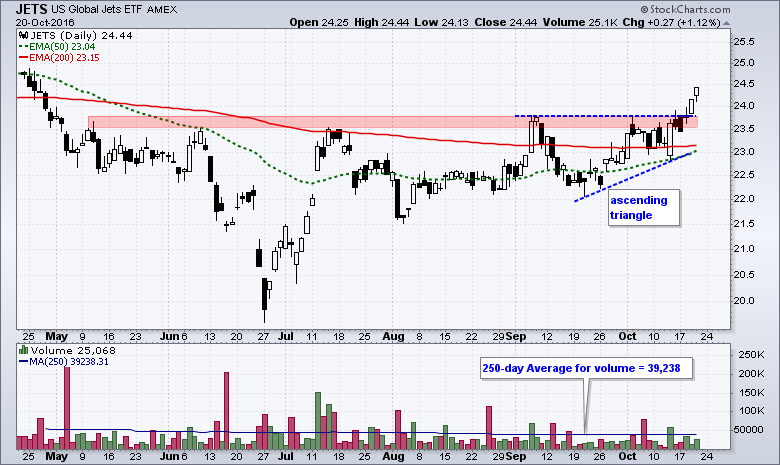
Low Volume and JETS
Question: Does low volume concern you with the Airline ETF (JETS)?
Short Answer: Low volume is an issue from a trading or investing standpoint. This means I would not want to trade or invest 1000 shares. However, JETS averages 38,000 shares per day and I do not think it is an issue for 100 shares. This is information, NOT advice!
Apple Dwarfs the Entire Airline Group
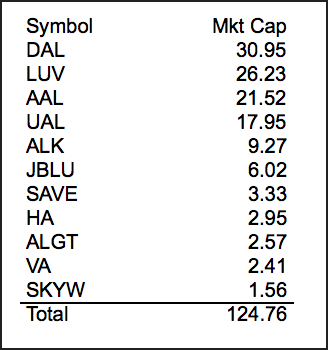
Long Answer: The JETS ETF includes the US-based carriers, several international carriers and a few stocks associated with aircraft manufacturing, such as Boeing and General Dynamics. The table below shows 11 US-based carriers and their market cap. Notice that the total market cap is just $125 billion. For comparison, Boeing has a market cap of $85 billion, General Dynamics tips the scales at $224 billion and Apple is a whopping $630 billion. Nevertheless, the 11 US-based airlines shown below account for 75% of the Airline ETF (JETS).
Using PerfCharts to Compare Performance
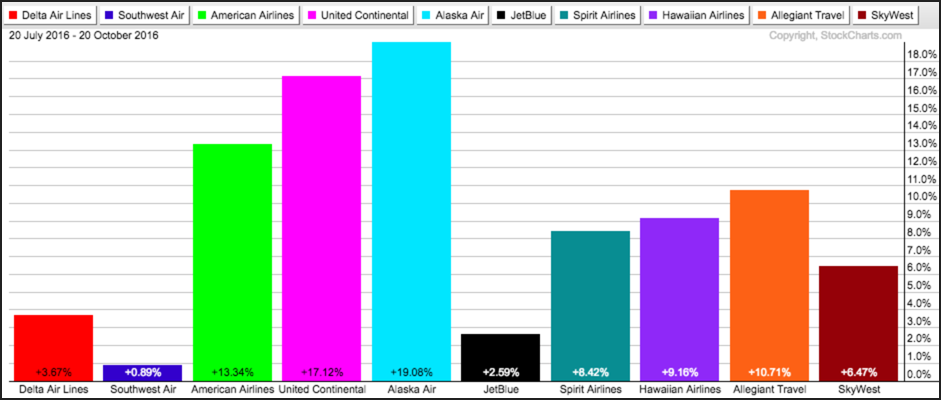
Chartists focusing on a particular group of stocks can compare performance using our Performance Charts. The PerfChart below shows 3-month performance for the top ten stocks in JETS - and the top ten US-based carriers. I did not include Virgin America (VA) because there is a merger-acquisition underway with Alaska Airlines (ALK). All ten are up with AAL, UAL and ALK leading the way.
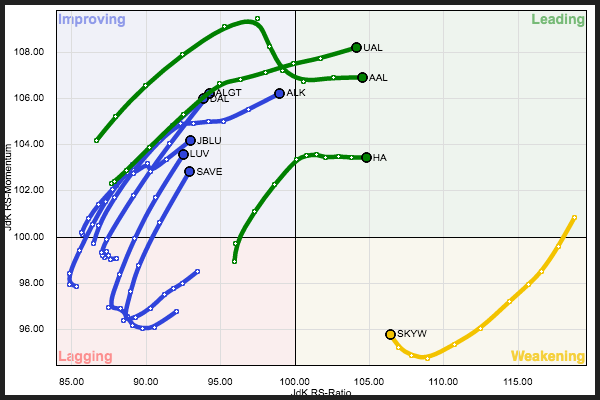
Using RRGs to Measure Relative Performance
Chartists looking to gauge relative performance for a group of stocks can use Relative Rotation Graphs (RRG). The RRG below shows UAL, AAL and HA in the leading quadrant (relative strength). Notice that the blue lines in the improving quadrant are rising to the right - which means they are on course for a move into the leading quadrant. Overall, it looks like airlines are in favor right now.
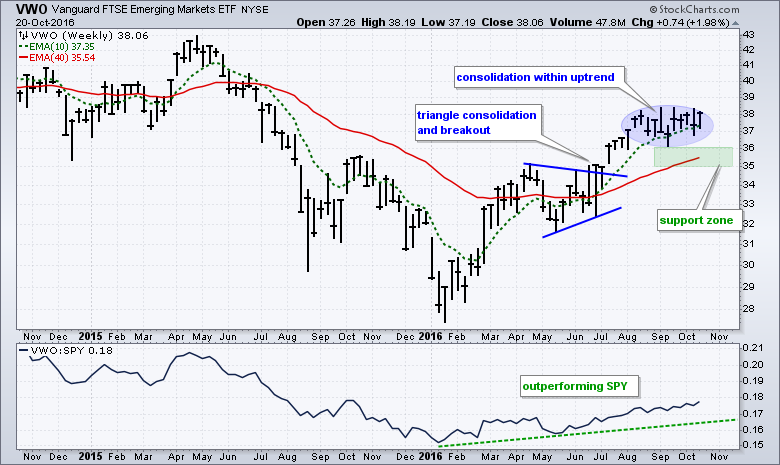
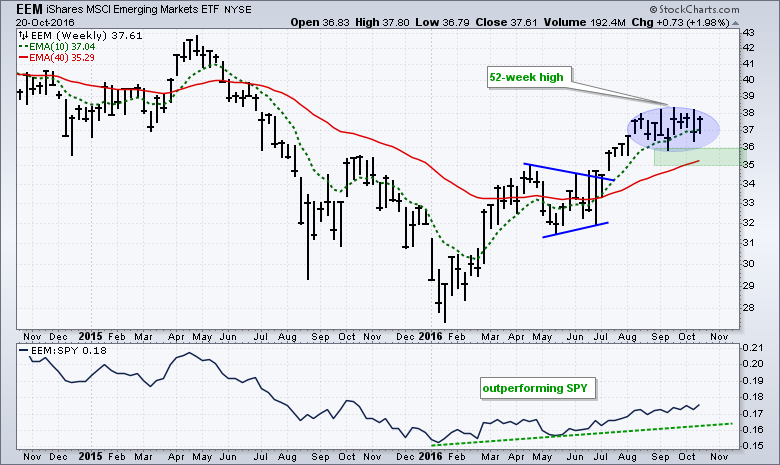
Emerging Markets Continue to Outperform
Chartists can analyze emerging markets using the Emerging Markets ETF (EEM) or the Vanguard Emerging Markets ETF (VWO). Both are very liquid and both track emerging market stocks quite well. VWO might have a slight performance edge because of lower fees. The chart below shows VWO moving higher since mid January and hitting a 52-week high in September. The ETF has moved sideways the last 2-3 months and this looks like a consolidation within an uptrend. Even though I cannot draw a perfect triangle, flag or wedge, this sideways price action is indicative of a rest within the trend. This means I expect an upside breakout and continuation. The rising 40-week EMA, September low and a buffer mark long-term support (green zone).
******************************************************
Measuring Risk On-Risk Off - Using charts to quantify stock, economic and credit risk.
PPO Trading Strategy - How to use 3 PPOs to develop a trend-reversion trading strategy.
Long-term Trend Indicators - Using the PPO, EMA Slope and CCI to determine the trend.
ETF Master ChartPack - 300+ ETFs organized in a Master ChartList and in individual groups.
Follow me on Twitter @arthurhill - Keep up with my 140 character commentaries.
****************************************
Thanks for tuning in and have a good day!
--Arthur Hill CMT
Plan your Trade and Trade your Plan
*****************************************


