QQQ Leads the Big 3 .... SPY Forms Small Wedge .... Finance and Tech Power IWM .... Changing to Vanguard Finance ETF .... Groups Going Off the Radar .... Still Watching Retail and Housing .... Steel Stocks Propel Metals & Mining SPDR .... Airline ETF Gets Two Breakouts .... //// ....
QQQ Leads the Big 3
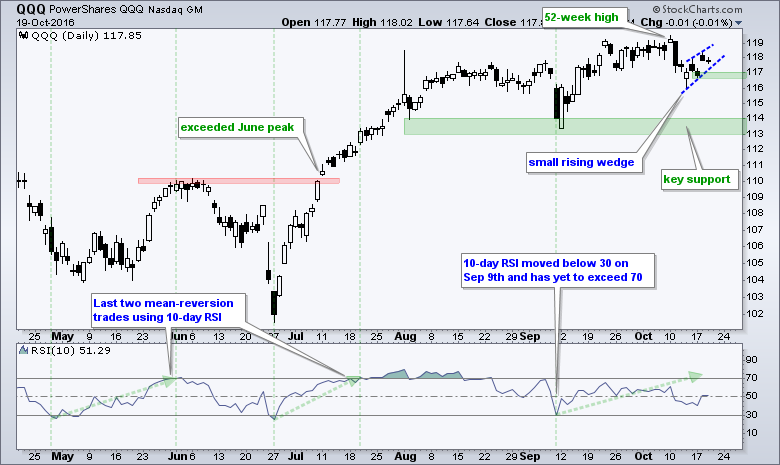
QQQ continues to lead the broader market with a 52-week high just eight days ago. We do not need indicators to figure out that the long-term trend is up when a stock or ETF hits a 52-week high. Short-term, the ETF fell sharply after this 52-week high with a move below 117 and then formed a rising wedge the last five days. The short-term trend is up as long as the wedge rises so I will be watching 116.50 for a break that would reverse this wedge. Keep in mind that such a move would NOT affect the long-term uptrend. It is just a short-term pattern to watch.
SPY Forms Small Wedge
The long-term trend for SPY remains up because the 50-day EMA is above the 200-day EMA and SPY remains well above the rising 200-day EMA. This means the decline since late August is viewed as a correction within an uptrend. The gray trend lines define a falling channel and the solid blue lines show a triangle, which was broken. SPY bounced after this break with a rising wedge and I am marking wedge support at 213. A close below 213 would break wedge support and argue for more short-term weakness.

Finance and Tech Power IWM
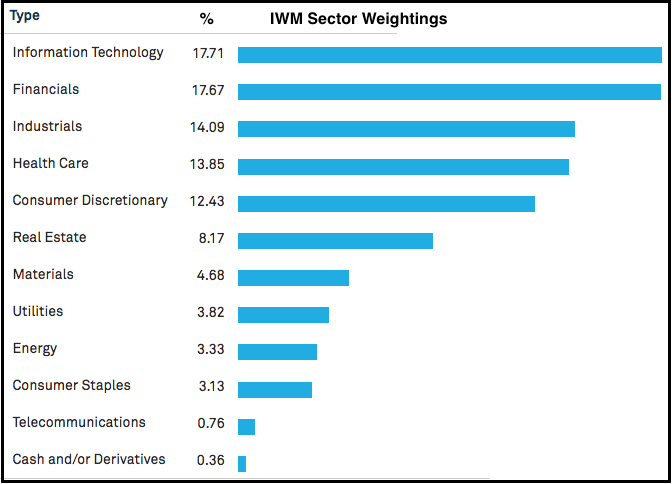
IWM remains at a most interesting juncture. The broad market environment is bullish, IWM is at support and financials are leading. Note that the financials sector accounts for 17.67% of IWM. This used to be higher, but REITs have been removed and this group accounts for 8.17% of the ETF. Information Technology is the biggest sector at 17.71%. Together, finance and technology account for around 35% of IWM and these are the strongest sectors right now.
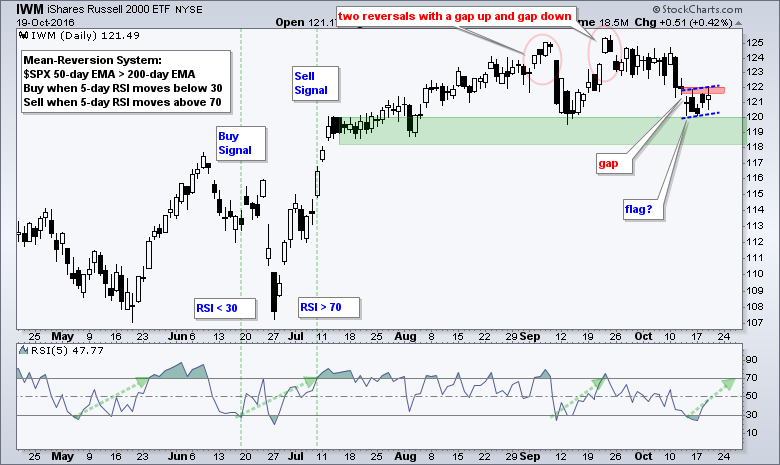
On the price chart, IWM gapped down and RSI(5) became oversold for a mean-reversion setup last week. The ETF firmed after this gap and I am watching 122 for a short-term breakout. As with SPY and QQQ, my short-term concern is with the rising flag and a break below 122 would be short-term bearish.
Changing to Vanguard Finance ETF
Today I am going to look at the Vanguard Financials ETF (VFH) instead of the Finance SPDR (XLF). XLF is going through a transition and I want to keep the analysis clean. VFH represents the big financial institutions with the top ten stocks accounting for 42.4% of the ETF. There are no REITs - except for a few mortgage REITs (1.9% of portfolio). I would suggest VNQ or IYR for REITs as a separate sector. I am mostly interested in banks, brokers and insurance stocks when looking at the finance sector and VFH captures these groups quite well.
First and foremost, the chart below shows VFH in a long-term uptrend. The ETF hit a 52-week high in late August, the 50-day EMA is above the 200-day EMA and the ETF is above the rising 200-day EMA. VFH corrected in September with a falling flag and broke flag resistance with a surge in early October. There was some backing and filling after the breakout, but the breakout has largely held and I remain bullish on finance (sans REITs). The second chart shows the Regional Bank SPDR (KRE) with similar characteristics.


Groups Going Off the Radar
Several groups are off my bullish radar right now. I am not looking at REITs and Utilities because the 10-yr T-Yield ($TNX) remains in an uptrend and these groups are negatively correlated to Treasury yields. I would also put consumer staples and telecom in this group. Also notice that gold and the Euro are down over the last three months. I am not looking at healthcare or biotechs because of the election overhang. I am also avoiding individual stock analysis right now because we are right in the middle of earnings season.

Still Watching Retail and Housing
Retail remains one of the weakest groups in 2016 and housing is one of the weakest groups over the last three months. These two are weighing on the consumer discretionary sector and I continue to watch these two closely. The broader market may continue to limp higher as long as these two trend lower. On the other side, the market could accelerate higher if these two turn around and breakout to the upside. The charts below show the key levels to watch for the ETF and the price relative.


Steel Stocks Propel Metals & Mining SPDR
The Steel ETF (SLX) is one of the strongest industry group ETFs this year with a 50+ percent gain so far in 2016. The ETF clearly has momentum and relative strength on its side. On the price chart, the 50-day EMA is above the 200-day EMA, price is above the 200-day EMA and SLX hit a 52-week high in August. More recently, the ETF corrected from August to September and ended this correction with a breakout in late September. Short-term support is set at 30 and long-term support at 28. Steel stocks account for 51% of the Metals & Mining SPDR (XME) and I am watching this one for a possible breakout.


Airline ETF Gets Two Breakouts
Even though the Airline ETF (JETS) has low volume and is not great for trading, there is valuable information in the price action. Namely, airline stocks show strength as a group and chartists should be looking at individual leaders. On the price chart, JETS broke above its May-June-July peaks with a surge in early September and then pulled back rather sharply. JETS managed to firm in the 22-22.5 area and then surged above the September high. The indicator window shows the price relative (JETS:SPY ratio) breaking above its July high as the ETF starts to outperform.

******************************************************
Measuring Risk On-Risk Off - Using charts to quantify stock, economic and credit risk.
PPO Trading Strategy - How to use 3 PPOs to develop a trend-reversion trading strategy.
Long-term Trend Indicators - Using the PPO, EMA Slope and CCI to determine the trend.
ETF Master ChartPack - 300+ ETFs organized in a Master ChartList and in individual groups.
Follow me on Twitter @arthurhill - Keep up with my 140 character commentaries.
****************************************
Thanks for tuning in and have a good day!
--Arthur Hill CMT
Plan your Trade and Trade your Plan
*****************************************


