Webinar Video Link .... Art's Charts ChartList Link .... Weighing the Balance of Power for the Market Sectors .... XLY Surges off 200-day EMA .... XLI Could Tilt the Balance of Power .... Falling Wedges for Retail and Housing ETFs .... Software iShares Nears New High .... Staples, Utilities and REITs Tests their 200-day EMAs .... 10-yr Yield Challenges 200-day EMA .... Gold Forms Bearish Wedge ...; //// ....
Weighing the Balance of Power for the Market Sectors
The finance, technology and energy sectors kept the market afloat over the last few months because consumer discretionary, industrials, consumer staples and healthcare weakened. The first three sectors account for around 44% of the S&P 500, while the latter four account for around 47%. I am not watching utilities, REITs and materials that closely because these three account for around 9% of the S&P 500 (~3% each). The balance of power in the big seven holds the key. Breakdowns in finance and/or technology would clearly tilt the market bearish. Conversely, upside breakouts in industrials and/or consumer discretionary would tilt the market bullish. With this in mind, I will be running through the sector charts for clues on trends and possible breaks.
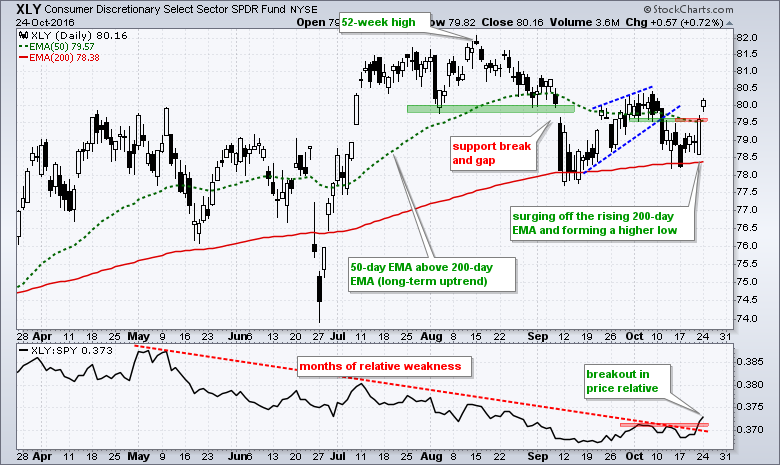
XLY Surges off 200-day EMA
XLY caught a big bid over the last two days and surged off the rising 200-day EMA. The ETF formed a big bullish engulfing on Friday and gapped above the wedge break on Monday. This negates the wedge break on 11-Oct and puts the bulls back in control of the short-term trend. The bulls are also in control of the long-term trend because the 50-day EMA is above the 200-day EMA and the ETF hit a new high in August.
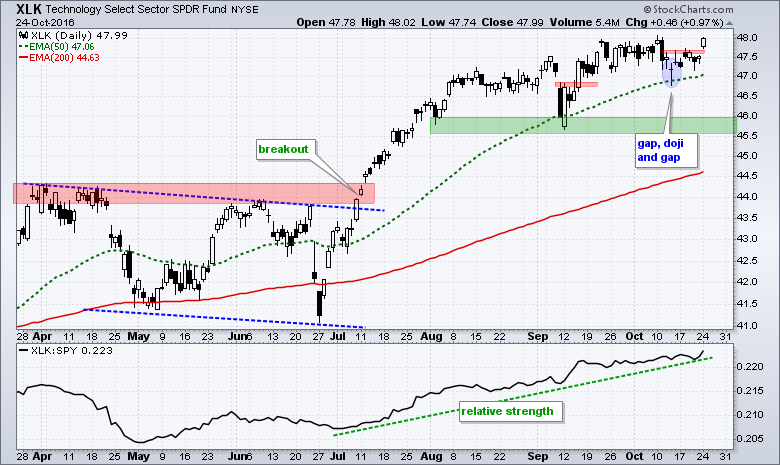
XLK remains in a strong uptrend and continues to lead because it is the closest to a 52-week high. Also notice that the price relative (XLK:SPY ratio) hit a new high. On the price chart, XLK followed through to the gap-doji-gap reversal with a gap and small breakout.
XLF seems to be struggling, but the ETF remains above the flag breakout zone and remains one of the sector leaders. The green zone marks first support to watch in the 19.2-19.4 area. Notice that the price relative (XLF:SPY ratio) turned up this month and moved higher (relative strength). 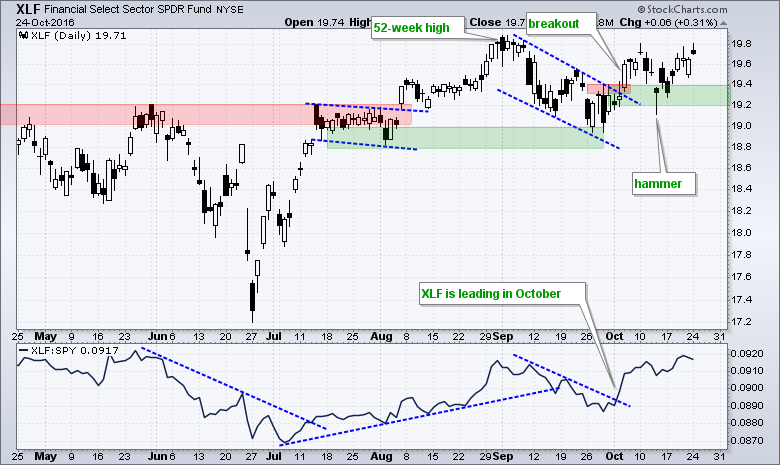
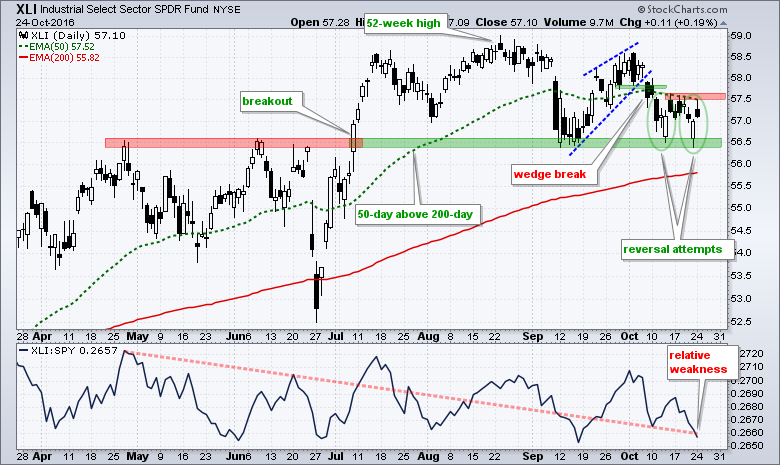
XLI Could Tilt the Balance of Power
XLI continues to struggle and underperform the broader market. Based on broken resistance and the Sept-Oct lows, I can make the case for support in the 56.5 area. XLI also attempted two short-term reversals in the last two weeks. The green ovals mark declines, white candlesticks and bounces that occurred over two four-day periods. Now we need to see follow through and a breakout at 57.7 to confirm the reversal attempts. Failure to break out and a downside break at 56.4 would be quite negative for the broader market.
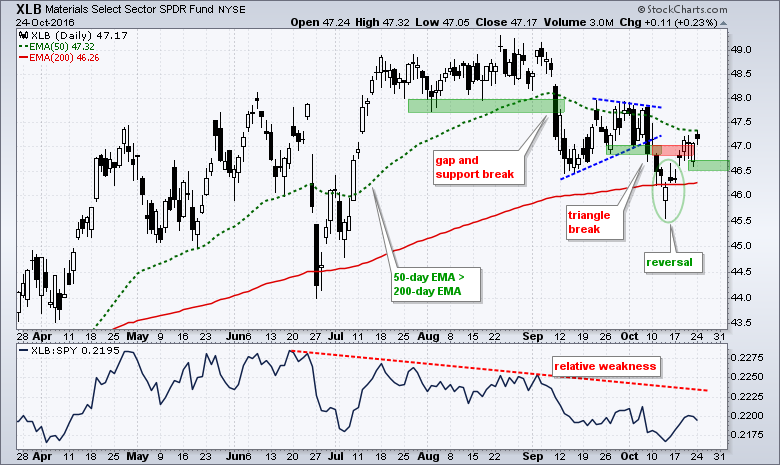
XLB continues to underperform overall, but the ETF reversed near the 200-day EMA for the second time in four months. The first reversal occurred when XLB closed below the 200-day EMA on June 27th. The second occurred with a gap below the 200-day EMA on October 13th, an intraday reversal and a gap back above the 200-day EMA on October 14th. XLB followed through with another gap last week and I will mark short-term support at 46.50.
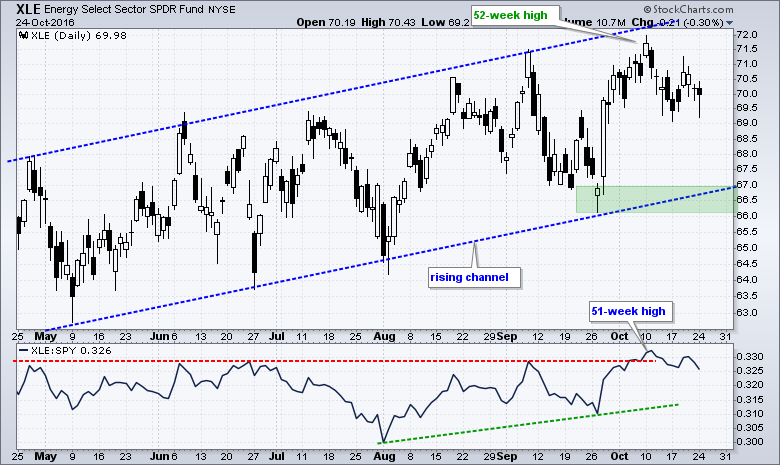
 XLE fell back over the last two weeks, but remains in a long-term uptrend and continues to lead the market. The price chart sports a rising channel and XLE is currently in the middle of this channel.
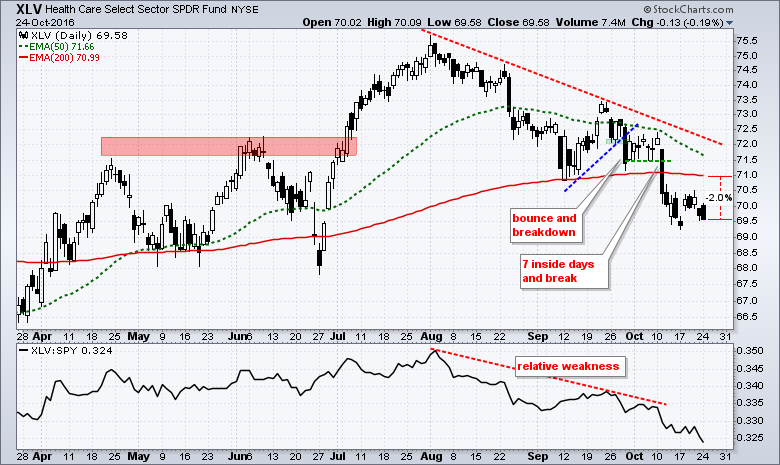
XLV is the weakest of the nine sectors because its price relative (XLV:SPY ratio) hit a new low on Monday and it is 2% below its 200-day EMA.
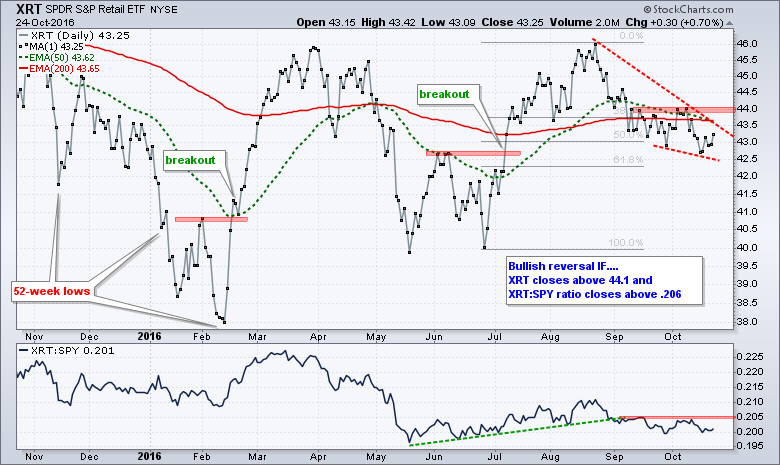
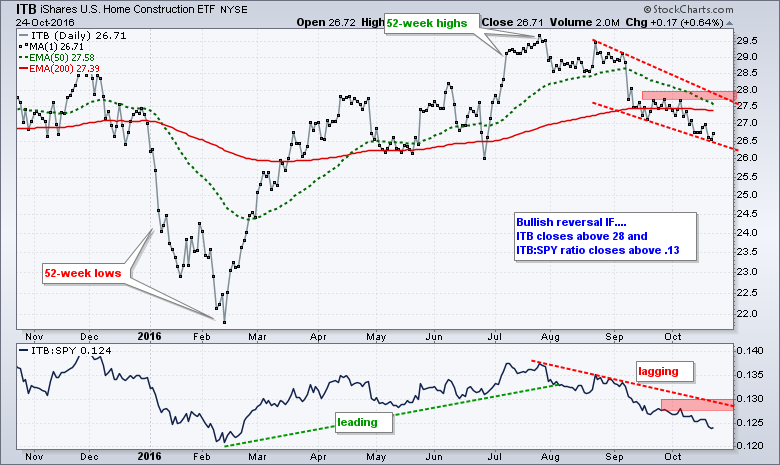
Falling Wedges for Retail and Housing ETFs
Even though XLY surged the last two days, I am watching the Home Construction iShares (ITB) and the Retail SPDR (XRT) for real clues on the consumer discretionary sector. Both remain in downtrends defined by falling wedge patterns, which could be corrections after the prior advances. Nevertheless, the immediate trends are down as long as these wedges fall. Look for breaks above the red resistance zones to reverse these downtrends.
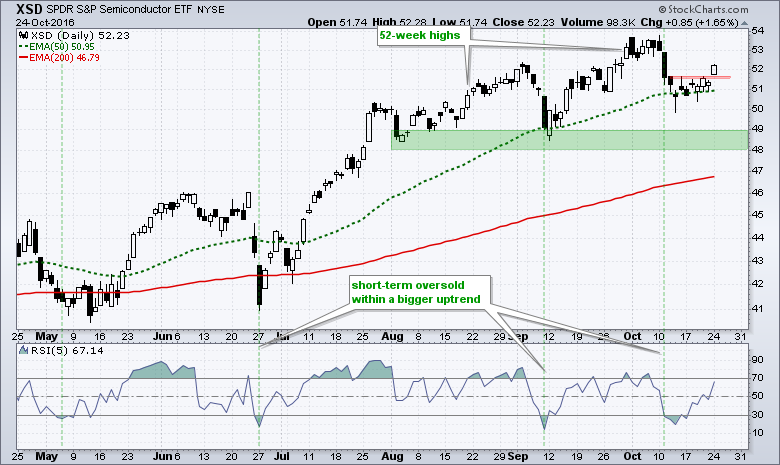
Software iShares Nears New High
There is clearly a lot of strength in the technology sector with QQQ, the Internet ETF (FDN) and the Cloud Computing ETF (SKYY) hitting new highs on Monday. The first chart below shows the Software iShares (IGV) bouncing off the September low and surging towards a new high on Monday. The second chart shows the Semiconductor SPDR (XSD) holding above its September low after the early October dip and gapping above first resistance on Monday.

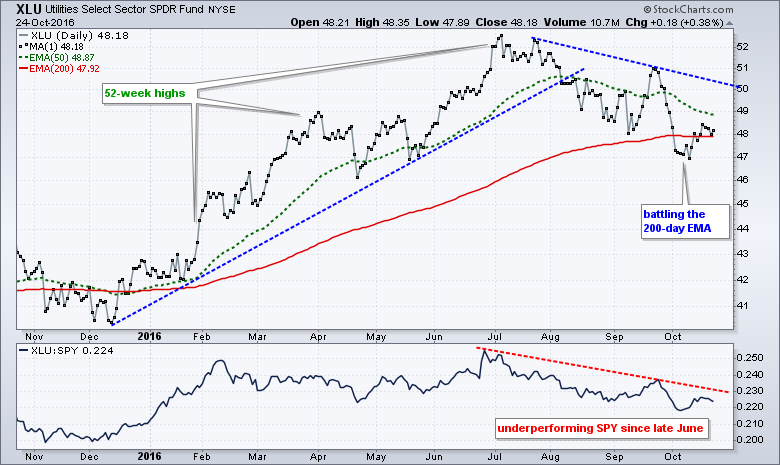
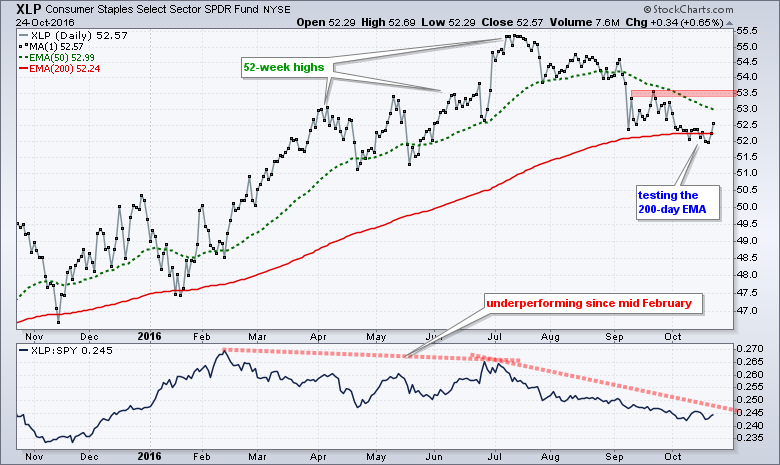
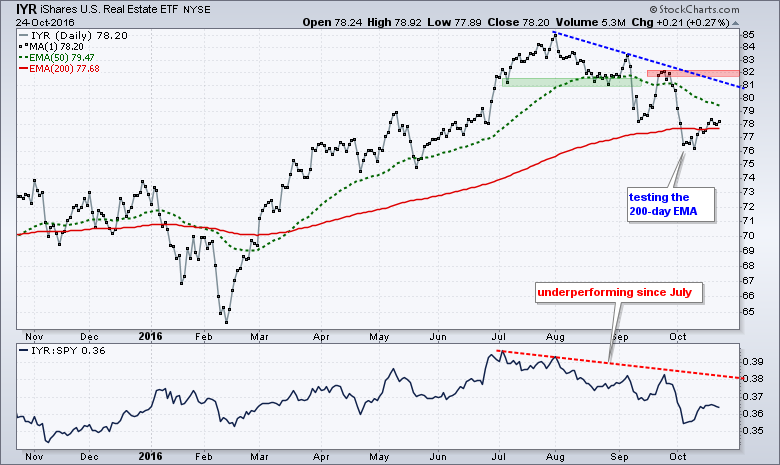
Staples, Utilities and REITs Tests their 200-day EMAs
We can see the effects of rising Treasury yields by looking at the consumer staples and utilities sectors, and REITs. These three are negatively correlated to the 10-yr T-Yield ($TNX) and all three fell sharply since July. Also note that all three are currently near their 200-day EMAs. Even though a test of the 200-day EMA could mark a turning point, I would not bank on it as long as the 10-yr is trending higher.
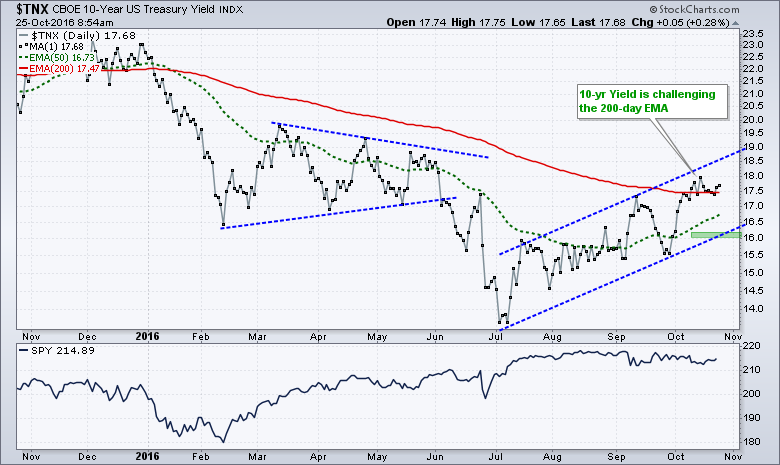
10-yr Yield Challenges 200-day EMA
In contrast to the three ETFs above, the 10-yr T-Yield bottomed in July and advanced to its 200-day EMA in October. $TNX seems to be making a bid to break above this EMA and continue the four month upswing. The blue trend lines mark a rising channel to define this advance and a close below 16 (1.6%) would break the channel trend line.
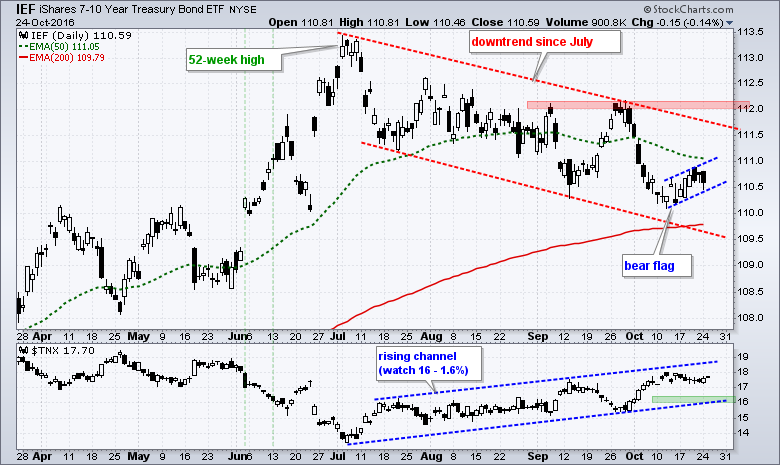
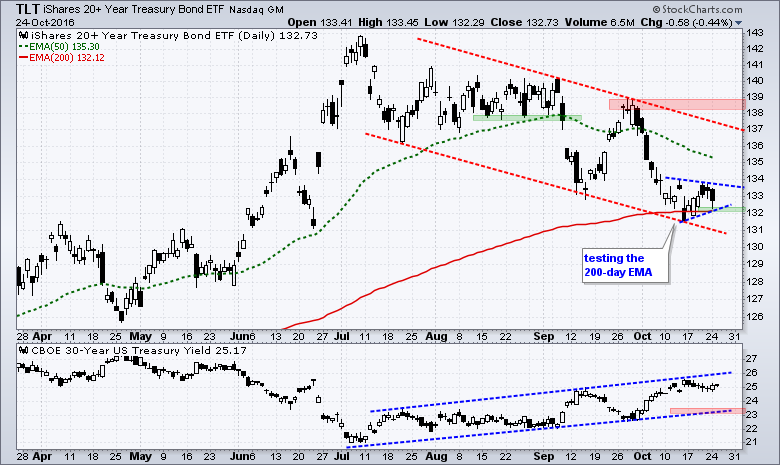
 The 7-10 YR T-Bond ETF (IEF) bounced over the last two weeks and formed a possible bear flag. The red trend lines define the downtrend since July with resistance marked around 112. IEF fell sharply in early October and then bounced with a rising flag taking shape. This looks like a bearish continuation pattern and a break below 110.4 would signal a continuation lower. The second chart shows the 20+ YR T-Bond ETF (TLT) with a pennant and a break below 132 would signal a continuation lower.
Gold Forms Bearish Wedge
Gold is also at the whim of the 10-yr yield and a bearish wedge is taking shape the last two weeks. First, notice that GLD is negatively correlated to the US Dollar ETF (UUP) and the 10-yr T-Yield. This means gold declines when they rise. The Dollar has been trending up since mid August and the 10-yr yield has been rising since July. These two are putting a lot of pressure on bullion. GLD broke down with a sharp decline in early October and became short-term oversold. The bounce over the last two weeks alleviated these oversold conditions and formed a bearish continuation pattern. A break below 120 would signal a continuation lower. 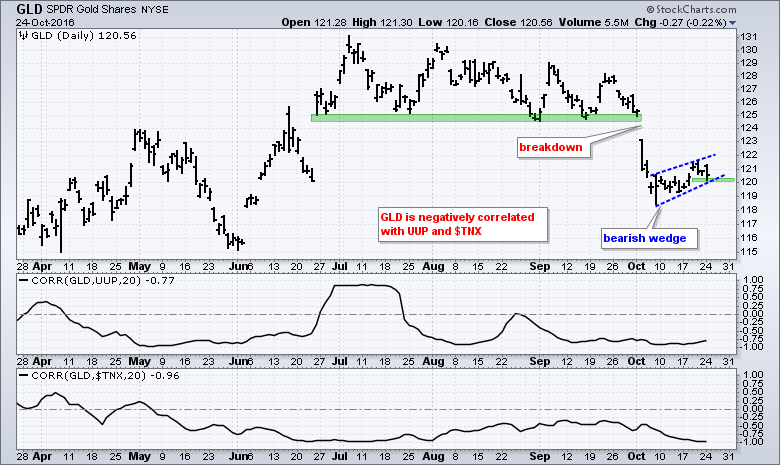
******************************************************
Measuring Risk On-Risk Off - Using charts to quantify stock, economic and credit risk.
PPO Trading Strategy - How to use 3 PPOs to develop a trend-reversion trading strategy.
Long-term Trend Indicators - Using the PPO, EMA Slope and CCI to determine the trend.
ETF Master ChartPack - 300+ ETFs organized in a Master ChartList and in individual groups.
Follow me on Twitter @arthurhill - Keep up with my 140 character commentaries.
****************************************
Thanks for tuning in and have a good day!
--Arthur Hill CMT
Plan your Trade and Trade your Plan
*****************************************


