Performance Discrepancies Abound in Key Industry Groups .... The Problem with Support Breaks in an Uptrend (SPY, QQQ) .... Pattern Trading versus Mean-Reversion Systems (IWM) .... Day of Divergence (Breadth) .... Industrials Versus Consumer Discretionary .... Bonds, Yields, Utilities and Gold .... //// ....
Performance Discrepancies Abound in Key Industry Groups
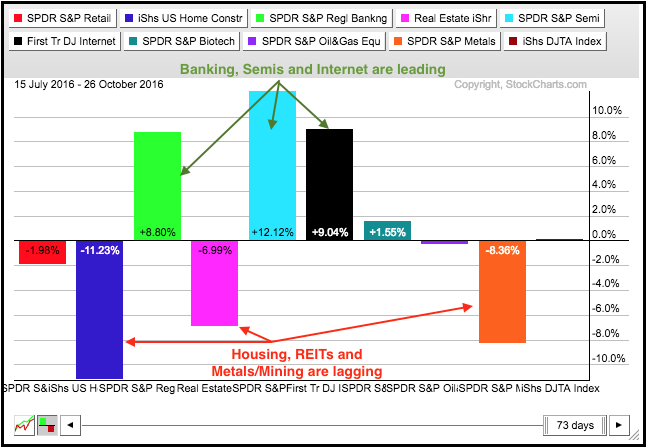
The stock market remains in a real funk. The Equal-Weight S&P 500 ETF (RSP) is down around 1% since mid July and has gone nowhere the last three months. Breaking it down, three equal-weight sectors are up and six are down. This mixed performance extends to the key industry group ETFs shown in the PerfChart below. Five are up and five are down. The Home Construction iShares (ITB) is down the most and the Semiconductor SPDR (XSD) is up the most. The broader market will come out of its funk when we see a more uniform performance from the sectors and industry groups. Upside breakouts in the Retail SPDR (XRT) and Metals & Mining SPDR (XME) would tilt the balance to the bulls. Downside breaks in the Semiconductor SPDR (XSD) and Regional Bank SPDR (KRE) would tilt the balance to the bears.
While nobody knows when the broader market will establish a clear direction, at least two uncertainties will become certain in the next two weeks and this could provide a catalyst. The election has been hanging over the market the last few months and we are into the final stretch. Earnings season is in swing and will wind down in early November. Clarity will not last long because the Fed is on hold and could make a move in early December. Thus, some of the air will clear in the next two weeks, but attention will then turn to the Fed - and likely to the new administration. There will ALWAYS be something out there creating uncertainty and this means uncertainty IS the only certainty. This why it is often best to ignore the news and focus on the charts.
The Problem with Support Breaks in an Uptrend
Acting on a short-term support break or bearish signal in an uptrend is often ineffective. The bigger uptrend is the dominant force at work and this acts as a bullish headwind. The green zones on the chart below mark support zones from June to October. Notice that SPY broke "support" at least four times from June to October. There were three breaks in the last two months and the index is still near the scene of the last "break". In other words, there was not much follow through to these alleged breakdowns.
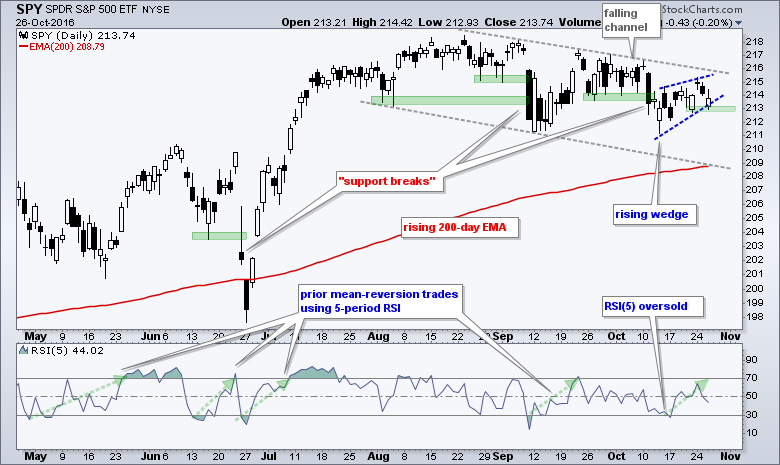 Visually, SPY is in a downtrend since mid August, but this downtrend is not very steep and looks more like a consolidation. I still see a rising wedge marking the advance over the last ten days with first "support" at 213. A close below 212.9 would break this alleged support zone and argue for a move to the 209-210 area. The long-term trend, however, is still up and this is why support breaks should be taken with a pinch of salt.
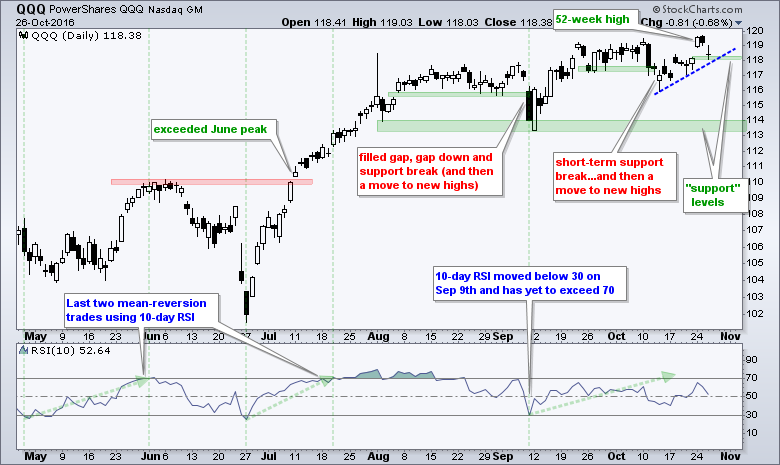
The next chart shows QQQ with short-term support breaks in September and October. QQQ moved to new highs right after these breaks because the bigger uptrend overruled. I see another short-term support level at 118, but the bigger trend is clearly up so I am not sure how much weight we can put on a "support" break here. Basically, a support break often leads to a short-term oversold condition and this sets up the next mean-reversion trade. One of these support breaks will lead to a bigger breakdown, but it is usually better to bet on the big trend continuing, not reversing.
Pattern Trading versus Mean-Reversion Systems
And now for the biggest conundrum of all! Actually, there is no conundrum if you already have a strategy and you are trading according to that strategy. This is why it is of the utmost importance to plan your trade before making the trade and then trade that plan. No ifs, ands or buts. The broad market environment remains bullish and SPY is in a long-term uptrend, but small-caps are dragging their feet as IWM broke flag support on Wednesday. This is negative for pattern traders and I am marking first resistance at 122. A recovery and breakout here would put small-caps back on the bullish track.
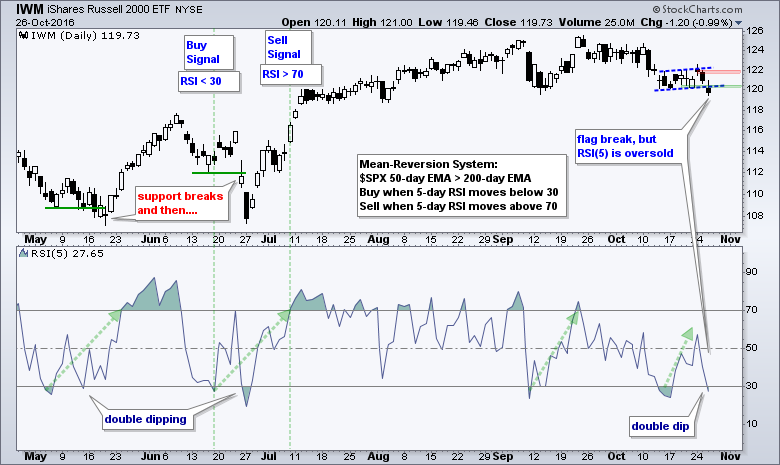 Mean-reversion traders will notice that RSI(5) moved below 30 to set up another mean-reversion trade. This is the second double-dip in the last six months. Notice that RSI(5) also did the double-dip in May and June. These double-dips were challenging because IWM broke support each time. And then rallied. This system does not use a stop-loss and instead exits when RSI(5) moves above 70. Obviously, this is not going to happen in the next day or two, but it does not take much to push 5-day RSI to its extremes. A 4-7% surge often does the trick. This does, however, mean that IWM could decline further and RSI(5) will not trigger an exit until the next bounce. For example, IWM could decline to 117 and then bounce above 122 to trigger an exit. This would also trigger a breakout on the price chart. See the conundrum between the two strategies? Visual pattern trading says one thing when quant driven mean-reversion trading says another.
Day of Divergence
It was a day of divergence in the market with an exceptionally mixed day. Note that advances outnumbered decliners in the S&P 500 because AD Percent finished slightly positive (+2.6%). AD Percent equals Advances less Declines divided by Total Issues. In contrast, AD Percent for the S&P MidCap 400 (-25.25%) and S&P Small-Cap 600 (-49.32%) finished negative.
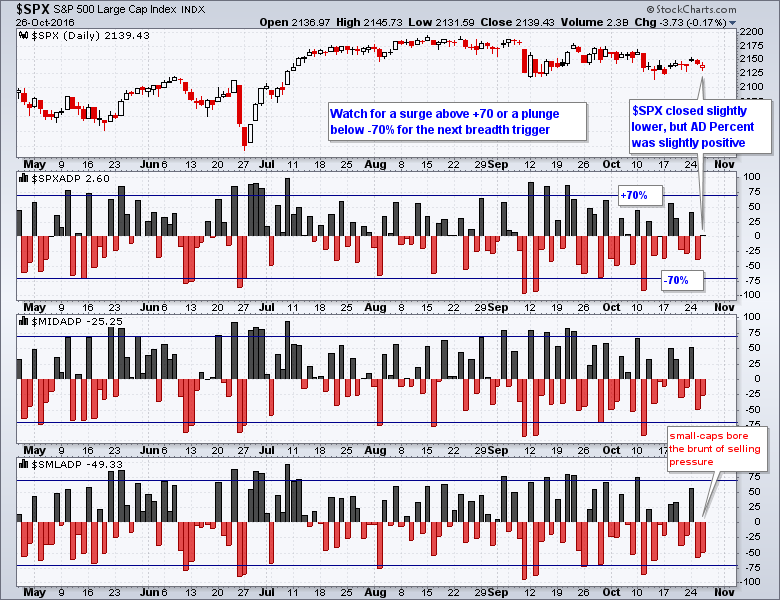
I am watching for the next breadth thrust to take the market out of its current funk. A surge above +70% in two of the three indicators would mark a bullish breadth thrust that could signal the end to the current correction. Converse, a thrust below -70% in two of the three indicators would show broad selling pressure and this could lead to further weakness.
Small-caps Sectors Bear the Brunt of Selling Pressure
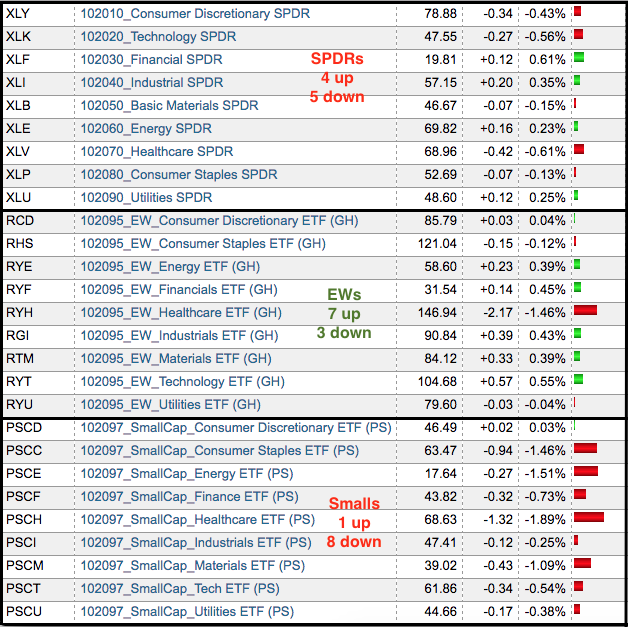
The table below shows the 1-day percent change for the 9 sector SPDRs, the 9 equal-weight sector ETFs and the 9 small-cap sector ETFs. I do not trade the equal-weight or small-cap sector ETFs because they have thin volumes, but we can still use these for analysis purposes. Four sector SPDRs closed higher, seven equal-weight sector ETFs finished positive and only one small-cap sector ETF closed up on the day. The equal-weight sectors performed good, but some of the small-cap sectors were hammered. Despite selling pressure in small-caps overall, notice that the consumer discretionary, finance, tech and industrials sectors held up relatively well. The SmallCap Technology ETF (PSCT) was down the most and it declined just .54% on the day.
Industrials Versus Consumer Discretionary
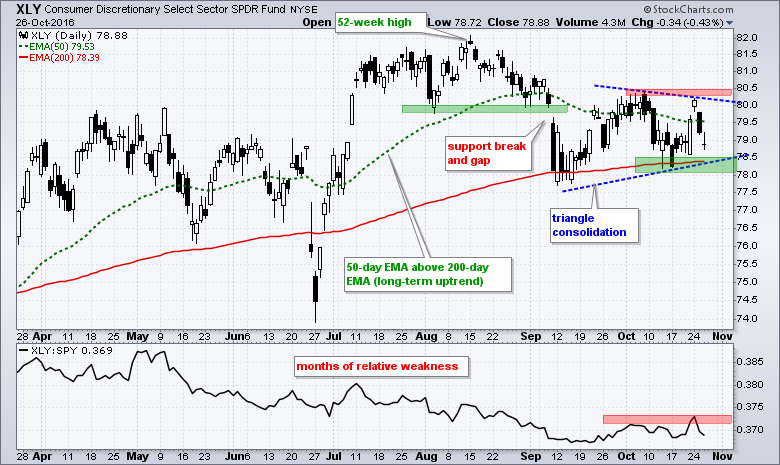
I am still focused on the Industrials SPDR (XLI) and the Consumer Discretionary SPDR (XLY) for clues on the broader market. The finance sector is performing well as the Bank SPDR (KBE) and Regional Bank SPDR (KRE) hit their highest levels of 2016. XLK and QQQ hit new highs this week so the technology sector is also performing well. XLY and XLI are the laggards to watch closely. XLY fell back as Home Depot fell 4% over the last two days and Comcast fell 3% on Wednesday. With a sharp decline the last two days, XLY is forming a possible triangle and a break below 78 would be bearish. Such a move would take out the mid October low and 200-day EMA. Chartists should watch 80.5 for an upside breakout.
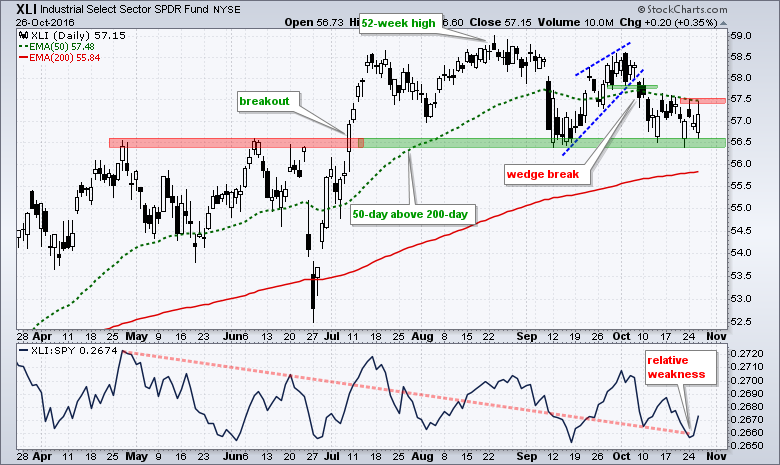
 XLI broke wedge support in early October and then consolidated the last two weeks. The three hollow candlesticks reflect a weak open and strong close, but the ETF has not been able to follow through with an upside breakout. A close above 57.5 would trigger a breakout and put the bulls back on track.
Bonds, Yields, Utilities and Gold
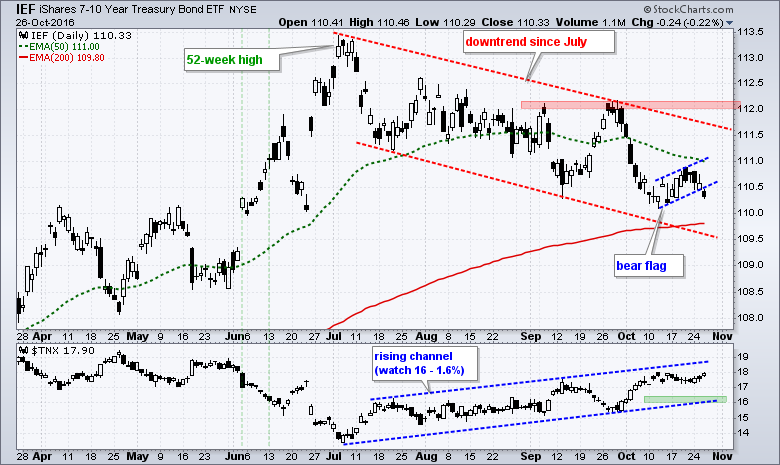
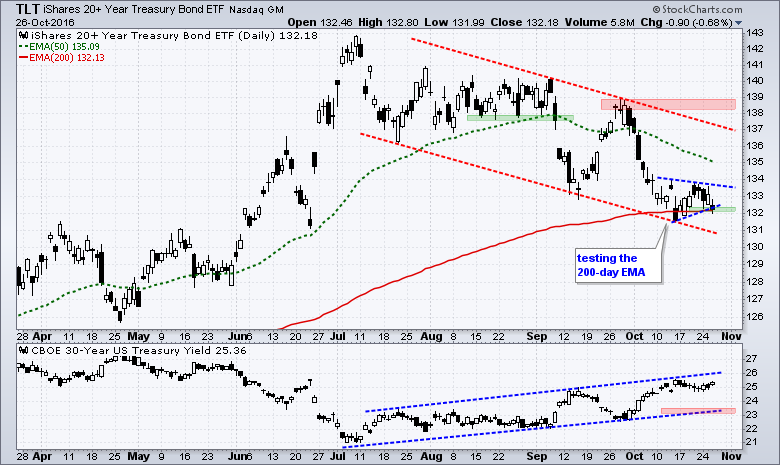
The 7-10 YR T-Bond ETF (IEF) broke flag support on Wednesday and the 20+ YR T-Bond ETF (TLT) is on the verge of a triangle break.
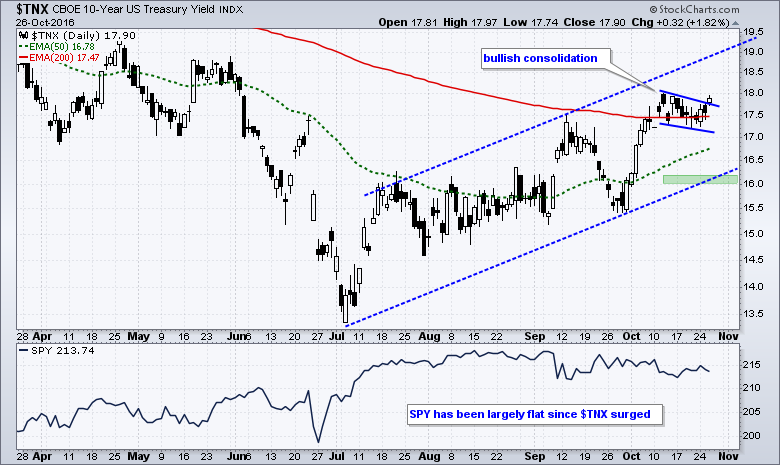
 Conversely, the 10-yr T-Yield ($TNX) turned up and broke flag resistance. Banks, brokers and insurers are positively correlated to the 10-yr yield and this means they tend to move in the same direction. An upside breakout in yields is positive for banks, brokers and insurers.
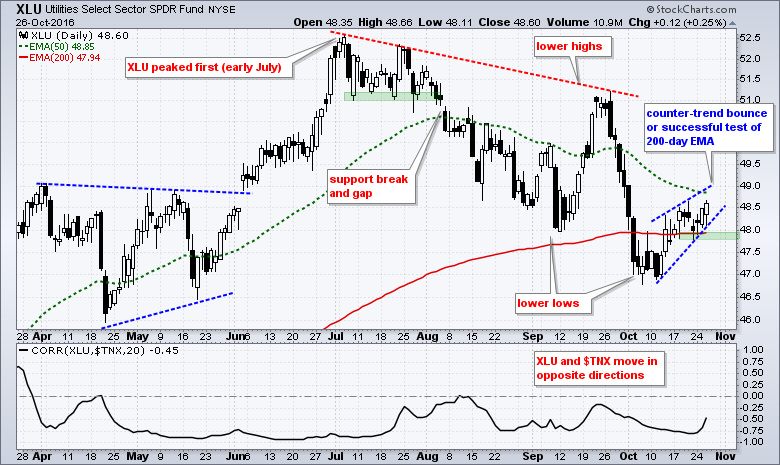
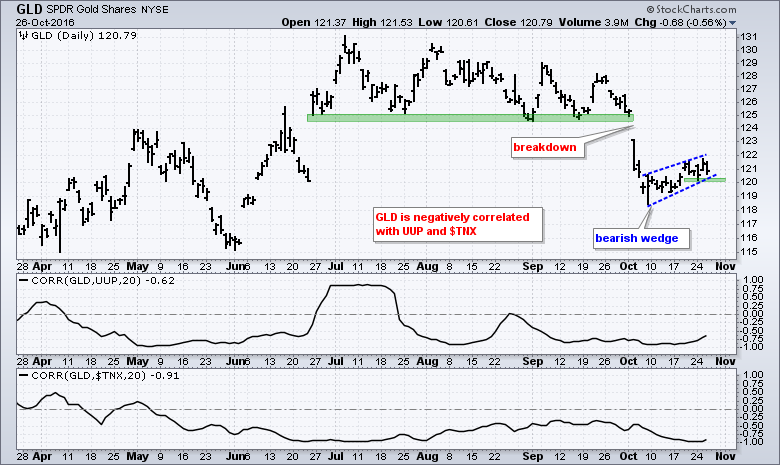
 Utilities, Consumer Staples, REITs and Gold are negatively correlated with the 10-yr T-Yield. This means they tend to fall when the 10-yr yield rises. The Utilities SPDR (XLU) formed a rising wedge as it moved back above the 200-day EMA. A move below 47.8 would break wedge support and signal a continuation lower. The Gold SPDR (GLD) also has a bearish wedge working and a break below 120 would reverse this short-term advance.
******************************************************
Measuring Risk On-Risk Off - Using charts to quantify stock, economic and credit risk.
PPO Trading Strategy - How to use 3 PPOs to develop a trend-reversion trading strategy.
Long-term Trend Indicators - Using the PPO, EMA Slope and CCI to determine the trend.
ETF Master ChartPack - 300+ ETFs organized in a Master ChartList and in individual groups.
Follow me on Twitter @arthurhill - Keep up with my 140 character commentaries.
****************************************
Thanks for tuning in and have a good day!
--Arthur Hill CMT
Plan your Trade and Trade your Plan
*****************************************


