Mean-Reversion Strategy Hits Key Level .... SPY Breaks Out of Corrective Channel .... Finance, Industrials and Materials Dominate New High List .... Ranking Sectors by %Above 200-day EMA .... Industrials, Materials and Mining Surge Together .... Oil Greets Moment-of-truth with Feeble Bounce .... //// ....
Mean-Reversion Strategy Hits Key Level
Developing a trading system is sometimes easier than sticking with a trading system. I outlined the RSI mean-reversion trading system several times over the last few months. This system looks for short-term oversold conditions when the S&P 500 is in a long-term uptrend (50-day EMA > 200-day EMA) and does not trade when the S&P 500 is in a long-term downtrend (50-day EMA < 200-day EMA). The system goes long when RSI becomes oversold and exits when RSI becomes overbought. There are no stops. I typically use 5-day RSI with oversold below 30 and overbought above 70. Some traders use 10-day RSI and some adjust the overbought and oversold levels. The choice is yours!
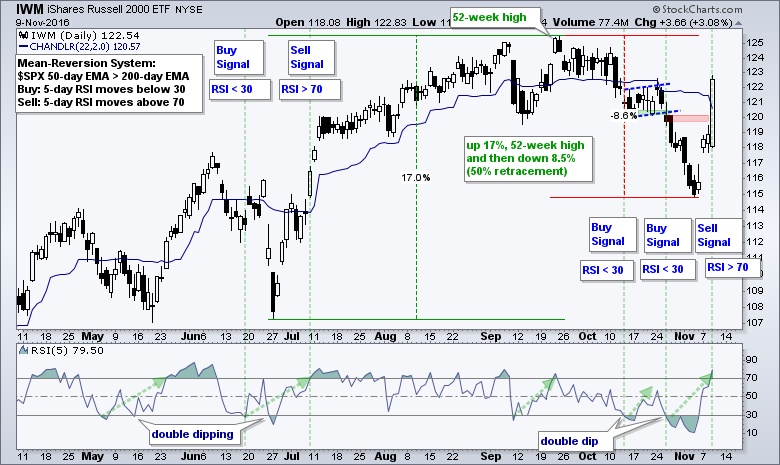
The chart above shows IWM becoming oversold in mid October and again late October as 5-day RSI double dipped below 30 (oversold). According to the system, these two dips generated buy signals that were activated on the next open. The indicator surged above 70 on Wednesday to generate a sell signal that will activate on today's open. As with the Brexit dip in June, there was a gut-wrenching drawdown followed by a big surge. Notice that IWM continued higher two months after the Brexit reversal. Chartists looking to capitalize on further gains can consider setting a trailing stop-loss using a specific level or the Chandelier Exit (blue line).
SPY Breaks Out of Corrective Channel
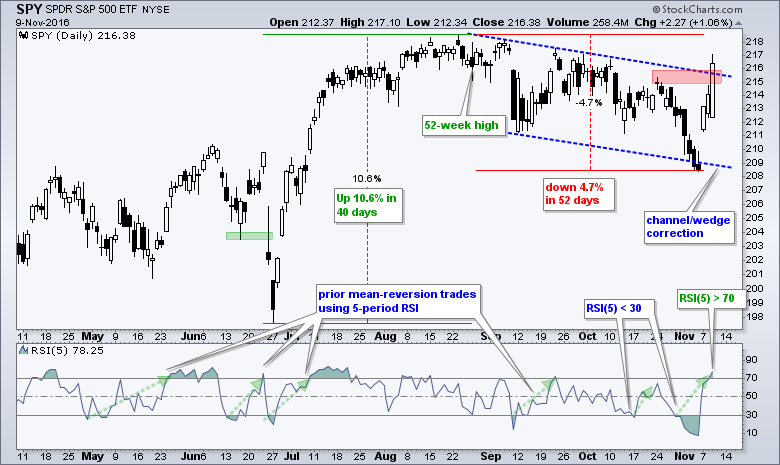
The next chart shows SPY surging 10.6% in 40 days and correcting with a 4.7% decline in 52 days. The decline formed a falling channel/wedge and SPY broke out with a gap-surge over the last three days. The gap was bullish and held for three days. This breakout signals a continuation of the long-term uptrend and targets a move to new highs. The indicator window shows 5-day RSI doing the double dip and then surging above 70 on Wednesday.
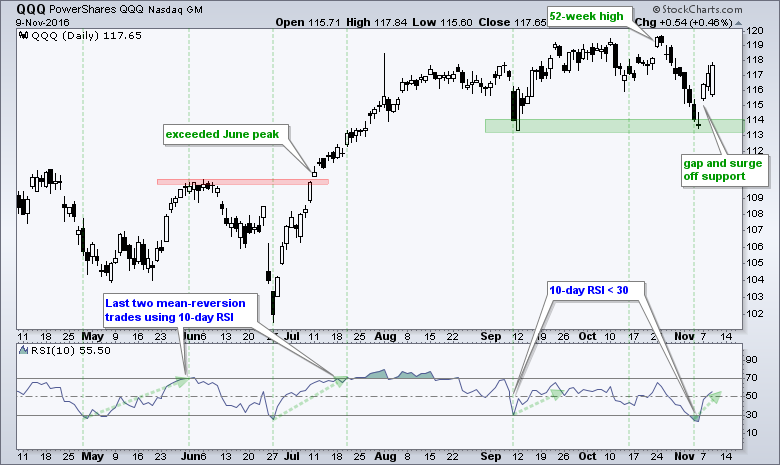
QQQ reversed at the mid September low with a gap and three-day surge. Notice that 10-day RSI became oversold last week when QQQ hit the 114 area. This set up a second mean-reversion signal that will remain until RSI moves above 70. I am showing QQQ with 10-day RSI because the backtest was better than 5-day RSI. However, note that trading 10-day RSI is more challenging because it becomes overbought and oversold less often than 5-day RSI. My guess is that 10-day RSI will not exceed 70 until QQQ hits a new high. Thus, traders may want to consider an alternative exit strategy of set a trailing stop-loss.
Finance, Industrials and Materials Dominate New High List
The price surge over the last three days also triggered an expansion in new 52-week highs. The chart below shows High-Low Percent for the S&P 500 and the nine sectors. High-Low Percent equals new highs less new lows divided by total issues. It is positive when new highs outnumber new lows and negative otherwise. The windows in this chart are ranked by High-Low Percent with the strongest sectors at the top and weakest at the bottom. First, notice that High-Low Percent exceeded +10% for the S&P 500. This confirms what we already knew: the broad market environment is bullish. Second, the finance and industrials sectors have the most new highs. Assuming that there were no new lows on Wednesday, 30% of stocks in the finance sector hit a new high and 25% of stocks in the industrials sector hit a new high. This is where the market leaders can be found. Next up, 15% of stocks in the materials sector hit new highs and 7% of stocks in the technology sector hit new highs. Finance and tech were already strong, but there has been a strong rotation into industrials and materials.
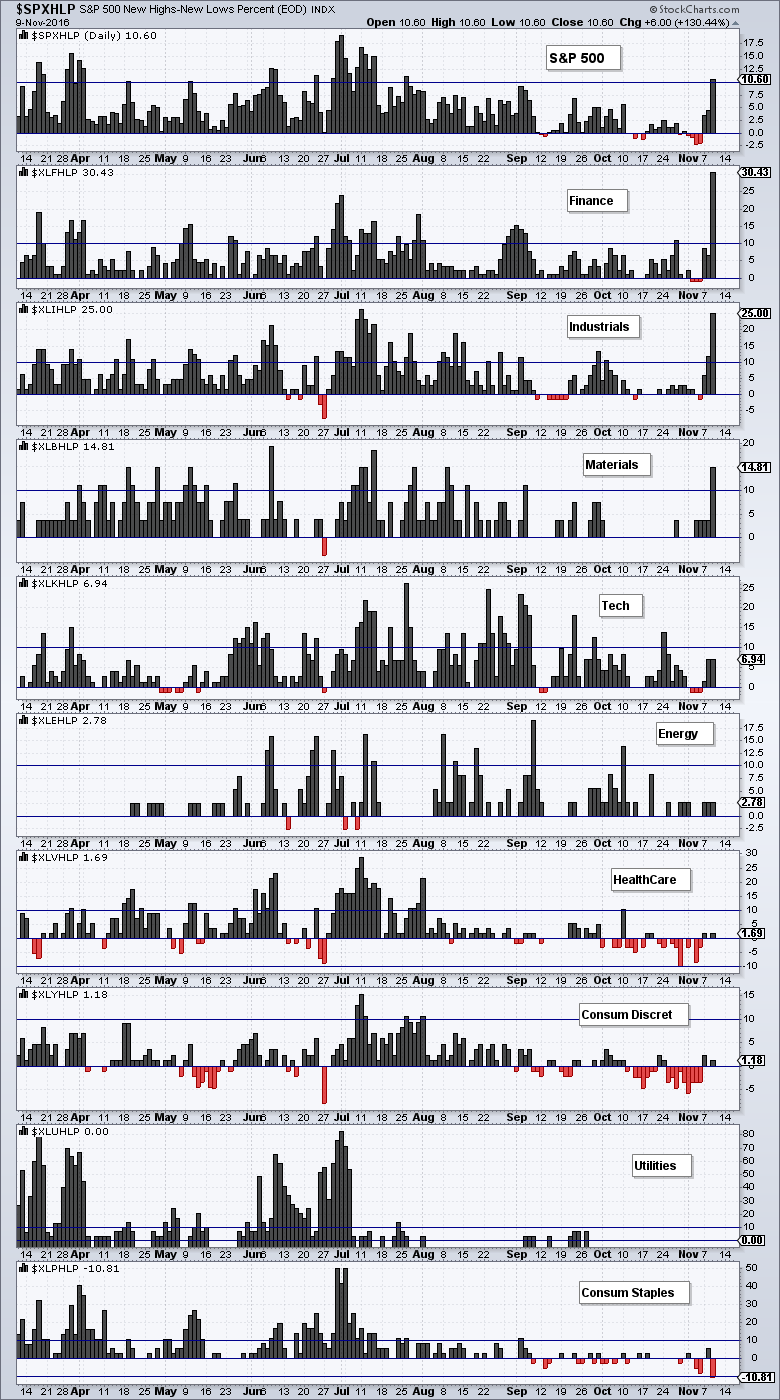
Moving to the bottom half of the chart, new highs were sparse in the energy, healthcare and consumer discretionary sectors. There were no new highs in the utilities sector and new lows outpaced new highs in the consumer staples sector. Notice that Consumer Staples HiLo% ($XLPHLP) finished at -10.81%.
Ranking Sectors by %Above 200-day EMA
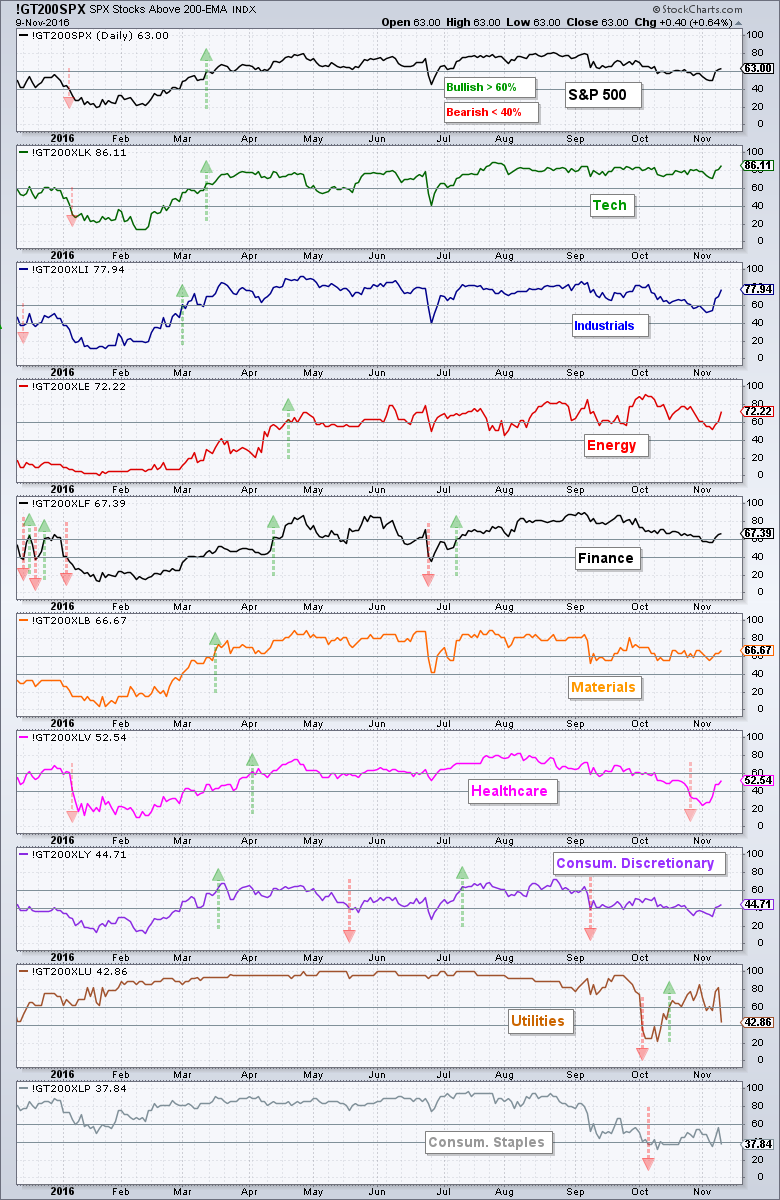
Chartists can also rank the sectors using the %Above the 200-day EMA, which is more of a long-term ranking. The chart below shows this indicator for the S&P 500 and the nine sectors. A move above 60% is bullish (green arrows) and remains bullish until a move below 40% (red arrows). I count six sectors on bullish signals and three on bearish signals (XLV, XLY, XLP). This 6 to 3 count confirms the bull market environment. The table is ranked with the strongest at the top and weakest at the bottom.
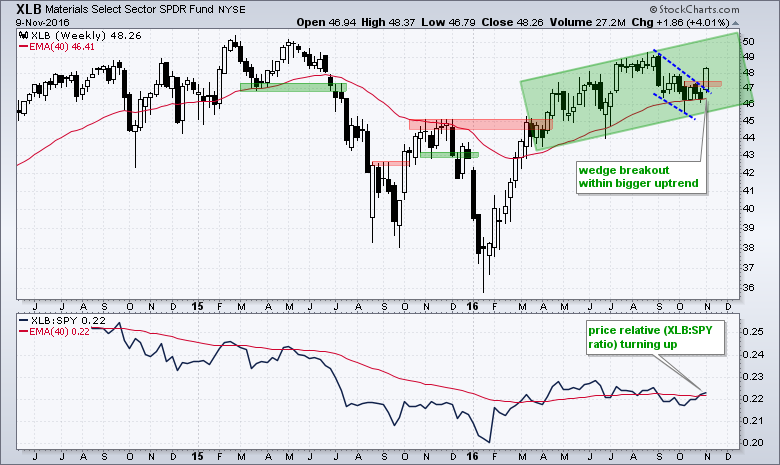
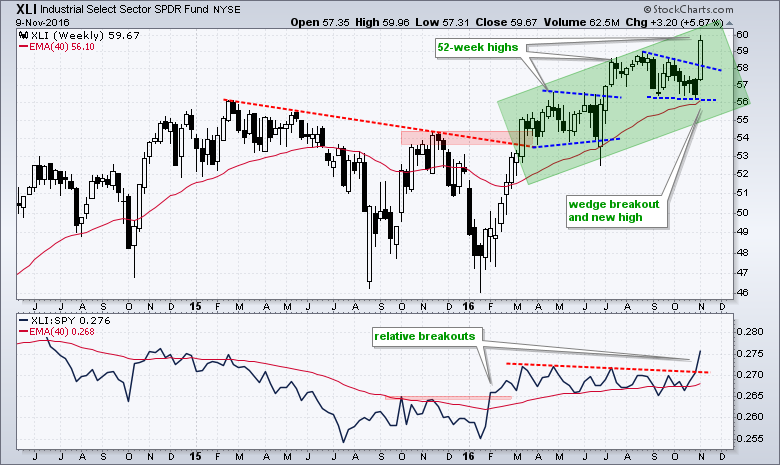
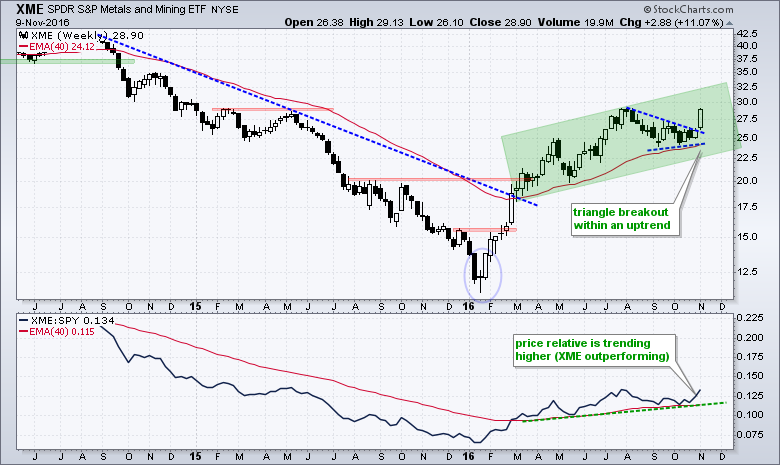
Industrials, Materials and Mining Surge Together
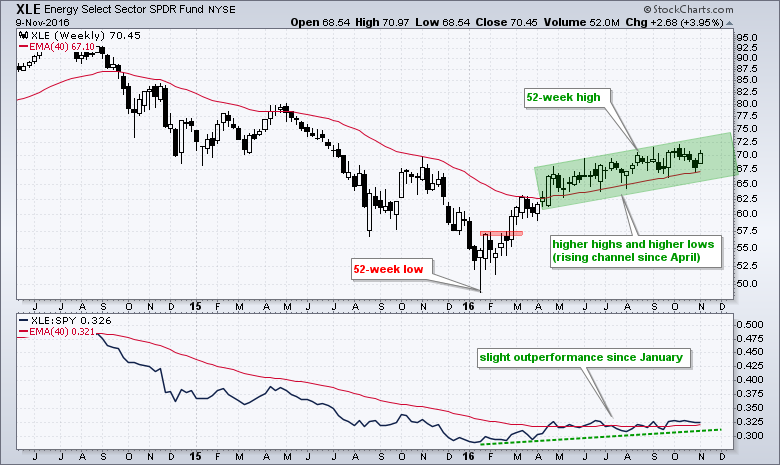
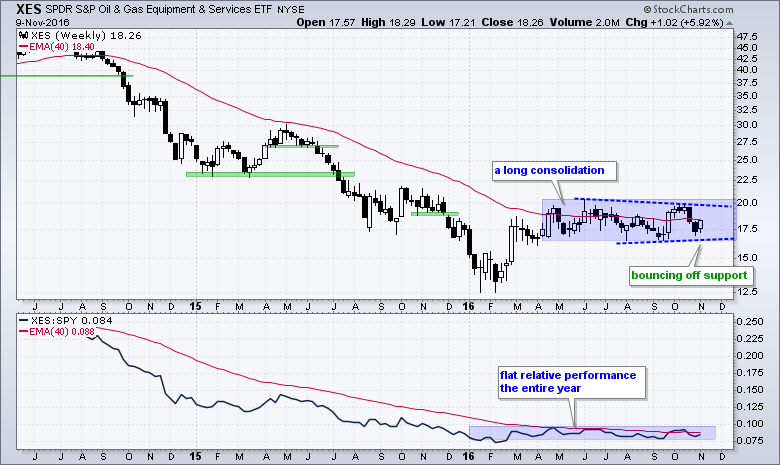
The next charts cover two sector SPDRs and an industry group ETF that moved sharply higher over the last three days. At the risk of pointing out the obvious, there seems to be a common thread here. Namely, stocks related to industrial commodities and industrials are moving higher. This fits with the recent breakouts we in copper (JJC) and nickel (JJN), and the surge in palladium (PALL). In contrast, note that gold and silver are down over the last three days.
Oil Greets Moment-of-truth with Feeble Bounce
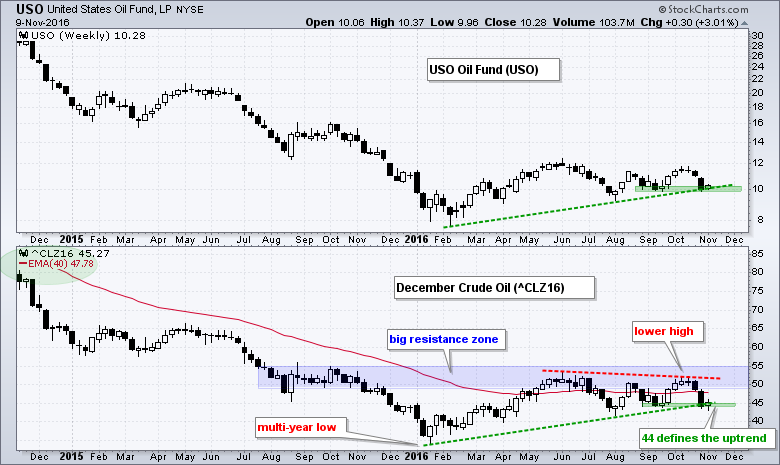
The jury is still out on oil because crude is still floundering near the September low and natural gas broke down. The lower window on the chart below shows December Crude (^CLZ16) falling sharply the prior two weeks and firming near support in the 44-45 area this week. This means crude is at its moment-of-truth. A break below this support zone would be quite negative for oil and this would no doubt weigh on energy related stocks.
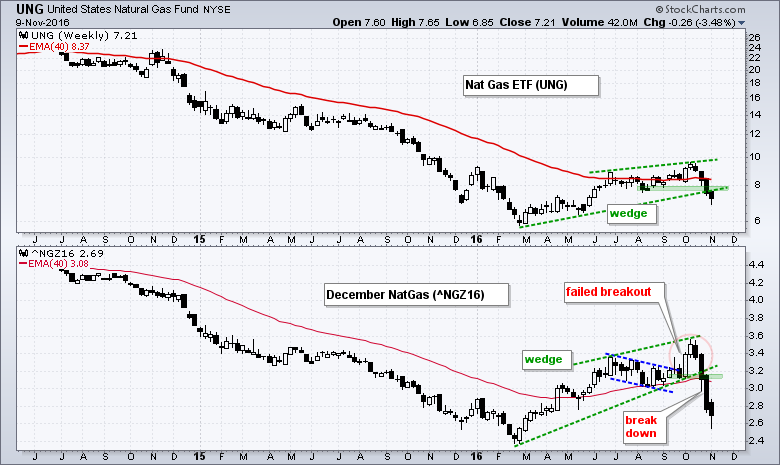
The lower window on the next chart shows December Natural Gas (^NGZ16) advancing with a rising wedge form February to October and then breaking wedge support with a sharp decline the last four weeks.
 ******************************************************
Measuring Risk On-Risk Off - Using charts to quantify stock, economic and credit risk.
PPO Trading Strategy - How to use 3 PPOs to develop a trend-reversion trading strategy.
Long-term Trend Indicators - Using the PPO, EMA Slope and CCI to determine the trend.
ETF Master ChartPack - 300+ ETFs organized in a Master ChartList and in individual groups.
Follow me on Twitter @arthurhill - Keep up with my 140 character commentaries.
****************************************
Thanks for tuning in and have a good day!
--Arthur Hill CMT
Plan your Trade and Trade your Plan
*****************************************


