Key Levels and Indicators to Watch for SPY .... Indicators are Not Bearish until they Trigger .... Treasury Yields Surge .... Will Correlations with the 10-yr Yield Hold Up? .... Biotech ETFs Try for Higher Lows.... //// ....
Key Levels and Indicators to Watch for SPY
The S&P 500 SPDR (SPY) fell 2.54% the prior two weeks, surged 2.67% on Monday-Tuesday and the futures are down around 2.1% at 7AM ET. This suggests that SPY will open around 209.5 and tests the breakout zone yet again. This also means nothing much has changed on the weekly charts so let's review the key levels and indicators. SPY surged to a new high with the July breakout and fell back to this breakout zone over the last few months. The 52-week high points to a long-term uptrend and the falling channel/flag defines the current correction or immediate downtrend. A breakout at 215 would reverse this fall and signal a continuation of the summer surge.
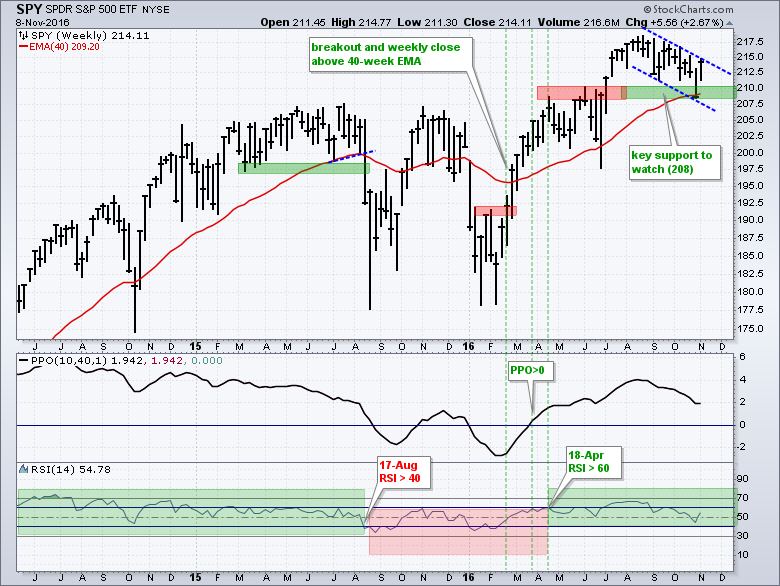
I am watching two levels and two indicators on the downside. First, broken resistance turns first support in the 208-210 area and this level held with last week's bounce. Second, the 40-week EMA is around 209. A weekly close below 208 would break this level and trigger the second close below the 40-week EMA. The indicator window shows the PPO(10,40,1), which measures the difference between the 10-week EMA and 40-week EMA. The PPO is currently positive and a move below zero would suggest a death cross on the price chart. Third, I am watching the bull range in RSI, which is from 40 to 80. An RSI break below 40 would signal a momentum breakdown and this would signal the start of a downtrend. Today's analysis fits with Friday's System Trader article on moving average signals using SPY because the 10/40 week EAM pair is similar to the 50/200 day EMA pair.
Indicators are Not Bearish until they Trigger
The broad market breadth indicators remain on a bullish signal since March and have yet to signal a bearish reversal. The chart below shows breadth indicators for the S&P 1500, which includes large-caps, mid-caps, small-caps, Nasdaq stocks and NYSE stocks. All major groups need to be present when measuring breadth. The signal levels are set to filter out noise and focus on significant shifts in participation. Breadth is net bullish when at least two of the three indicators are on bull signals (green lines) and net bearish when two of the three are on bear signals (red lines).
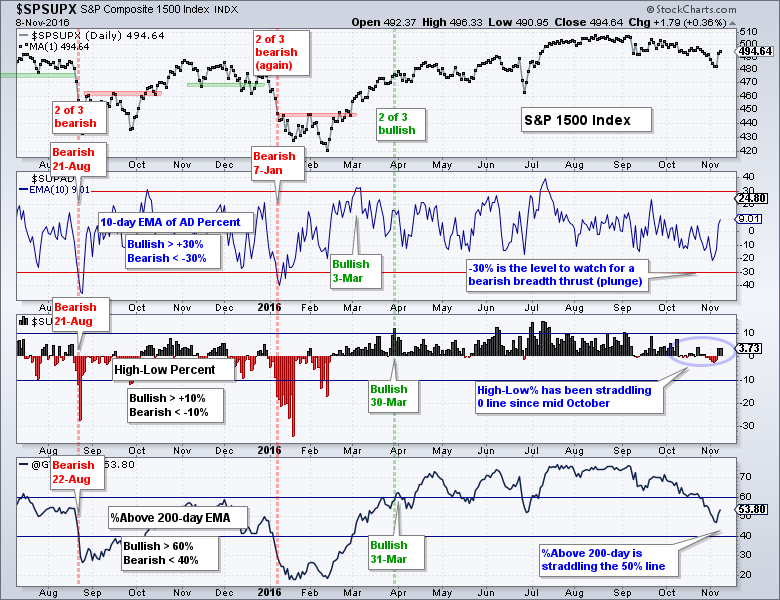
The 10-day EMA of AD Percent triggers bullish with a surge above +30% and bearish with a plunge below -30%. It is currently at +9% and far from a bearish signal. High-Low Percent triggers bullish with a move above +10% and bearish with a move below -10%. It is currently at +3.73% and far from a bearish signal. The %Above 200-day EMA triggers bullish with a move above 60% and bearish with a move below 40%. It is currently at 53.8% and also fairly far from a bearish signal.
Bottom Line: Regardless of recent events and the sharp drop in stock futures, the stock market remains in a bull market environment and I have yet to see any evidence to the contrary.
Treasury Yields Surge
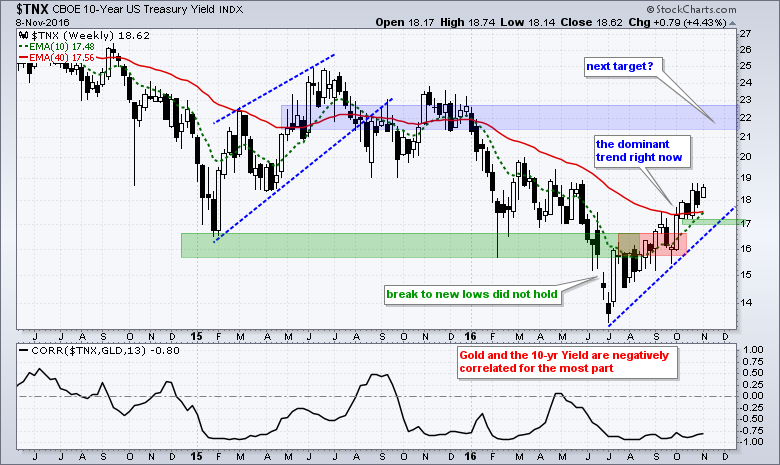
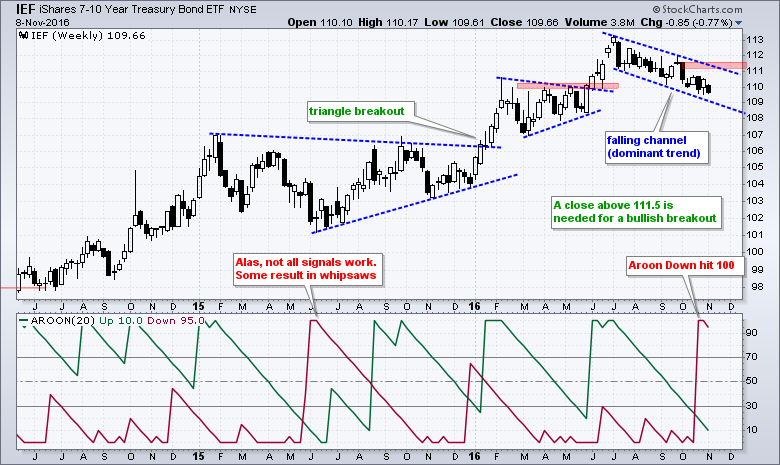
Treasury bonds plunged overnight and the 10-yr T-Yield ($TNX) surged above 1.9% for the first time since April. This extends the current uptrend in the 10-yr yield and the downtrend in the 7-10 YR T-Bond ETF (IEF). In other words, today's reaction is just an extension of existing trends.
Will Correlations with the 10-yr Yield Hold Up?
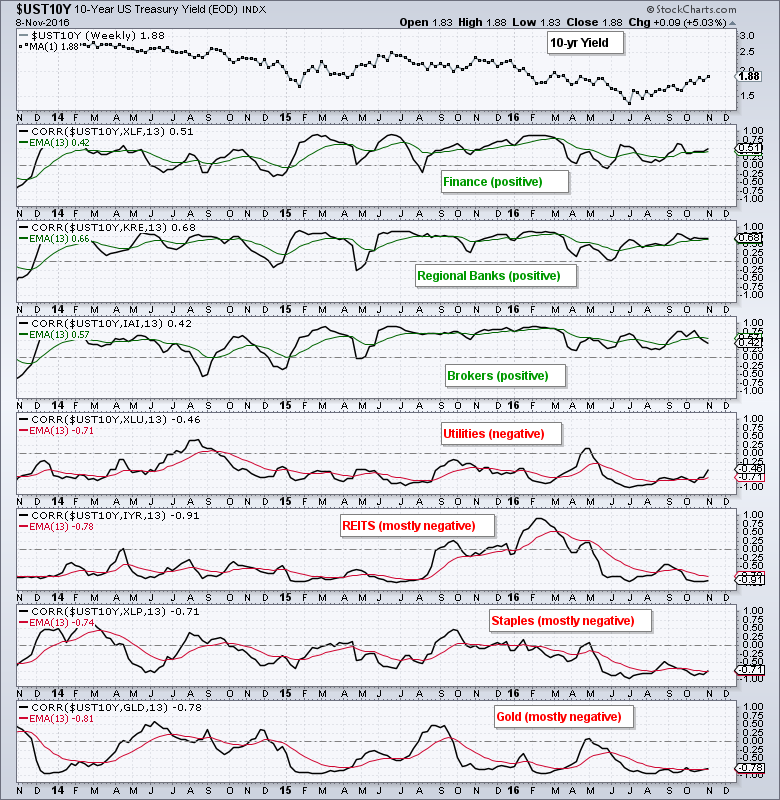
Even though the markets are a bit chaotic at the moment, the surge in Treasury yields could affect certain sectors and asset classes. This, of course, depends on past correlations holding up in the new normal. Keep in mind that correlations change, just like prices and trends. For now, I think banks, brokers and insurance stocks could benefit from higher yields. Utilities, REITs and consumer staples could be hurt by higher yields. Gold is a harder call it is surging (~2.1%) along with the 10-yr yield this morning. Gold was negatively correlated with the 10-yr yield over the past year.
Biotech ETFs Try for Higher Lows
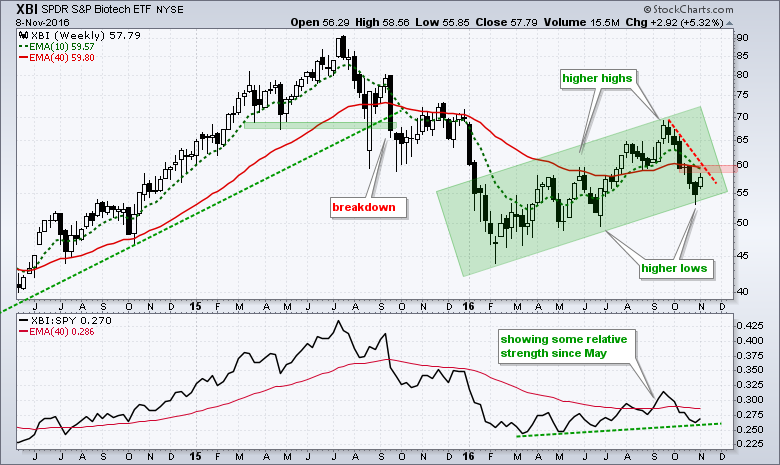
S&P futures are down sharply, but the biotech ETFs are trading higher in pre-market action. The Biotech iShares (IBB) and Biotech SPDR (XBI) were hit very hard in October, but both forged higher highs in September and remain above their summer lows. The first chart shows XBI with a zigzag advance since February. The green zone shows this advance with higher highs and higher lows. XBI is currently just above its June low with the red zone marking downswing resistance. Look for a break above 60 to reverse this downswing.
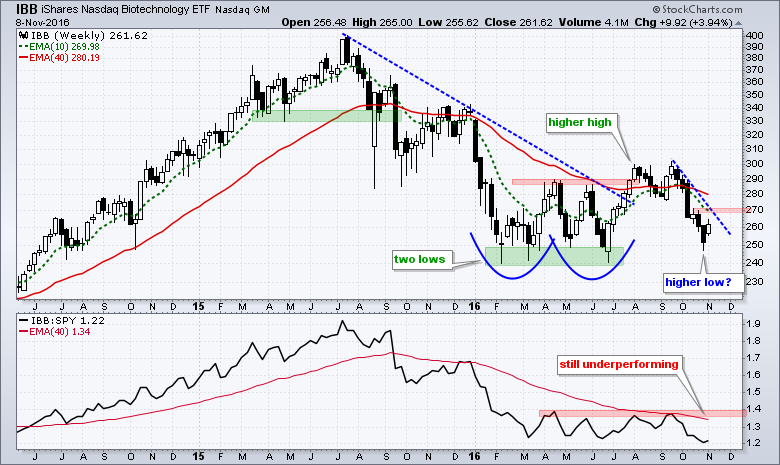
The second chart shows IBB holding support in the 240 area from February to June and then breaking out in July (higher high). IBB pulled back hard in October, but managed to firm just above the low (higher low?). Downswing resistance is set at 271 and a break above this level would reverse the seven week downswing.
******************************************************
Measuring Risk On-Risk Off - Using charts to quantify stock, economic and credit risk.
PPO Trading Strategy - How to use 3 PPOs to develop a trend-reversion trading strategy.
Long-term Trend Indicators - Using the PPO, EMA Slope and CCI to determine the trend.
ETF Master ChartPack - 300+ ETFs organized in a Master ChartList and in individual groups.
Follow me on Twitter @arthurhill - Keep up with my 140 character commentaries.
****************************************
Thanks for tuning in and have a good day!
--Arthur Hill CMT
Plan your Trade and Trade your Plan
*****************************************


