 --- Webinar Video --- Art's Charts Chartlist ---
Stock Market Shows Broad Strength .... Record Highs in Mid-cap and Small-cap Indexes .... Don't Blame the Entire Tech Sector .... SPY Holds Breakout .... XLY Surges to Resistance Zone .... Consumer Discretionary Breadth Remains Bullish .... Scan Correction .... //// ....
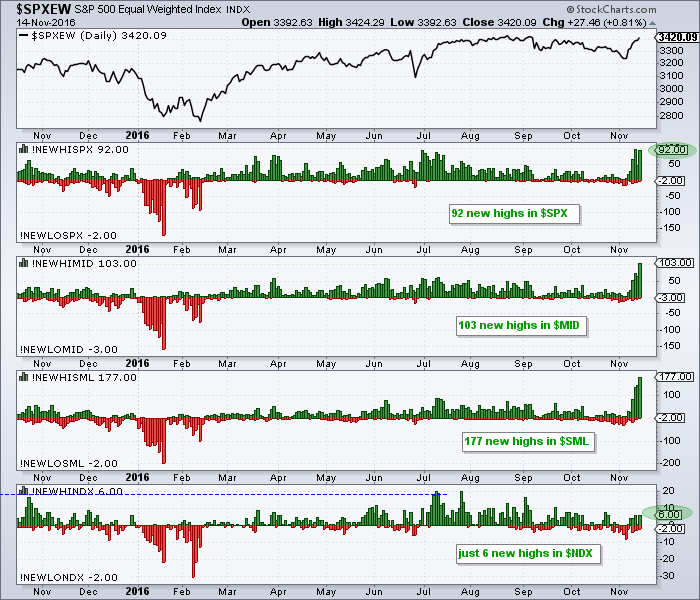
Even though some stocks and ETFs may be overbought after a big surge the last seven days, the bigger takeaway is that this market is strong, and strong in a broad way. 92 stocks in the S&P 500 (18.4%) hit new highs on Monday, 103 stocks in the S&P MidCap 400 (25.75%) hit new highs and 177 stocks in the S&P Small-Cap 600 (29.5%) hit new highs. This shows broad strength that is synonymous with a bull market. The chart below shows a great example of the "Price Up/Down Pair" indicator. Select this as an indicator and then enter two symbols separated by a comma, such as !NEWHISPX,!NEWLOSPX for new highs and lows on the S&P 500.
Record Highs in Mid-cap and Small-cap Indexes
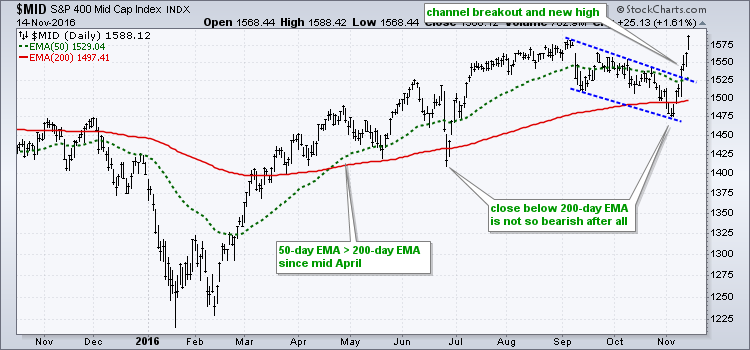
In addition to hundreds of stocks hitting new highs, the S&P MidCap 400, S&P Small-Cap 600 and Russell 2000 recorded new all time highs as well on Monday. Not just new highs, but RECORD highs. The chart below shows $MID breaking channel resistance and not looking back as it surged above the early September high. A throwback to the 1550 could provide a second change to enter this trend.
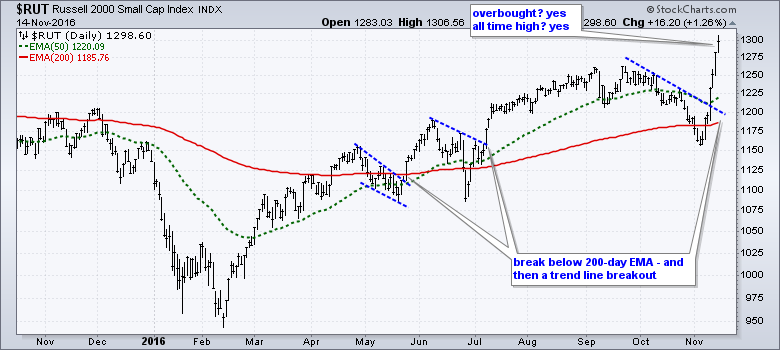
The next chart shows the Russell 2000 breaking below its 200-day EMA in May, late June and early November. The index recovered quite quickly after each break and went on to exceed its prior peak. Each break represented a pullback within a bigger uptrend. The Russell 2000 is now short-term oversold after a 12% surge in seven trading days, but keep in mind that overbought conditions stem from strength, not weakness.
Don't Blame the Entire Tech Sector
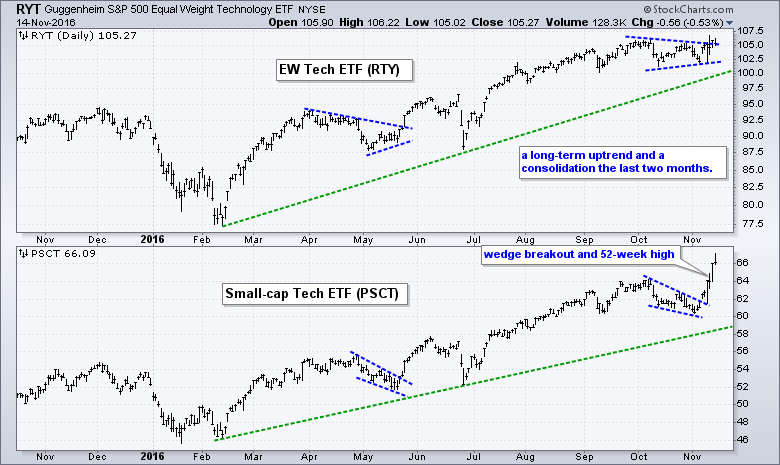
The S&P 500 and S&P 500 Equal-Weight Index did not hit new highs, but they are within 2% of a new high, which is close enough for me. The Nasdaq 100 did not hit a new high and this index is around 4.5% from its all time high. Weakness in the Nasdaq 100 and QQQ stems from a handful of large-cap tech stocks. Note that the EW Technology ETF (RYT) hit a new high last week and the SmallCap Technology ETF (PSCT) hit a new high on Monday. Thus, I do not think there is a big problem in the technology sector.
As far as the broader market is concerned, the number of stocks hitting 52-week highs speaks for itself, as do the all time highs in the key small-cap and mid-cap indexes. There is always something out there creating uncertainty so I take a weight of the evidence approach to broad market analysis. Bottom line: the broad market environment was bullish before the election and it remains bullish. According to my trading philosophy, this means pullbacks are opportunities, not threats.
SPY Holds Breakout
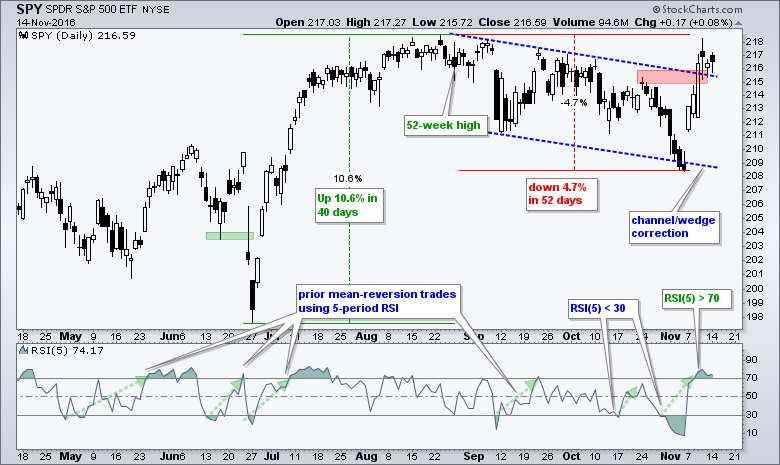
The chart below shows SPY breaking channel resistance and holding this breakout. Even though a move back below 215 would suggest a failed breakout, I would instead view such a pullback as an opportunity. In other words, a move back below 215 would not change the broad market environment from bullish to bearish. Trading a mean-reversion strategy, I would look for RSI(5) to dip below 30 for a bullish setup.
The next chart shows QQQ surging off support with a gap and three day advance - and then falling back to support. I am sure someone will eventually point out a bearish head-and-shoulders top taking shape from August to November, but I am not interested in bearish patterns or setups when the broad market environment is bullish. In fact, I would not even turn bearish on a support break at 113. Why? Because the broad market environment is bullish. As long as the bulls reign, a move below 30 in 5-day RSI would set up the next mean reversion trade. I will review the charts for Apple, Amazon, Facebook, Google, Microsoft, Gilead and Intel in today's webinar.

XLY Surges to Resistance Zone
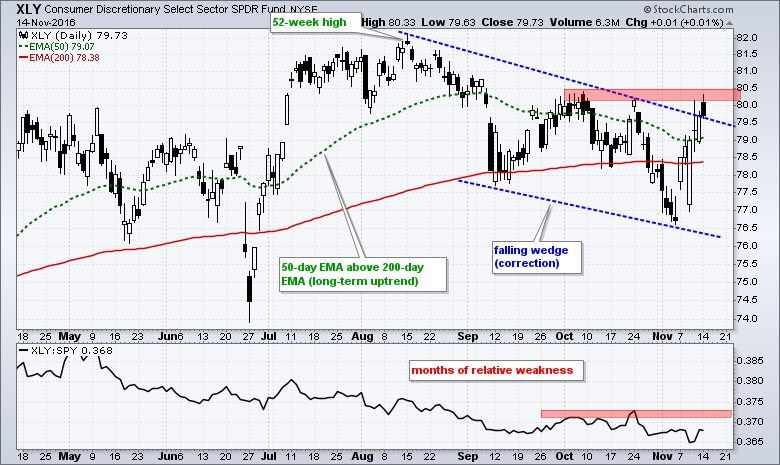
We saw breakouts in the Industrials SPDR (XLI), the Materials SPDR (XLB) and the Finance SPDR (XLF) over the last seven trading days, but I think the surge in the Consumer Discretionary SPDR (XLY) could be the most important story developing. As its name suggests, the consumer discretionary sector is the most economically sensitive sector. A surge and breakout in this sector, therefore, would suggest an improvement in the US economy and this would reinforce the case for the bull market. The first chart shows XLY surging to a resistance zone and breaking a wedge trend line. I view this wedge as a big correction because XLY hit a 52-week high in mid August and the wedge low held well above the late June low. XLY, however, continues to show relative weakness because the price relative hit a new low last week.
Consumer Discretionary Breadth Remains Bullish
XLY is a sector SPDR that is dominated by large-cap stocks. Amazon (12.4%), Comcast (7.08%), Home Depot (6.91%), Disney (6.34%) and McDonalds (4.41%) account for around 37% of the ETF. Chartists can neutralize this large-cap dominance by looking at the EW Consumer Discretionary ETF (RCD) and breadth indicators. The chart below shows RCD breaking above its October highs with a seven day surge. The price relative (RCD:SPY ratio) also broke out as RCD outperformed during this surge.
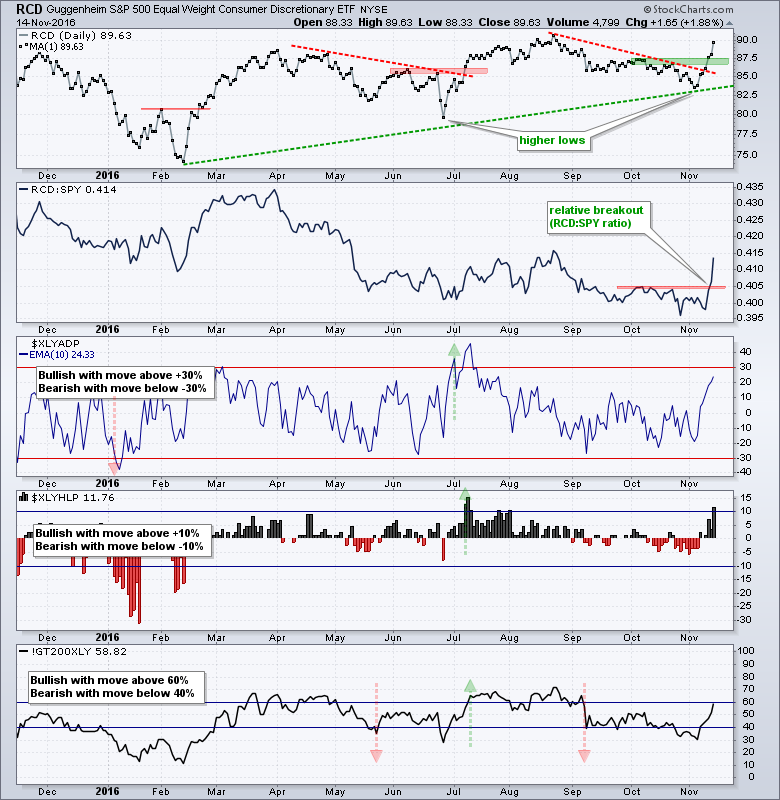
The other three windows show the breadth indicators with two of three on bull signals. The 10-day EMA of XLY AD Percent ($XLYADP) turned bullish with a thrust above +30% in early July, and Consumer Discretionary High-Low% ($XLYHLP) turned bullish with a move above +10% a few days later. The XLY %Above 200-day EMA (!GT200XLY) turned bearish in early September and remains bearish. However, note that two of the three breadth indicators have been on bull signals since early July. This means consumer discretionary has been net bullish for months. The %Above 200-day EMA is close to a bull signal (move above 60%). I will show charts for the Home Construction iShares (ITB) and Retail SPDR (XRT) in today's webinar.
Scan Correction
An astute reader noticed an error in my scan for 252-day closing highs. Many thanks for the feedback! The original scan code still captured 252-day closing highs over a five day period, but I skipped the third day and added a sixth day. In other words, it was not for the last five consecutive days. In any case, the corrected scan code is shown below.
[group is SP500]
and [[today's close > yesterday's daily max(252,close)]
or [yesterday's daily close > 2 days ago daily max(252,close)]
or [2 days ago daily close > 3 days ago daily max(252,close)]
or [3 days ago daily close > 4 days ago daily max(252,close)]
or [4 days ago daily close > 5 days ago daily max(252,close)] ]
******************************************************
Measuring Risk On-Risk Off - Using charts to quantify stock, economic and credit risk.
PPO Trading Strategy - How to use 3 PPOs to develop a trend-reversion trading strategy.
Long-term Trend Indicators - Using the PPO, EMA Slope and CCI to determine the trend.
ETF Master ChartPack - 300+ ETFs organized in a Master ChartList and in individual groups.
Follow me on Twitter @arthurhill - Keep up with my 140 character commentaries.
****************************************
Thanks for tuning in and have a good day!
--Arthur Hill CMT
Plan your Trade and Trade your Plan
*****************************************


