----- Webinar Video ----- Art's Charts ChartList -----
SPY Hits Yet Another New High .... QQQ and IJR Remain with Active Signals .... Small-caps Lead Large-caps All the Way Around .... Lagging Sectors Pop and Lead for a Week .... XLV Gaps Up and Breaks Out .... Biotechs Pop and Drop .... TASR and ESRX Show Need for a PLAN .... Webinar Preview .... //// ....
SPY Hits Yet Another New High
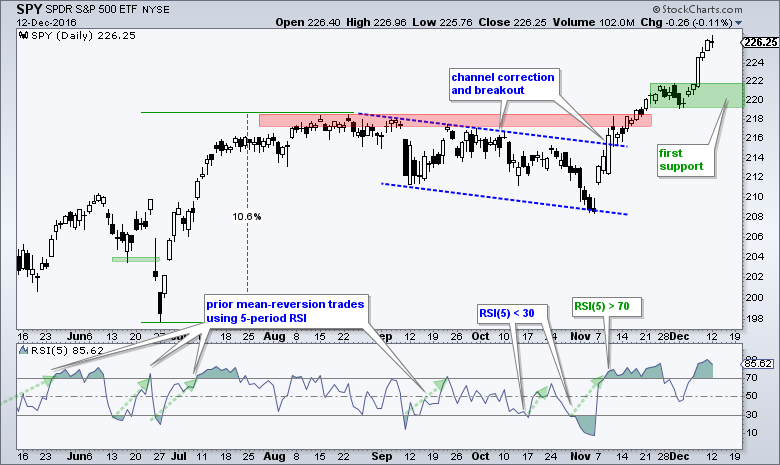
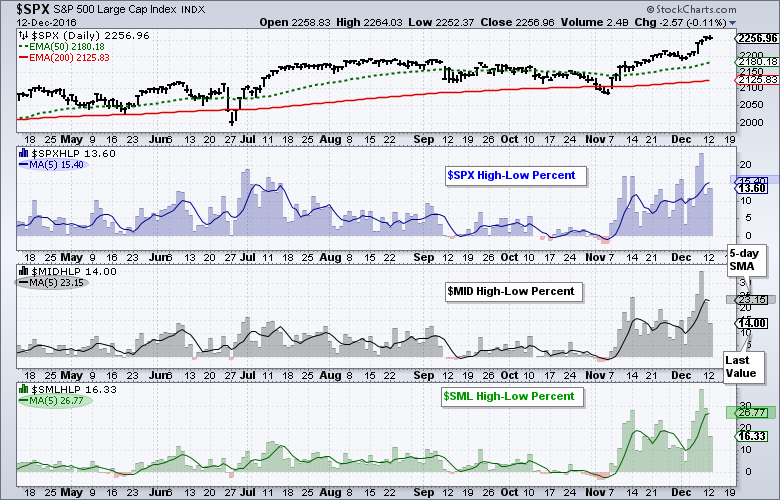
SPY surged around 3% the last six trading days and hit yet another new high. This is at least the eighth new high since mid November and proves that new highs are seldom isolated events. Long-term, SPY broke out of its channel in early November and recorded a fresh 52-week high on 17-Nov. Selling pressure has been short-lived as buyers stepped in after a two day pullback and this area marks the first support zone to watch (green zone). Should we see a pullback, I have a feeling that buyers will step in before SPY hits this zone as portfolio managers position themselves for year end. Feelings and hunches don't really help when it comes to actual trading and often lead to bad trades. Short-term, I will just wait for the next setup and this could be a small pennant/flag, an RSI dip below 30 or a test of the support zone.
QQQ and IJR Remain with Active Signals
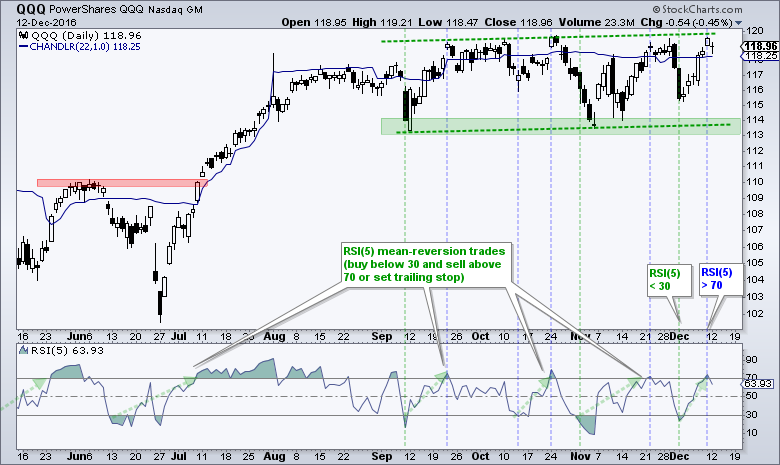
QQQ is in the midst of a signal because RSI(5) dipped below 30 on 1-Dec and then surged to the upper end of its four-month range. RSI(5) moved above 70 on Friday and this means traders can either exit or trail a stop-loss. I have added a Chandelier Exit (22,1) to trail a stop on a close below 118.25. Don't forget to check out Friday's System Trader article: Testing and Tweaking an RSI Mean-Reversion System for SPY, QQQ and IJR.
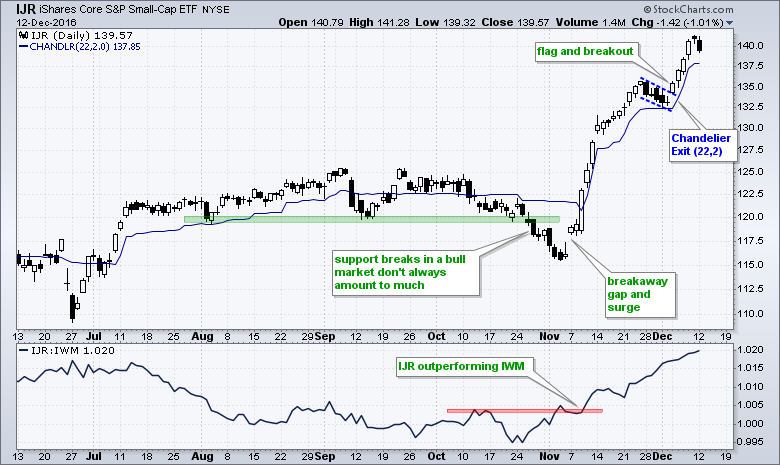
IJR has an active signal as well because the ETF formed a falling flag and broke out with a gap on 5-Dec. I added a Chandelier Exit (22,2) for a possible trailing stop. I switched to IJR because it consistently outperforms IWM and I am a long-only trader when it comes to stocks (especially during a bull market).
Small-caps Lead Large-caps All the Way Around
The S&P SmallCap iShares (IJR) is leading the S&P 500 SPDR (SPY) since early November in percentage gain and the percentage of new highs. IJR is up around 20% from the early November low and SPY is up around 8.5%. Also note that S&P 600 High-Low% ($SMLHLP) is higher than S&P 400 High-Low% ($MIDHLP) and S&P 500 High-Low% ($SPXHLP). High-Low Percent equals new highs less new lows divided by total issues. I added a 5-day SMA to smooth the values and this value is shaded on each window (large-caps = 15.4%, mid-caps = 23.15%, small-caps = 26.77%). With just one or two new lows over the past week, we can assume that over 25% of stocks in the S&P Small-Cap 600 hit new highs recently.
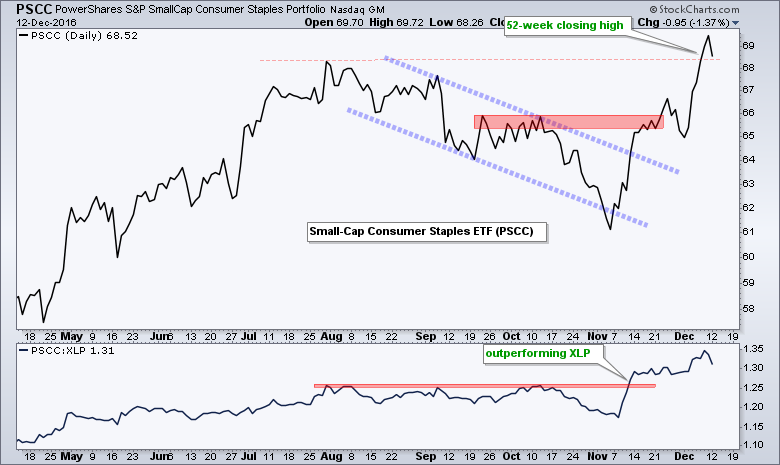
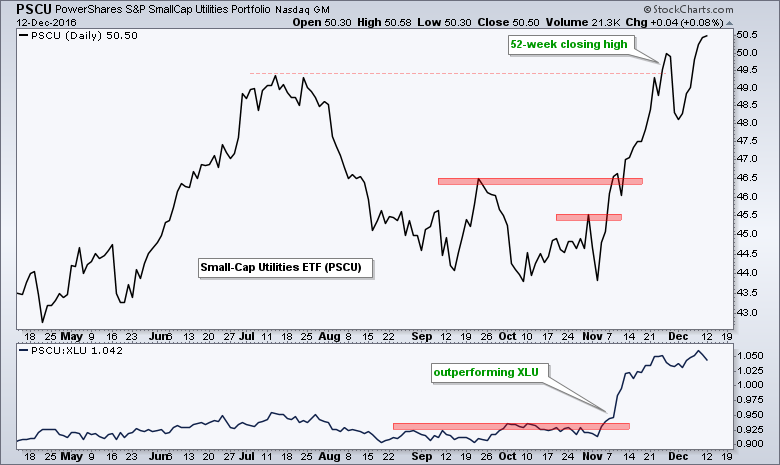
The vast majority of sectors are participating in the advance and this participation broadens as we move down in market cap. Note that 6 of the 9 sector SPDRs hit new highs over the last five days, as did 6 of the 9 equal-weight sector ETFs. In contrast, 8 of the 9 small-cap sector ETFs hit new highs. While healthcare, consumer staples and utilities are lagging quite for the SPDRs and equal-weight sectors, the SmallCap Utilities ETF (PSCU) and SmallCap Consumer Staples ETF (PSCC) hit new highs recently. I will be the first to admit that volume for some of the small-cap sector ETFs is too low for trading, but we can still glean valuable information from their charts. Namely, small-cap stocks are leading this rally.
Lagging Sectors Pop and Lead for a Week
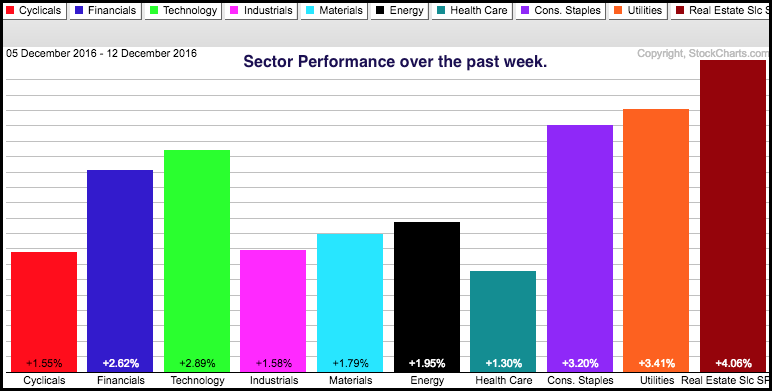
There are not a lot of bullish setups out there because many stocks and ETFs are in the middle of steep advances. A bullish setup occurs when we see a falling flag, falling wedge, pennant, triangle or short-term oversold condition (RSI below 30). These are few and far between after the big moves the last six days. Also note that many stocks and ETF are up double digits since early November. The Utilities SPDR (XLU), REIT SPDR (XLRE) and Consumer Staples SPDR (XLP) surged over the last five days and led the sector SPDRs. Despite some short-term relative strength, I think a rising rate environment is negative for these three sectors. In addition, we are in a bull market environment and defensive sectors (staples and utilities) usually underperform in such an environment.
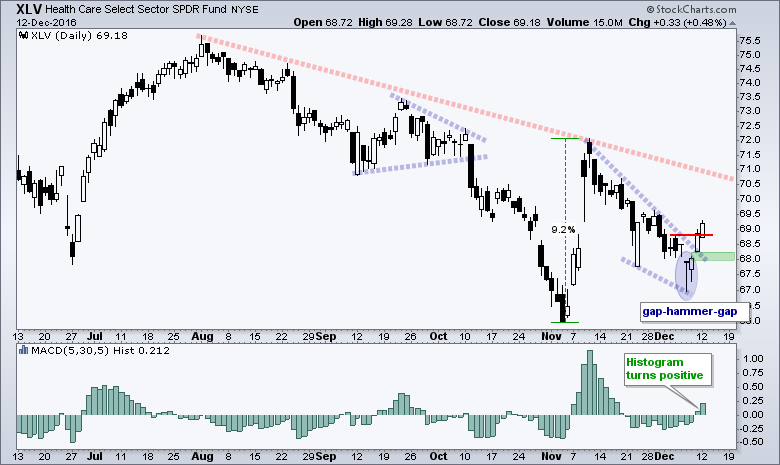
XLV Gaps Up and Breaks Out
I am not quite sure how healthcare fits into a bull market environment because it has some growth and is not a completely defensive sector (think biotechs). In any case, XLV shows signs of a reversal finally with a hammer, gap and breakout over the last four days. Also notice that a gap down preceded the hammer and this means we have an island reversal of sorts over the last five days. XLV also broke the wedge trend line and the MACD Histogram turned positive two days ago. Friday's gap marks first support at 68 and a close below this level would call for a re-evaluation.
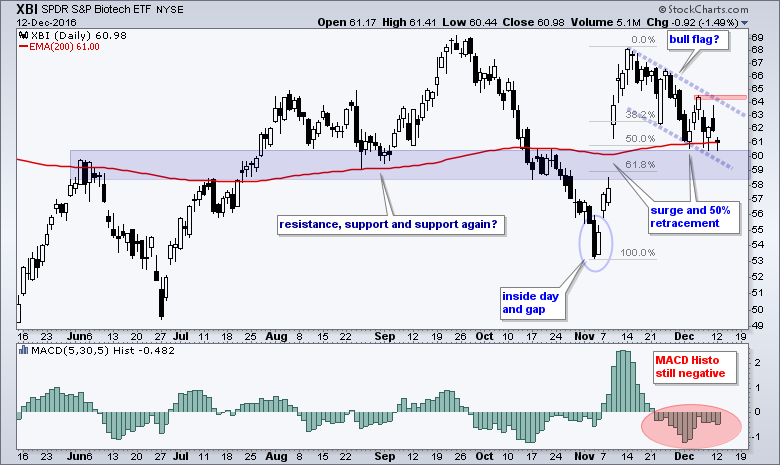
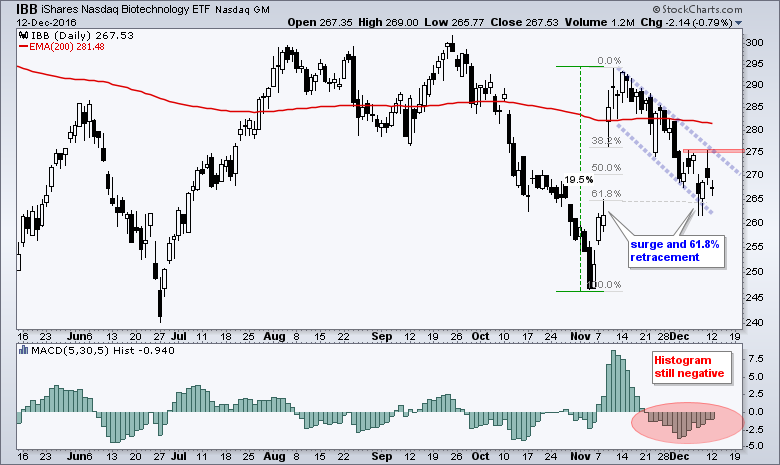
Biotechs Pop and Drop
The Biotech SPDR (XBI) and the Biotech iShares (IBB) tried to reverse on Friday, but fell back on Monday and remain in short-term downtrends. XBI retraced around 50% of the early November surge and firmed near the 200-day EMA the last two weeks. The short-term trend is down, but the pattern looks like a falling flag, which is a bullish continuation pattern. A breakout at 64.5 and positive MACD Histogram would reverse this short-term downtrend. IBB has resistance at 276.
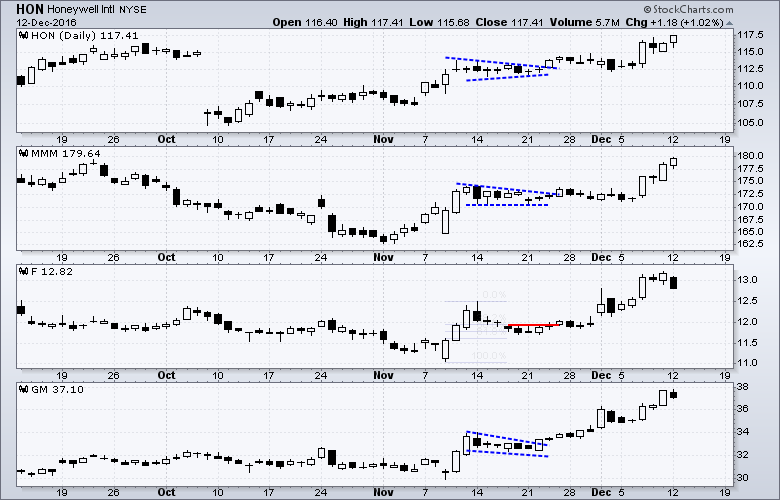
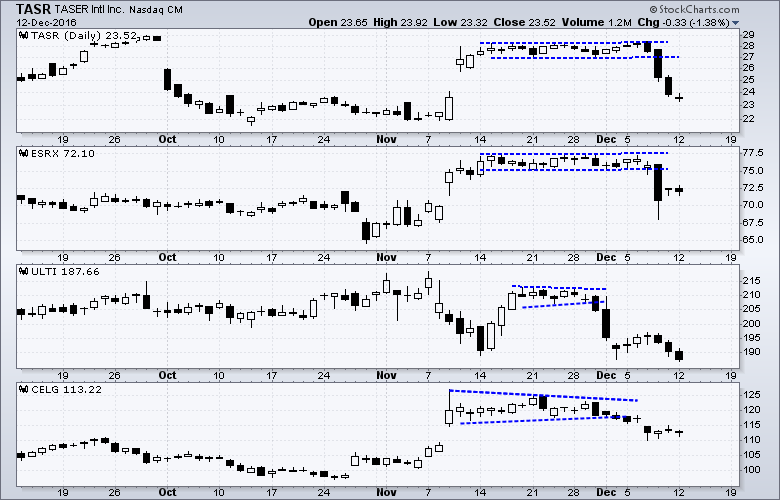
TASR, ESRX and ULTI Show Need for a PLAN
I highlighted a number of stocks over the last two weeks. Some of them performed as expected from the charts and moved higher. Others moved sideways and others moved lower, some sharply lower. HON and MMM were featured on 22-Nov and surged the last five days. F and GM were also featured on 22-Nov and surged over the last two weeks. ACN, XOM, AVGO and PX were highlighted on 5-Dec and these also moved sharply higher.
There were also some big lemons (losers), such as TASR and ESRX, which were highlighted with bullish patterns on 5-Dec. TASR appeared to break out and then promptly fell over 15%. ESRX never broke out and fell over 7-10% with a sharp decline after bad news. I am also reminded of Ultimate Software (ULTI), which was highlighted with a bullish pennant on 29-Nov and promptly fell 8%. Throw in some wishful waiting on healthcare and biotechs (CELG), and you can see the challenge with trading.
This is why we must have a plan before making a trade and we must then trade according to that plan. The goal is not to have any losers. The goal is to win more money on our winners than we lose on our losers. In addition, we need to think long and hard about position sizing. Big positions (10% of portfolio) are much more stressful than small positions (1-5% of portfolio). It is much easier to take a loss on a small position and move on to the next trade. In baseball terms, it is often more prudent to go for base hits instead of home runs.
******************************************************
Spotting Pullbacks and Upturns within an Uptrend using RSI and MACD Histogram.
Defining Bull and Bear Market Environments with Breadth Indicators (plus video).
Backtesting Different Moving Average Pairs with SPY, QQQ and IWM.
ETF Master ChartPack - 300+ ETFs organized in a Master ChartList and in individual groups.
Follow me on Twitter @arthurhill - Keep up with my 140 character commentaries.
****************************************
Thanks for tuning in and have a good day!
--Arthur Hill CMT
Plan your Trade and Trade your Plan
*****************************************


