SystemTrader .... An RSI Mean-Reversion System .... Setting Market Conditions .... System Rules .... Why 5-day RSI and 30/70? .... The Four Backtests .... Key Performance Metrics .... Test Tables: Buy Cross Above/Below 30 and Sell Cross Above/Below 70.... Conclusions - IJR is King .... Further Study .... //// ........
Testing and Tweaking RSI(5) with SPY, QQQ and IJR
The RSI(5) Mean-Reversion trading system is designed to buy on a dip and sell on a bounce. In other words, it buys weakness and sells strength. Typically, the system looks for long setups when the broad market is in an uptrend and stays out when the market is in a downtrend. The original system bought when RSI(5) moved below 30 and sold when RSI(5) moved above 70. Today, I will test some different variations of this system to see if we can improve the results.

Setting Market Conditions
The backtest period extends from 12/01/2000 to 12/01/2016, which covers 16 years of data. I like this testing window because it includes two bear markets, two bull markets and a few periods of extreme volatility. In short, pretty much everything the market can throw at a trader is included.
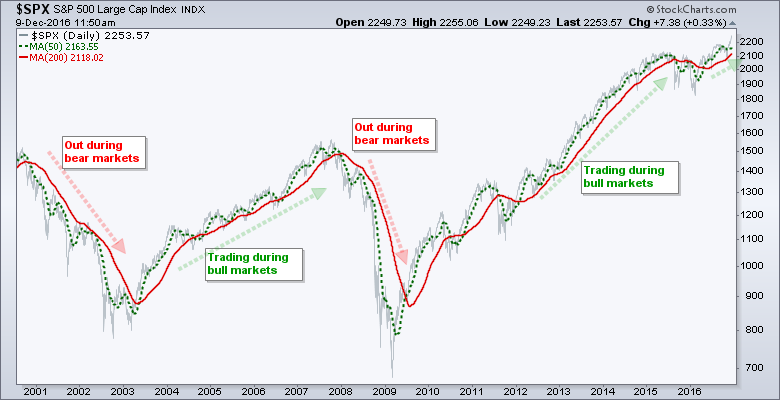
The system looks for long positions when the 50-day SMA is above the 200-day SMA for the S&P 500 (golden cross). The system does not trade when the 50-day SMA is below the 200-day SMA (death cross). I tested with short positions and it is better to be out of the market when the long-term trend is down.
I am using SPY (the tradable benchmark) and the golden-cross system to compare against these mean-reversion systems. Buy-and-hold for SPY from 12/01/2000 to 12/01/2016 returned 5.22% per annum with a 55% max drawdown. In contrast, the golden cross system returned around 7% per annum with a 20% max drawdown.
System Rules
The testing focuses on SPY, QQQ and IJR with daily data. I am using the S&P SmallCap iShares (IJR) instead of the Russell 2000 iShares (IWM) because IJR has consistently outperformed IWM over the last 16 years. Commissions are $10 per trade and the initial portfolio is $100,000. The signals are based on end-of-day data (closing prices) and the buy-sell prices are based on the next day's open.
Why 5-day RSI and 30/70?
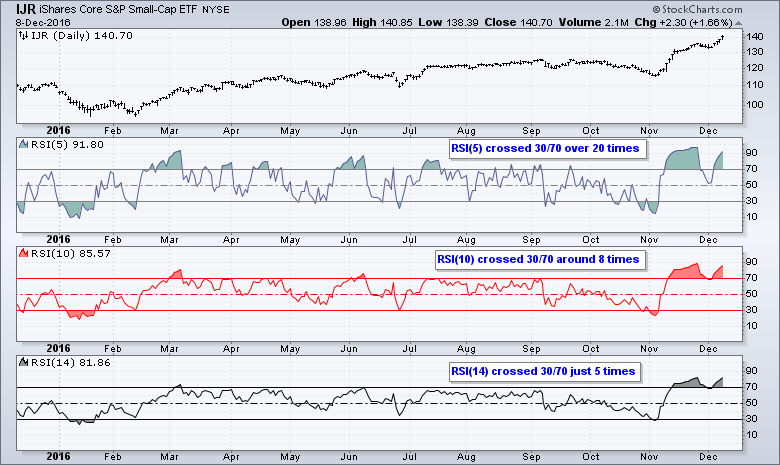
I decided to focus on 5-day RSI because it crosses the 30 and 70 levels quite often. The chart below shows IJR with 5-day, 10-day and 14-day RSI. Notice that RSI(5) crossed the 30/70 thresholds more than 20 times, RSI(10) crossed around 8 times and RSI(14) crossed just 5 times. I also found that the Maximum Drawdowns using RSI(10) and RSI(14) exceeded -20% most of the time. I am using 30/70 to generate signals because these levels are crossed more frequently than 25/75 or 20/80. The drawdowns were generally higher when using the latter levels.
Four Backtests
- 1. Buy on cross below 30 and sell on cross above 70
- 2. Buy on cross below 30 and sell on cross below 70
The first two tests buy on a cross below 30 and do not wait for an upturn. The first test sells on a cross above 70 and does not wait for a downturn. The second test waits for a downturn in RSI by waiting for a cross below 70. Thus, RSI must exceed 70 and then cross back below for an exit.
- 3. Buy on cross above 30 and sell on cross above 70
- 4. Buy on cross above 30 and sell on cross below 70
The second two tests buy when RSI crosses back above 30. In other words, these tests wait for RSI to bounce and turn back up. The third test sells when RSI crosses above 70 and the fourth tests sells when RSI crosses below 70. The fourth tests is quite interesting because it waits for an upturn to buy and then waits for a downturn to sell.
Key Performance Metrics
The tables below show each test with eight key metrics. There are dozens of ways to evaluate a trading system and everyone has their favorite methods. I have decided on these eight to keep it fairly simple.
- The Compound Annual Return (CAR) is important because we need a system with positive expectations (higher is better).
- The exposure shows the percentage of time the system is in a trade. We don't want a system that trades just 10% of the time.
- The Risk-adjusted Return (RAR) shows the Compound Annual Return adjusted for exposure (higher is better)
- The Maximum Drawdown (MDD) is the biggest percentage loss for the portfolio (lower is better).
- The CAR/MDD Ratio shows the return relative to the drawdown (higher is better). I think this is one of the most important metrics because it shows your return relative to risk.
- Win% shows the percentage of winning trades.
Keep in mind that these results are based on taking every trade and following the system without deviation. The system does not take into account earnings season, jobs reports, elections or full moons!
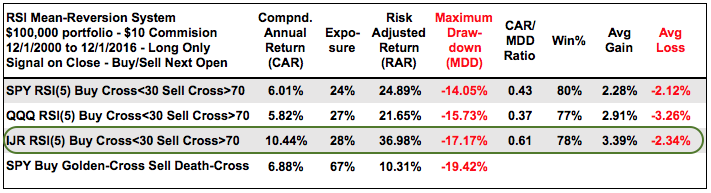
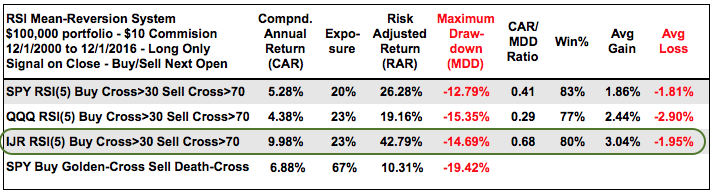
Test 1: Buy Cross Below 30 and Sell Cross Above 70
The table below shows results for the first backtest with the SPY golden-cross results at the bottom for reference. IJR is the clear winner (green oval) because its Compound Annual Return is much higher than the other two. Despite the second highest MDD, notice that the CAR/MDD Ratio (.61) is also much higher than the other two. This indicates that the higher risk (MDD) is being offset by a higher return (CAR).
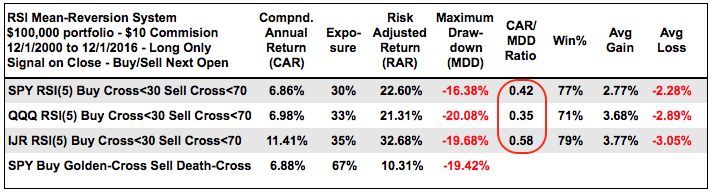
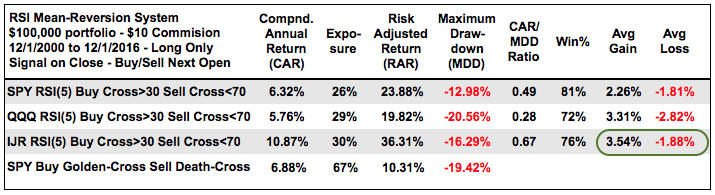
Test 2: Buy Cross Below 30 and Sell Cross Below 70
The next table shows results for the second backtest and IJR is again the clear winner. Even though the Compound Annual Returns are higher than in the first backtest, the Maximum Drawdowns are also higher. In fact, notice that the CAR/MDD ratios are lower for all three (red oval). This means the increase in returns (CAR) is not being offset by the increase in risk (MDD).
Test 3: Buy Cross Above 30 and Sell Cross Above 70
The next table shows results for the third backtest and IJR is again the clear leader. The Compound Annual Return is almost double that of SPY and the CAR/MDD ratio is the highest of all the testing (.68). This shows the most return relative to risk.
Test 4: Buy Cross Above 30 and Sell Cross Below 70
The next table shows the fourth backtest to make it a clean sweep for IJR. This test is especially interesting because it waits for an upturn to buy (cross above 30) and downturn to sell (cross below 70). The Average Gain (3.54%) and Average Loss (1.88%) are the standout metrics for IJR because this gain/loss ratio is the highest of all the tests (3.54/1.88 = 1.88).
Conclusions - IJR is King
Even though I tested four different systems, there are many similarities with these systems. First, the exposure ranged from 20% to 35% and this means trading money was tied up less than a third of the time. These are not full-time systems that are ALWAYS on a signal. Second, the Win% was extraordinarily high and averaged 78% for all 12 systems. This is typical for mean-reversion systems. The table below shows all the results with an added column (Average Gain/Average Loss Ratio). I circled the best results for each column to see which ETF/System stands out.
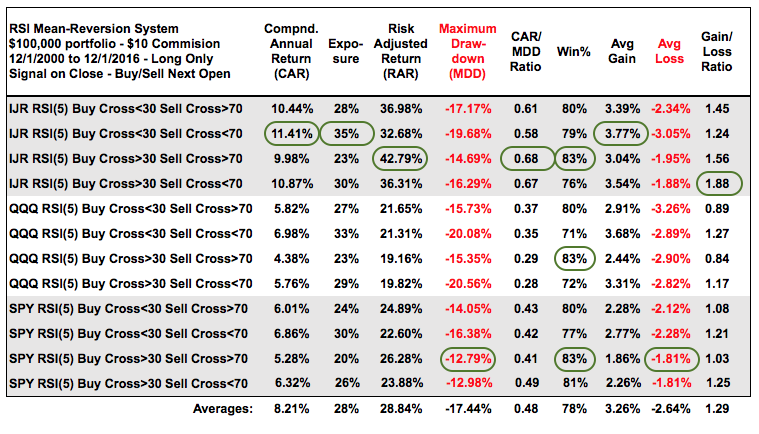 Most of the green can be found on the IJR lines, which makes IJR the best of the three ETFs. In particular, I am impressed with the CAR/MDD ratios of .68 and .67 in lines three and four. Even though SPY and QQQ still have positive expectations with the RSI(5) strategy and the returns are decent, IJR is clearly the king with Compound Annual Returns averaging more than 10% per year. Expect to see IJR a lot more in the commentaries. Next week I will look at these systems with a Chandelier Exit. Preliminary results suggest that the Chandelier Exit does NOT increase returns, but it does increase exposure.
Further Study
The inspiration for this trading system came from the 2-period RSI system, which was developed by Larry Connors and Cesar Alvarez. You can read more about the 2-period RSI system in our ChartSchool article. You can also read more about trading systems and RSI(2) at AlvarezQuantTrading.com. The blog posts here deal with trailing stops, scaling and, of course, RSI(2).
These trading strategies were tested using Amibroker with the help of Cesar Alvarez of AlvarezQuantTrading.com. For more information about his testing and consulting services, click here.
******************************************************
Other Articles in the SystemTrader Series:
- Introduction to Key Performance Metrics - Quantifying the Golden Cross for the S&P 500
- Golden Cross and 5 Major Indexes - EMAs versus SMAs - Do Short Positions Add Value?
- Short-term Moving Average Crosses - Differences in Major Indexes - Do Trend Filters Work?
- MACD Crosses - Rules to Reduce Drawdowns and Increase Gains - Testing PPO Strategy
Follow me on Twitter @arthurhill - Keep up with my 140 character commentaries.
******************************************************
Thanks for tuning in and have a good day!
--Arthur Hill CMT
Plan your Trade and Trade your Plan
******************************************************


