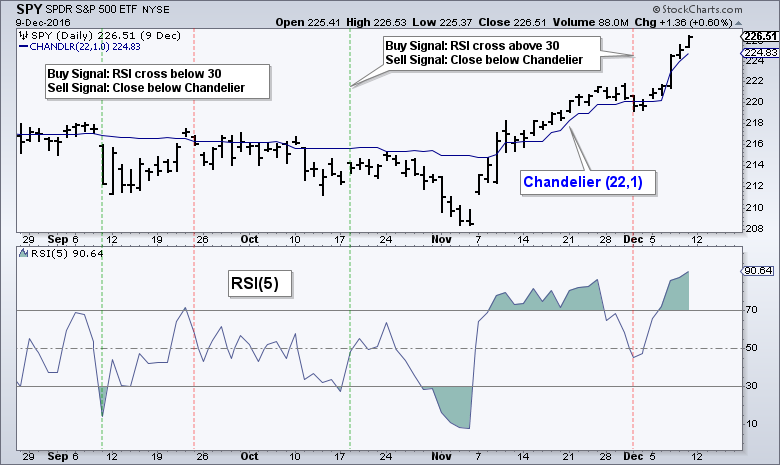
Last week's System Trader article tested a mean reversion system using 5-day RSI for entries and exits. This article will test a system using 5-day RSI for entries and the Chandelier Exit for exits. This is an attempt to trail the stop-loss and ride some winners. This is a short-term mean-reversion trading system that seeks to buy dips within a bigger uptrend. The system then sells when price bounces and then moves below the Chandelier Exit.
Defining the Chandelier Exit
Let's first review the Chandelier Exit. Developed by Charles Le Beau, the Chandelier Exit uses a recent high and the Average True Range (ATR) to create a trailing stop. This system only trades long positions so I will cover the Chandelier Exit (long). There are two parameter settings in SharpCharts: the look-back period for ATR and the highest high, and the number of ATR values from this high. A Chandelier Exit (22,2) would use a 22-period ATR and the 22-period high. The indicator would then be plotted two ATR values below this high and trail higher as long as prices move higher.
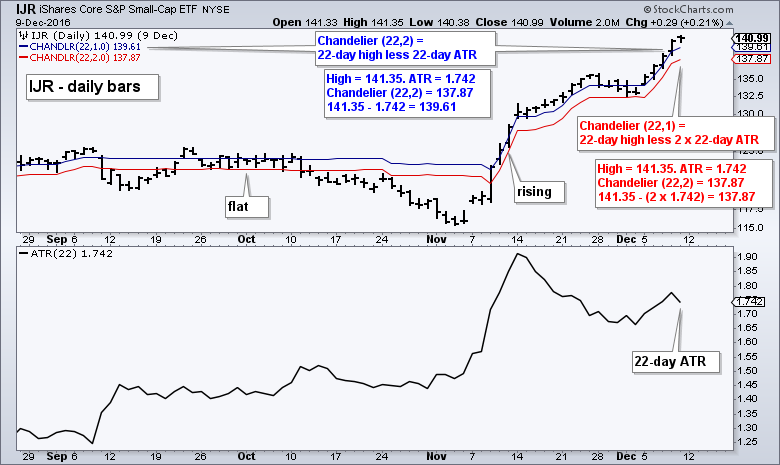
The chart above shows IJR with the Chandelier (22,2) in blue, the Chandelier (22,1) in red and 22-period ATR. The 22-day high is the most recent high (141.35). Notice how the Chandeliers were flat in September-October because the 22-day high remained relatively stable. The Chandeliers started rising when IJR started making new 22-day highs in mid November. Also notice how the Chandelier (22,1) is closer to price than the Chandelier (22,2). This is a tighter stop.
Market Conditions and System Rules
The backtest period extends from 12/01/2000 to 12/01/2016, which includes two bear markets, two bull markets and a few periods of extreme volatility. The system looks for long positions when the 50-day SMA is above the 200-day SMA for the S&P 500 (golden cross) and does not trade when the 50-day SMA is below the 200-day SMA (death cross).
The testing focuses on SPY, QQQ and IJR with daily data. Commissions are $10 per trade and the initial portfolio is $100,000. The signals are based on end-of-day data (closing prices) and the buy-sell prices are based on the next day's open.
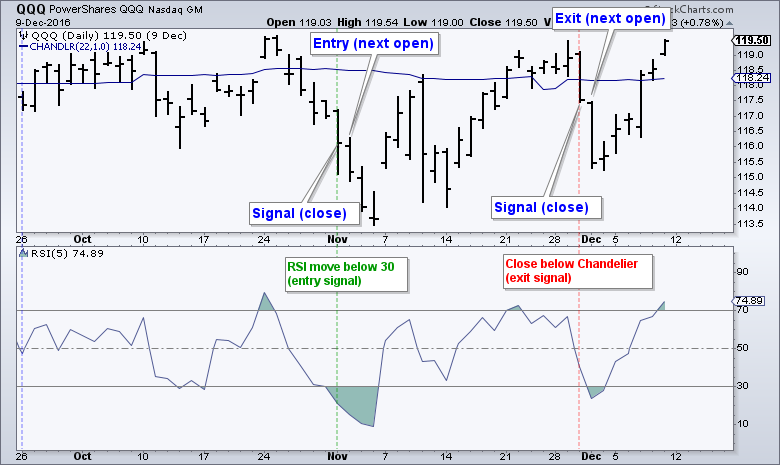
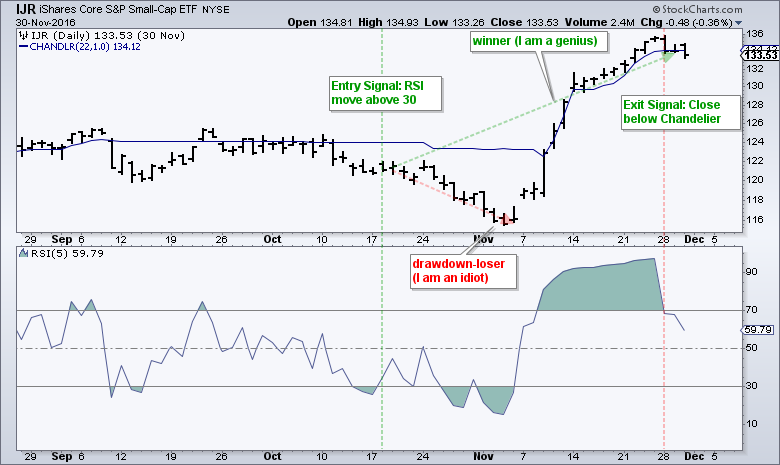
The chart above shows QQQ with an example of a buy signal on the 1-Nov close, an entry on the 2-Nov open, a sell signal on the 30-Nov close and an exit on the 1-Dec open. There are NO stop-losses in this system. Notice that an exit signal is not possible until price moves above the Chandelier Exit. The actual signal then triggers when price moves below the Chandelier Exit.
Four Backtests
The backtest covers buy signals when RSI moves below and above 30. Buy signals on a cross below 30 trigger without waiting for a bounce. Buy signals on a cross above 30 trigger after a bounce. Subsequent sell signals are based on the Chandelier Exit (22,1) and Chandelier Exit (22,2). This means there will be four different tests on three ETFs (12 total tests).
1. Buy RSI cross below 30. Sell price close below Chandelier (22,2)
2. Buy RSI cross below 30. Sell price close below Chandelier (22,1)
3. Buy RSI cross above 30. Sell price close below Chandelier (22,2)
4. Buy RSI cross above 30. Sell price close below Chandelier (22,1)
Backtests 1 and 2
1. Buy RSI cross below 30. Sell price close below Chandelier (22,2)
2. Buy RSI cross below 30. Sell price close below Chandelier (22,1)
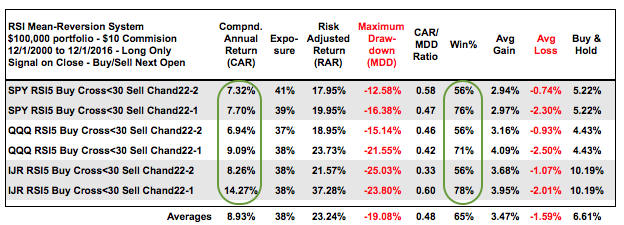
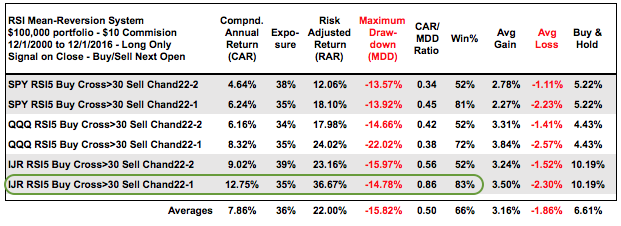
The first tests buy when RSI moves below 30 (catch the falling knife). The table below is sorted by the ETF and then by the Chandelier Exit to compare different exits with each ETF. Notice that the Compound Annual Return (CAR) and the Win% increase when the Chandelier Exit is tightened from (22,2) to (22,1). The Maximum Drawdown increased for SPY and QQQ, but decreased for IJR. Overall, I think IJR is the best on this table because it has the highest CAR by far, the highest CAR/MDD ratio and the highest Win%.
Backtests 3 and 4
3. Buy: RSI cross below 30. Sell price close below Chandelier (22,1)
4. Buy: RSI cross above 30. Sell price close below Chandelier (22,1)
The next tests buy when RSI moves above 30 (wait for a bounce) for a buy and then use the two Chandelier Exits. Again, notice that the Compound Annual Return (CAR) and Win% improve with the tighter exit (Chandelier 22,1) for SPY, QQQ and IJR. I am especially impressed with IJR using the Chandelier (22,1) because of the high CAR/MRR ratio (.86) and Win% (83%).
Comparing the Results
Looking at the two tables, it is clear that the tighter of the two exits improved the results (Chandelier (22,1)). I noticed that the Compound Annual Return was generally higher when catching the falling knife (first table) and the Maximum Drawdowns were generally less when waiting for RSI to move back above 30 (second table). This looks like a classic trade-off of less return for less risk. It seems that QQQ and SPY perform better when buying an RSI cross below 30 (first table) and IJR performs better when buying an RSI cross above 30 (second table). This is not surprising because large-caps act different than small-caps. IJR is clearly the best performer on both tables.
Plotting the Equity Curve
The image below shows the equity curve when backtesting IJR using Amibroker (buy RSI cross above 30 and sell Chandelier 22,1). This is basically the running P&L since December 2000. The flat lines in 2001-2002, 2008 and 2014-2015 show when the 50-day SMA for the S&P 500 was below the 200-day SMA and there were no trades. This system clearly performs well during bull markets and even outperforms the broader market. It also preserves capital during bear markets, which is essential.
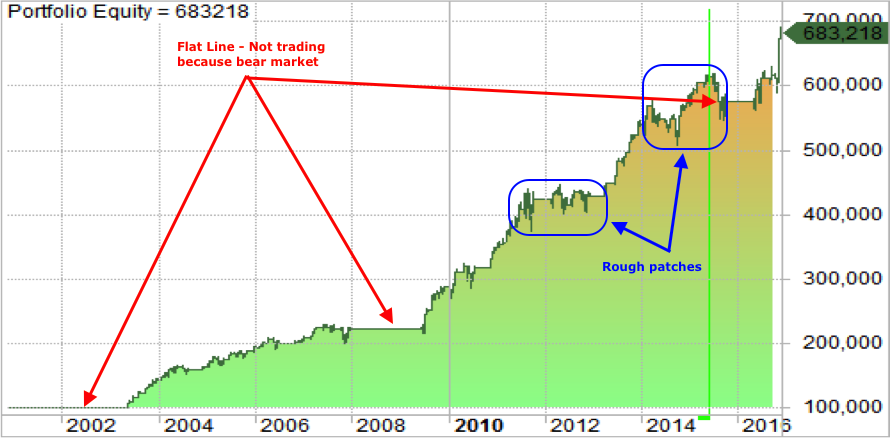
Choppy markets make for tough trading. The system also went through rough patches in 2011-2012 and 2014-2015 as the market turned quite choppy and small-caps underperformed. The S&P 500 triggered a golden cross in mid April 2016 and the equity curve turned back up in May. Here is performance for the last three years: 2014 (+6.0%), 2015 (-.3%) and 2016 (+18.6%). The equity curve is not straight up, but the trend is clear and the system does a pretty good job of curtailing losing during rough patches. Note that the surge in profitability over the last few months pushed the equity curve to a new high.
Conclusions
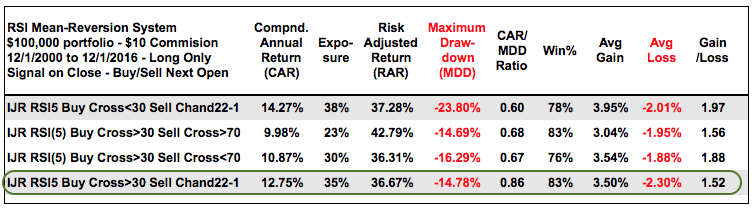
The table below shows two system tests from last week and two from this week. Overall, I am impressed with the IJR system that waits for RSI to cross above 30 and then uses the Chandelier Exit (22,1). The last row highlights this system with the second highest CAR, the second lowest MDD, the second highest exposure and the highest CAR/MDD ratio. It does, however, have the lowest gain/loss ratio, but the winning percentage is quite high. Over the 16 year test period, this particular system generated 80 trades and was in the market 35% of the time (5.6 years or 67.2 months). It is not a full-time system.
Even though the results for IJR look pretty good, keep in mind that past performance does not guarantee future performance. Also keep in mind that this system will perform differently for other ETFs and stocks. The results based on taking EVERY trade and STICKING with the system, which can be hard in real life. The chart below shows IJR with an entry signal on October 18th and subsequent 4.8% decline (drawdown). There are no stops and this system does not even consider an exit until price moves above the Chandelier, which occurred right after the election. The exit triggered on 28-Nov and IJR advanced another 3-5% afterwards. The system is far from perfect, but neither are traders.
Further Study
These trading strategies were tested using Amibroker with the help of Cesar Alvarez of AlvarezQuantTrading.com. For more information about his testing and consulting services, click here. The inspiration for this trading system came from the 2-period RSI system, which was developed by Larry Connors and Cesar Alvarez. You can read more about the 2-period RSI system in our ChartSchool article. You can also read more about trading systems and RSI(2) at AlvarezQuantTrading.com. The blog posts here deal with trailing stops, scaling and, of course, RSI(2).
******************************************************
Other Articles in the SystemTrader Series:
- Introduction to Key Performance Metrics - Quantifying the Golden Cross for the S&P 500
- Golden Cross and 5 Major Indexes - EMAs versus SMAs - Do Short Positions Add Value?
- Short-term Moving Average Crosses - Differences in Major Indexes - Do Trend Filters Work?
- MACD Crosses - Rules to Reduce Drawdowns and Increase Gains - Testing PPO Strategy
Follow me on Twitter @arthurhill - Keep up with my 140 character commentaries.
******************************************************
Thanks for tuning in and have a good day!
--Arthur Hill CMT
Plan your Trade and Trade your Plan
******************************************************


