SPY Stalls with 3 Inside Days .... QQQ Stalls after New High .... Four Flags for Four Sector SPDRs .... Housing ETFs Pullback within Uptrend .... A Large Continuation Pattern for HACK .... Metals & Mining SPDR Becomes Oversold .... Webinar Preview .... //// ....
SPY Stalls with 3 Inside Days ....
The major index ETFs stalled over the last few days with SPY forming three consecutive inside days. This means the high-low range of each candle was within the high-low range of the prior candle (3 days in a row). This shows short-term indecision and reflects a stalemate between buying pressure and selling pressure. Three consecutive inside days is indeed a rare occurrence, but double and triple inside days are not. The chart below shows two inside days in July, three in August, two in early October and two in mid November (blue ovals).
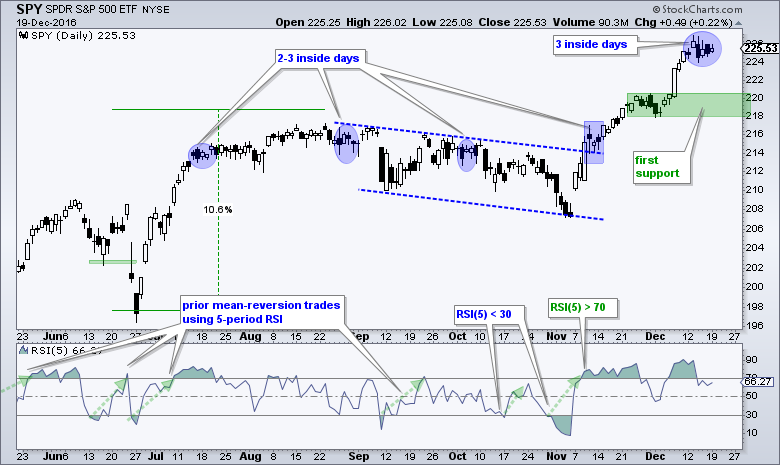
While inside days can sometimes foreshadow a short-term reversal, keep in mind that the bigger trend is up and this is a consolidation after a sharp advance. In other words, it is a bullish continuation pattern. A breakout at 226 would end the consolidation and signal a continuation of the mid December surge. Should SPY break below 224 instead, I would mark first support in the 218-220 area. This support zone is a guesstimate and the bigger uptrend remains the dominant force. This means I am not interested in trading short-term support breaks, bearish setups, bearish signals or bearish patterns. Instead, I am interested in trading short-term oversold conditions, bullish patterns and bullish setups.
QQQ Stalls after New High
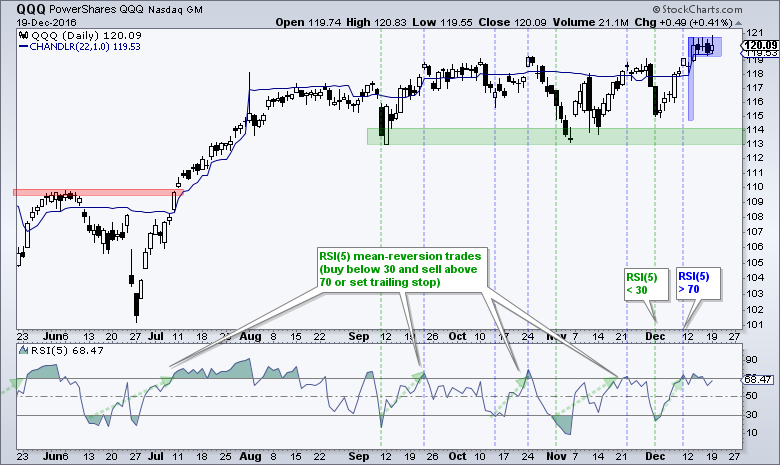
QQQ recorded a 52-week high with a surge above 120 last week and then stalled the last four days. Again, this is a stall after a sharp advance (115 to 120) and the big trend is clearly up. A few annotations reveal a bull flag taking shape and this is also a bullish continuation pattern. While a break below 119 would seem negative, I would not consider it that bearish because bigger uptrend rules and it could be part of a slow grind higher.
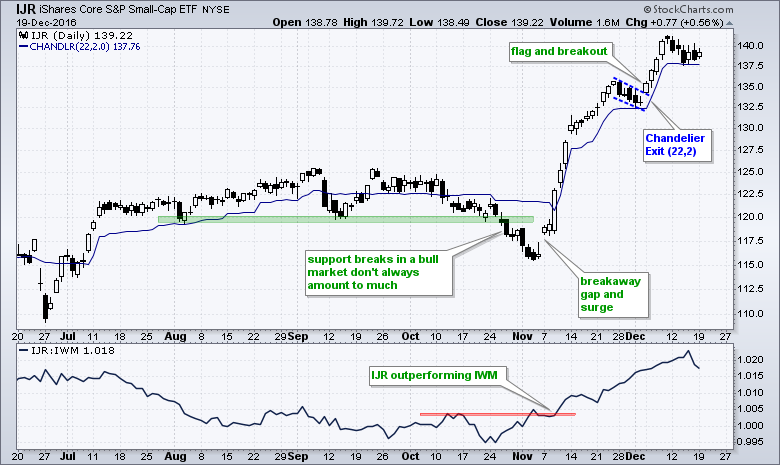
IJR pulled back last week and then stalled just above the Chandelier Exit the last three days. The flag breakout was the last bull signal and the Chandelier Exit is set at 137.76 - a close below this level would trigger a stop. Chartists using the Chandelier (22,1) would have been stopped out already.
Four Flags for Four Sector SPDRs
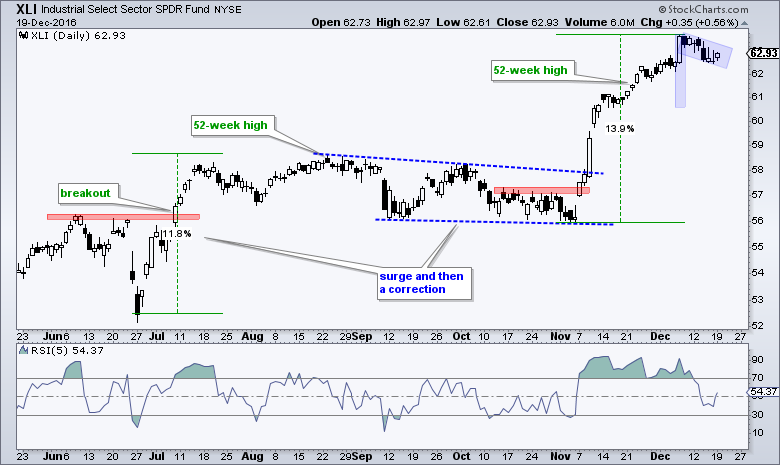
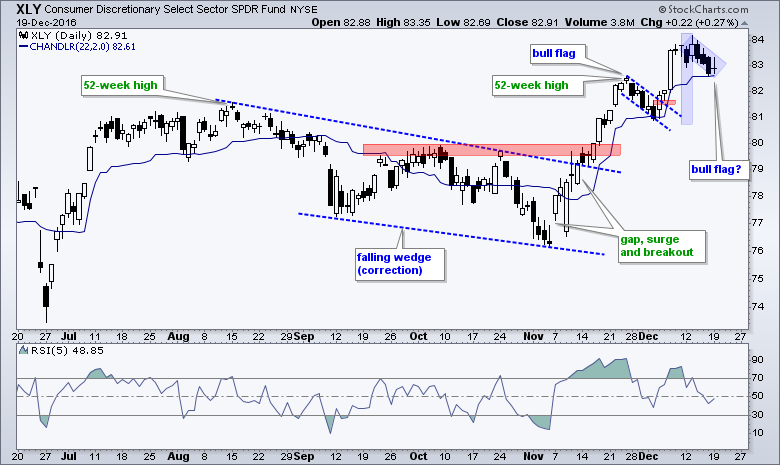
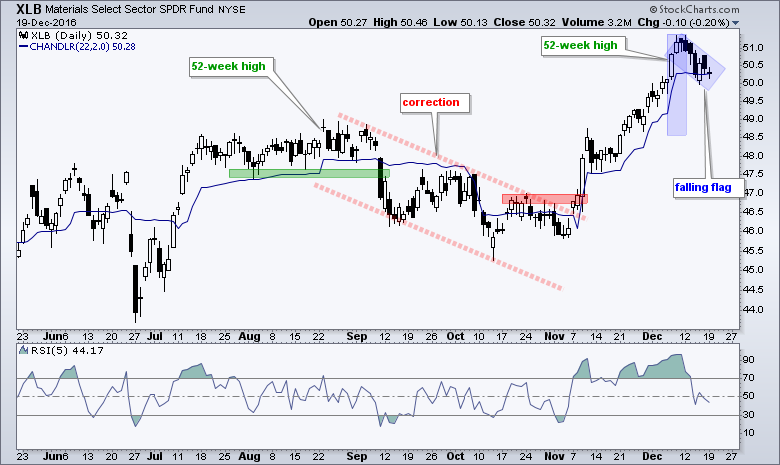
There are quite a few flags, pennants and wedges forming over the last 1-2 weeks. There are two ways to play these: buy on the breakout or buy within the pattern in anticipation of a breakout. The choice is YOURS. These are short-term patterns that will likely require monitoring over the holidays and this does not fit my plans because I am taking off between Christmas and New Years. Even if we see short-term weakness, I think it would bring out buyers because of the bigger uptrends.
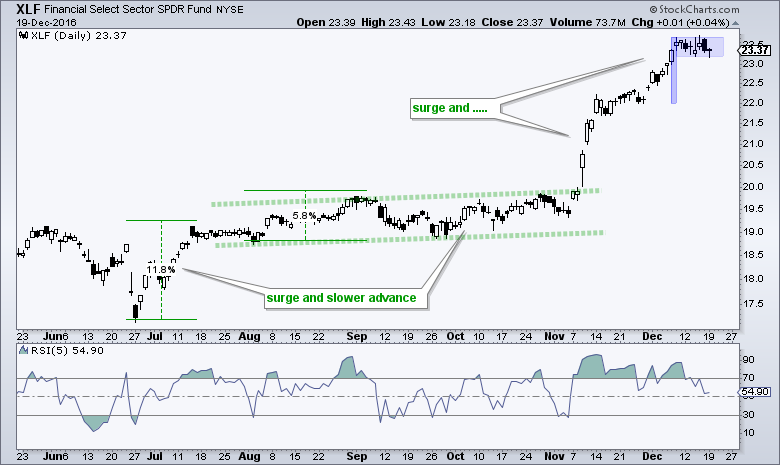
XLF has a bull flag working and RSI(5) is near the 50. Momentum oscillators pullback to their centerlines during a consolidation period. XLF became short-term overbought after the surge from 22 to 23.7 and worked off this condition with the flat consolidation.
Housing ETFs Pullback within Uptrend
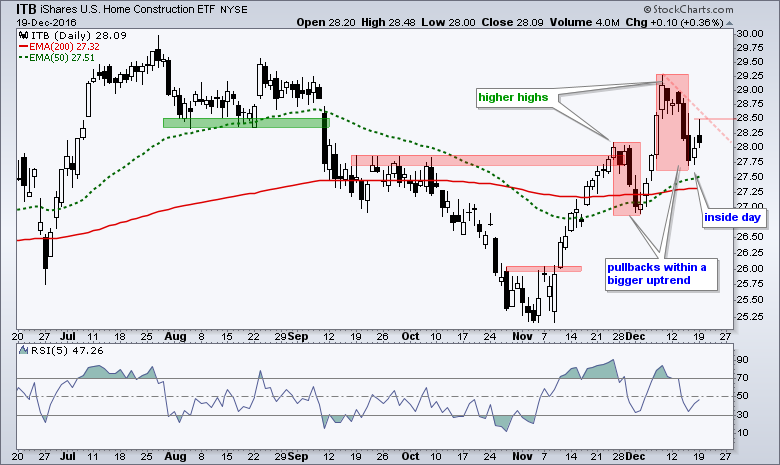
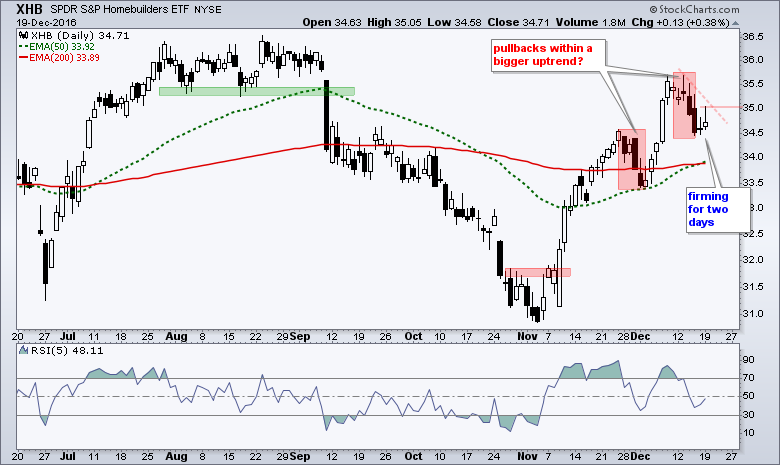
The Home Construction iShares (ITB) and the Home Builders SPDR (XHB) appear to have reversed their downtrends with surges in November and early December. They are trading above their 200-day EMAs and their 50-day EMAs are above their 200-day EMAs. Both pulled back sharply last week, but it was not enough to push RSI(5) below 30 (short-term oversold). We do not always get oversold readings on pullbacks and sometimes need to focus on price for a setup. An inside day formed on Friday and the stock bounced on Monday, but the close was not very strong. Look for follow through above 28.50 to signal a continuation of the bigger uptrend. Note that I will cover several housing stocks in today's webinar.
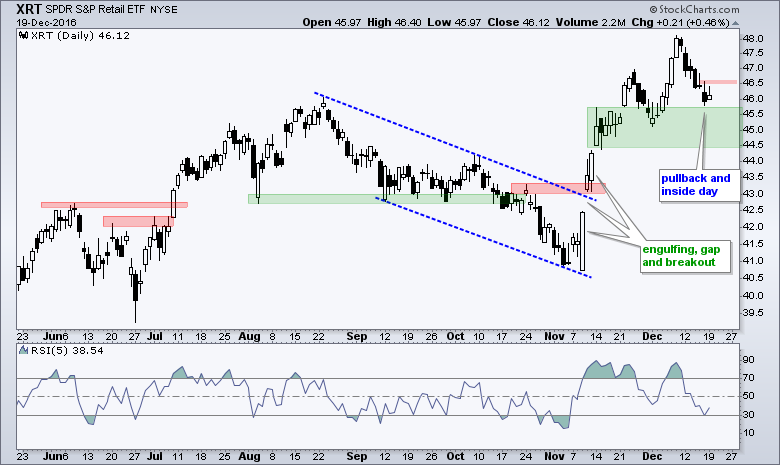
The Retail SPDR (XRT) almost became short-term oversold as RSI(5) hit 30.14 on Friday. The ETF formed an inside day on Monday to denote indecision. Look for a break above 46.6 to trigger a short-term reversal.
A Large Continuation Pattern for HACK
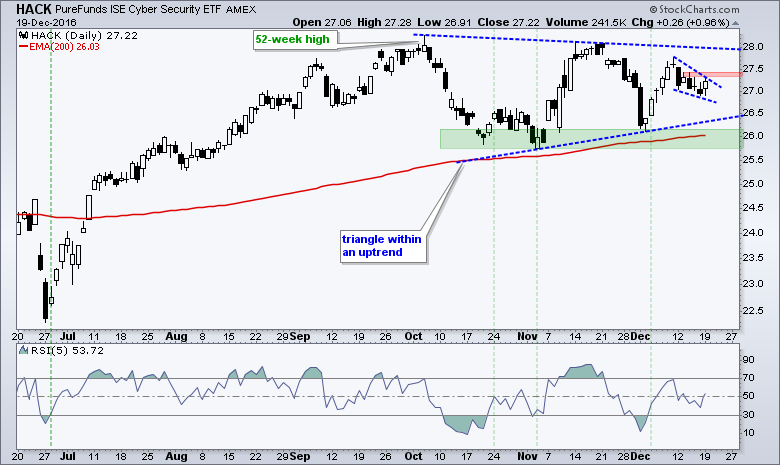
The Cyber Security ETF (HACK) is looking quite interesting because the long-term trend is up and the ETF is forming a large triangle consolidation. Within this triangle, HACK bounced off support in early December and corrected with a small wedge the last six days. Look for a break above 27.5 to reverse this wedge. Look for a move above 28 to break triangle resistance. JNPR, CHKP, TMICY, CSCO and SYMC are the five largest holdings and they account for around 25% of the ETF. Note that I will cover several stocks from this group in today's webinar.
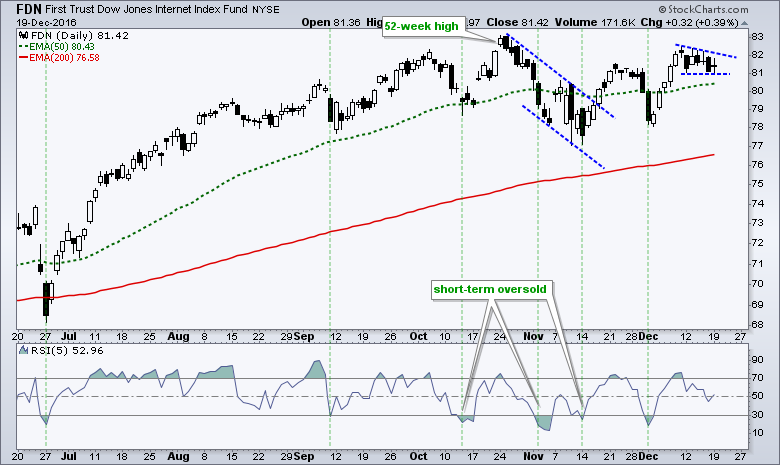
The Internet ETF (FDN) has a pennant working after a surge in early December.
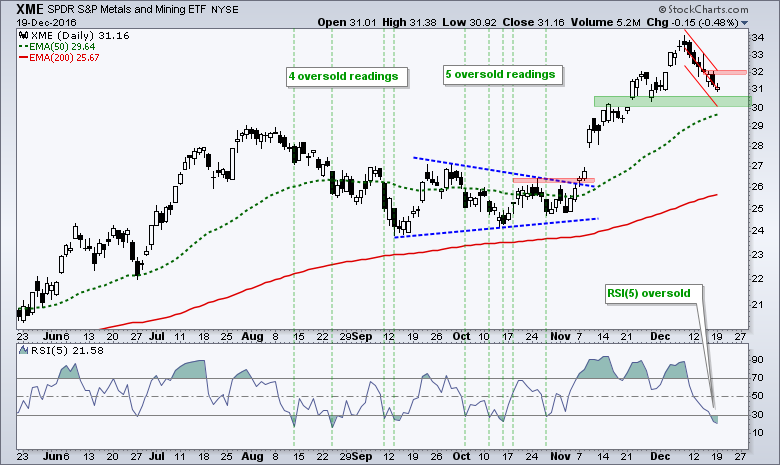
Metals & Mining SPDR Becomes Oversold
The Metals & Mining SPDR (XME) became short-term oversold with a decline below 31. A small Raff Regression Channel defines the two week slide with resistance set at 32.10. Note that RSI(5) became oversold 4 times in August-September and five times in October. Oversold conditions sometimes extend.
 ******************************************************
Spotting Pullbacks and Upturns within an Uptrend using RSI and MACD Histogram.
Defining Bull and Bear Market Environments with Breadth Indicators (plus video).
Backtesting Different Moving Average Pairs with SPY, QQQ and IWM.
ETF Master ChartPack - 300+ ETFs organized in a Master ChartList and in individual groups.
Follow me on Twitter @arthurhill - Keep up with my 140 character commentaries.
****************************************
Thanks for tuning in and have a good day!
--Arthur Hill CMT
Plan your Trade and Trade your Plan
*****************************************


