----- Webinar Video ----- Art's Charts ChartList -----
S&P 500 Extends Volatility Contraction .... The Next Bullish Setup for SPY .... IJR Fails to Hold Flag Break .... Housing ETFs Take a Hit, but Breakouts Remain .... Retail ETF Bucks the Selling Pressure .... Airline ETF Fails to Hold Breakout .... iShares Aerospace & Defense ETF Forges Falling Wedge .... Metals & Mining SPDR Holds Near Highs .... Webinar Preview .... Food for Thought Videos .... //// ....
S&P 500 Extends Volatility Contraction
The S&P 500 opened weak, declined over 1% at its low point and ended the day with a whopping .62% loss on Monday. There has been a lot of talk about the number of days since a decline greater than 1% so I will weigh in with some perspective. This eight-month bar chart shows the one-day Rate-of-Change in the indicator window with horizontal line at +1% and -1%. The 1-day ROC (pronounced rock) exceeded +1% or -1% fifteen times since June (169 trading days). This means the S&P 500 gained or lost more than 1% less than 10% of the time. Put another way, price movements were less than 1% more than 90% of the time. The index has not moved more than 1%, up or down, since December 7th. This tells us we are in the midst of a volatility contraction of sorts.
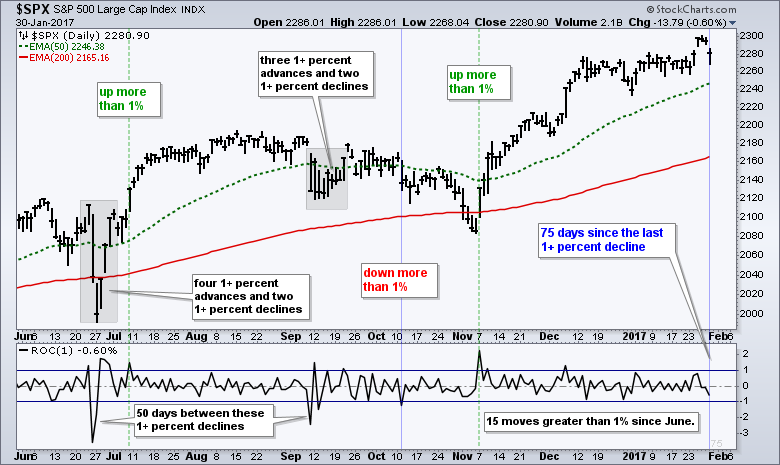
The index has currently gone 75 days without a decline greater than 1%. Note that the last stint lasted 50 days from June 28th to October 11th. These stats are "interesting" but sometimes hard to trade. However, I would note that a price move greater than 1% does seem to have some significance. After an extended advance, a decline greater than 1% acts as a downward momentum thrust that could lead to further weakness (October 12th). Similar, after a decline, an advance greater than 1% acts as an upward momentum thrust that can lead to further gains (June 28th, July 8th and November 7th). We can also see periods of volatile when we get multiple 1% moves in both directions (gray boxes).
There are two things we need to ask ourselves when a new price bar is added to the chart. Did this bar change the trend? Did this bar change the setup or pattern? Monday's modest decline certainly did not change the long-term uptrend. The index recorded a 52-week high three days ago and is certainly entitled to a correction. For patterns, the index broke out of a pennant last week and this breakout is being challenged. A close below 22.75 would negate this breakout.
The Next Bullish Setup for SPY
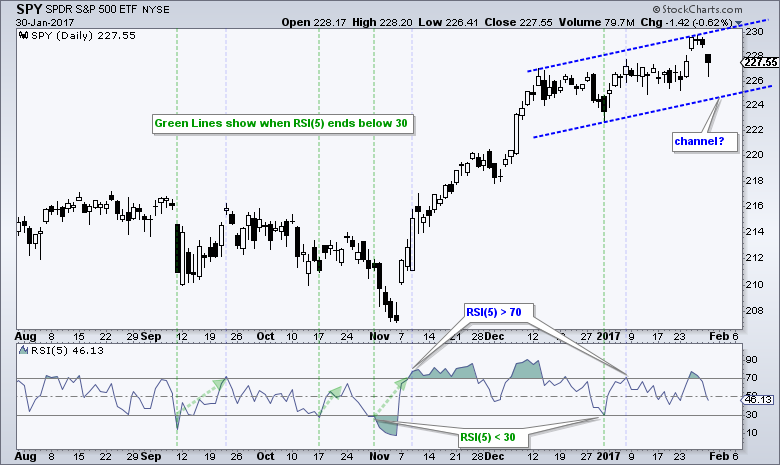
SPY gapped up on Wednesday, stalled on Thursday-Friday and gapped down on Monday. Technically, this is an island reversal. However, it is a short-term bearish reversal pattern and the bigger trend is clearly up. I am, therefore, ignoring this pattern and looking for the next bullish setup. I am only looking for patterns in harmony with the bigger trend. Think bullish in uptrends. This means an RSI move below 30 would provide a short-term mean-reversion setup (pullback within an uptrend). On the price chart, I drew the upper trend line first and then added a lower trend line that is parallel. This line marks a potential short-term reversal area around 225.
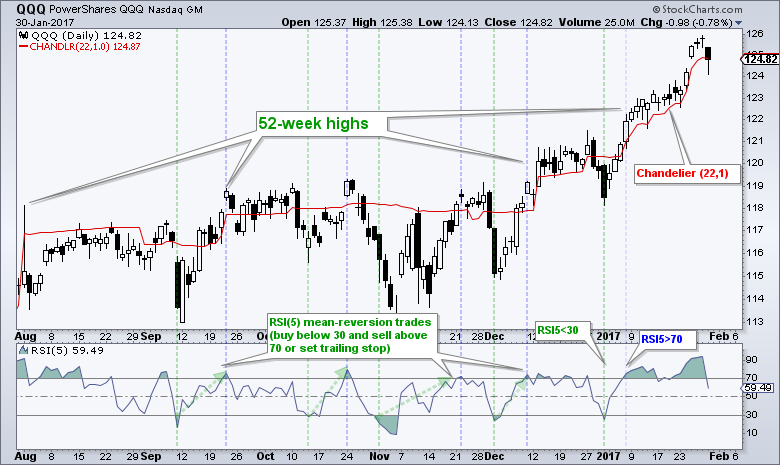
QQQ finally closed below the Chandelier Exit (22,1) on Monday, seventeen days after RSI(5) became oversold and fifteen days since RSI(5) moved above 70. There is not much to add on this chart. The big trend is up and I will wait for the next short-term bullish setup (pullback).
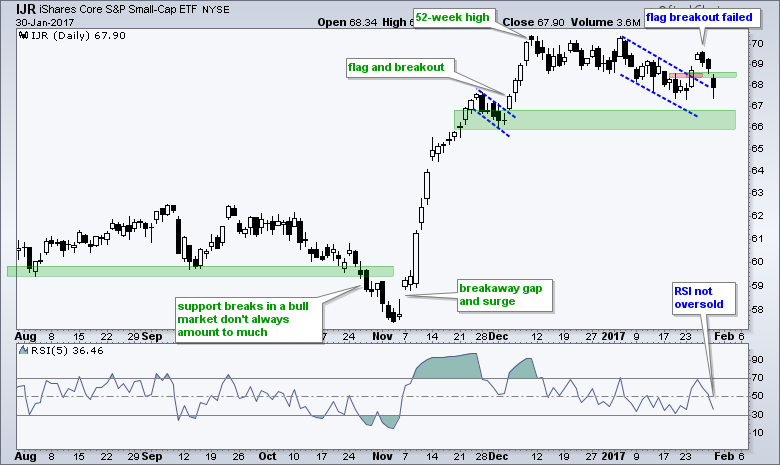
IJR Fails to Hold Flag Break
IJR fell by more than 1% as high-beta stocks led the sell off. On the price chart, IJR failed to hold its flag breakout as it moved back below the breakout zone. This is the challenge with playing breakouts. Compared to a mean-reversion strategy, risk is almost always higher when playing a breakout strategy because the entry price is invariably higher. As far as a mean-reversion strategy is concerned, the next setup will trigger when RSI(5) moves below 30.
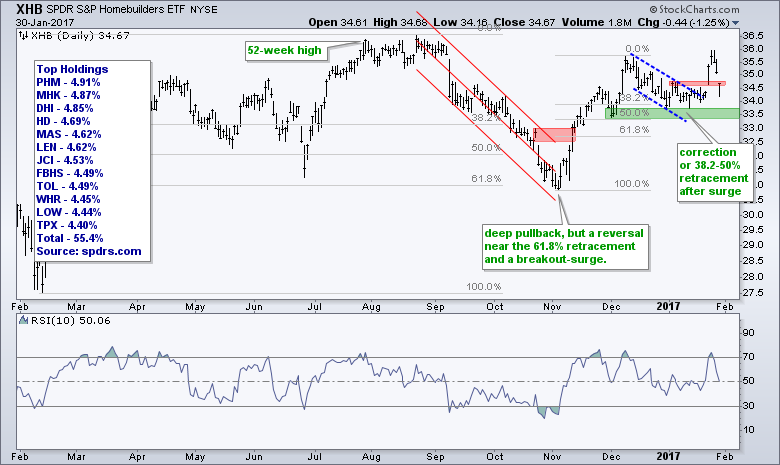
Housing ETFs Take a Hit, but Breakouts Remain
Housing stocks were in the news after Tempur-Pedic (TPX) fell over 25% on news it was terminating its contract with Mattress Firm. TPX is part of the Home Builders SPDR (4.4% weighting), but not part of the Home Construction iShares (ITB). Needless to say, this decline hurt XHB a lot more. The first chart shows XHB with a typical correction from mid December to mid January and a big breakout last week. I call this a typical correction because a falling flag/channel formed and the correction retraced 38-50%. XHB fell back to the breakout zone with Monday's loss. The breakout is now under threat, but this move does not change the overall chart, as far as I am concerned. I would not consider turning bearish unless XHB breaks the December lows. Note that Home Depot (HD), which accounts for 4.69% of XHB, closed up on Monday and hit a 52-week high last week. I consider HD a better bellwether than TPX.
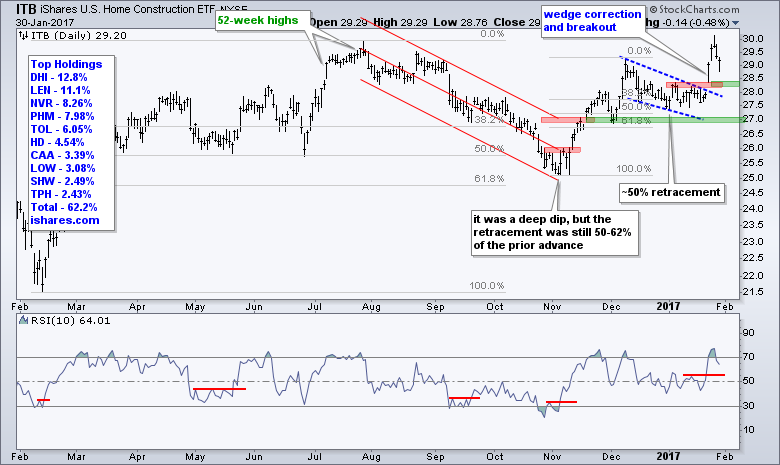
The next chart shows ITB breaking out and holding well above its breakout. Even if ITB pulls back further, I would watch for support in the 28-28.5 area.
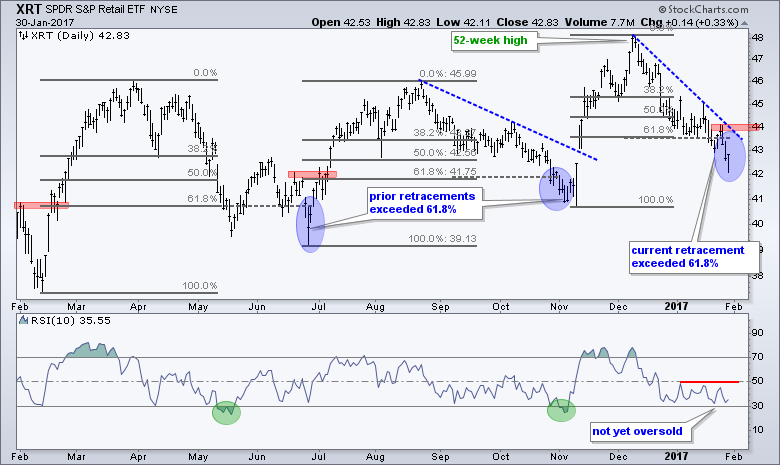
Retail ETF Bucks the Selling Pressure
Most stocks, sectors and industry groups declined on Monday, but the Retail SPDR (XRT) bucked the selling pressure and closed slightly higher. I featured this chart last week and the trend/setup remains the same. First, the overall trend appears to be up with higher lows and 52-week high in early December. Second, the three declines exceeded their 61.8% retracements (blue ovals), but held above the prior low. This, overshoots on pullbacks seem to be normal. XRT dipped to 41.11 intraday on Monday and then bounced to close at the high-of-the-day. A follow through breakout at 44.2 would reverse the seven week downtrend.
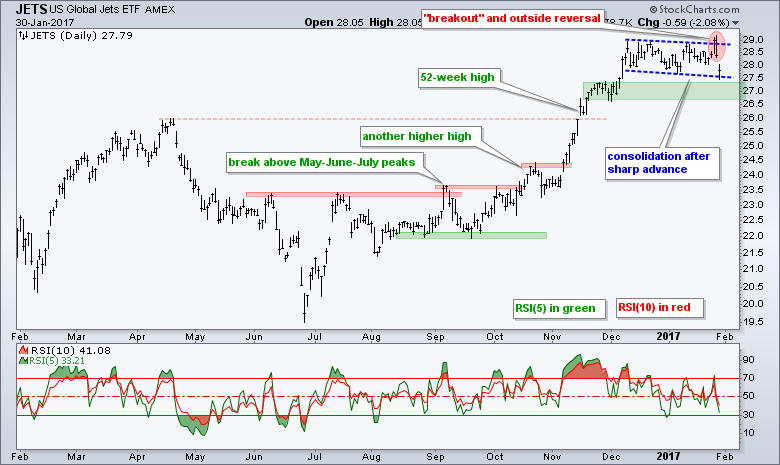
Airline ETF Fails to Hold Breakout
Airlines got whacked over the last two days as the Airline ETF (JETS) formed an outside reversal on Friday and gapped down on Monday. This means the flag breakout has failed and this again highlights the challenges with playing breakouts. Mean-reversion trading is not without its challenges, but breakout trades seem to carry more downside risk. The failed breakout, outside reversal and gap are short-term issues, but the bigger trend is up and this means I am looking for a bullish setup to unfold. This could be a move into the green support zone or an RSI dip below 30. The indicator window shows RSI(5) in green and RSI(10) in red to highlight the differences. One is not better or worse than the other. They just focus on different timeframes. RSI(5) is short-term and RSI(10) is medium-term. Neither is oversold yet.
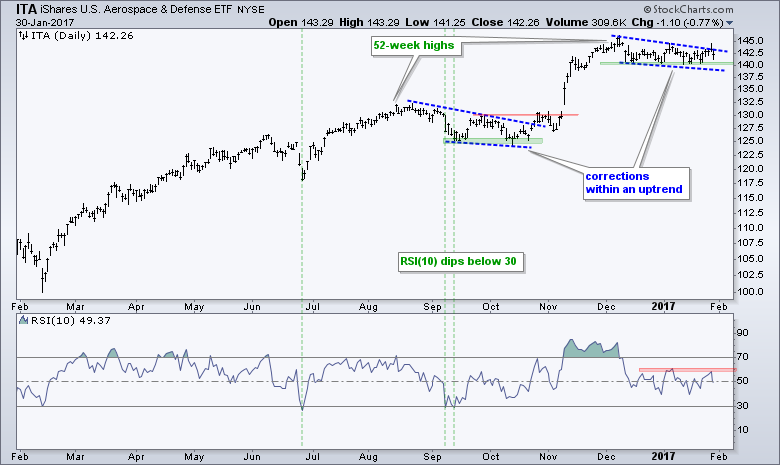
iShares Aerospace & Defense ETF Forges Falling Wedge
The iShares Aerospace & Defense ETF (ITA) remains with a bullish setup: long-term uptrend and short-term pullback. The pullback is rather flat as the ETF traded in the 140-145 range since 12-Dec. As far as I am concerned, there are two ways to play: anticipate the breakout with a position inside the wedge or wait for RSI(10) to dip into the 30-40 zone. The choice is yours!
Metals & Mining SPDR Holds Near Highs
The Metals & Mining SPDR (XME) hit a new high last week and then fell back over the last four days. This decline was quite modest and the wedge breakout is not under threat. This wedge breakout was the last setup/signal and a close below 31 would negate it.

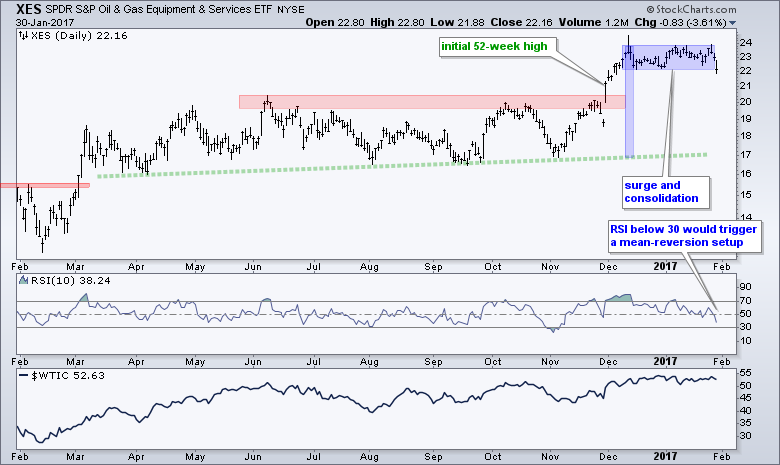
Oil & Gas Equip & Services SPDR Exceeds Consolidation Lows
The Oil & Gas Equip & Services SPDR (XES) closed below the consolidation lows and appears to be breaking consolidation support. Even though this looks negative to a pattern reader, a dip into the 20-21 area would likely push RSI below 10 and trigger the next mean-reversion setup. The big trend is up with the 52-week highs and this means pullbacks are opportunities, not threats.
Food for Thought Videos
Why a gloomy February could be ahead for stocks. Historical performance suggests that the market will suffer a rough month, according to Jonathan Krinsky of MKM Partners. He discusses with Eddy Elfenbein of the Crossing Wall Street.
Energy stocks tank. The energy sector takes it on the chin. Jonathan Krinsky of MKM Partners and Eddy Elfenbein of the Crossing Wall Street blog discuss with Brian Sullivan.
Banks down despite Trump attack on regulation. Jeffery Harte, Sandler O'Neill, and Dick Bove, Rafferty Capital VP, weigh in on financials as President Trump aims for more deregulation and the repeal of Dodd-Frank. James Gorman (CEO Morgan Stanley) also weighs in on Dodd-Frank.
VIX falls to multi-year low – here’s what that means for stocks. The CBOE Volatility Index has plunged. Craig Johnson of Piper Jaffray and Max Wolff discuss what that means for stocks with Brian Sullivan.
Snap's IPO, Facebook Earnings, Twitter's Growth: eMarketer Principal Analyst Debra Williamson weighs in on Snap's IPO and discusses the performance of Facebook and Twitter. Bloomberg Technology.
Were Airlines Blindsided By Trump Travel Ban? U.S. airlines tumbled the most in three months as concerns mounted that President Donald Trump’s ban on travel from seven predominantly Muslim nations will lead to more restrictions on flights. Bloomberg Markets.
******************************************************
Spotting Pullbacks and Upturns within an Uptrend using RSI and MACD Histogram.
Difference between EMA and SMA - Using %Above 200-day EMA for Breadth Analysis.
Backtesting Different Moving Average Pairs with SPY, QQQ and IWM.
ETF Master ChartPack - 300+ ETFs organized in a Master ChartList and in individual groups.
Follow me on Twitter @arthurhill - Keep up with my 140 character commentaries.
****************************************
Thanks for tuning in and have a good day!
--Arthur Hill CMT
Plan your Trade and Trade your Plan
*****************************************


