Blame Small-Caps for Mixed Up Market .... A Big Surprise for the 3rd Leading Sector .... Breadth Indicators Trigger for Healthcare Sector .... XLV Moves back above Long-term Moving Averages .... Biotech ETFs Spring Back to Life .... Emerging Markets ETF Nears 52-week High .... ChartList Update (16 stocks) .... Food for Thought .... //// ....
Blame Small-Caps for Mixed Up Market
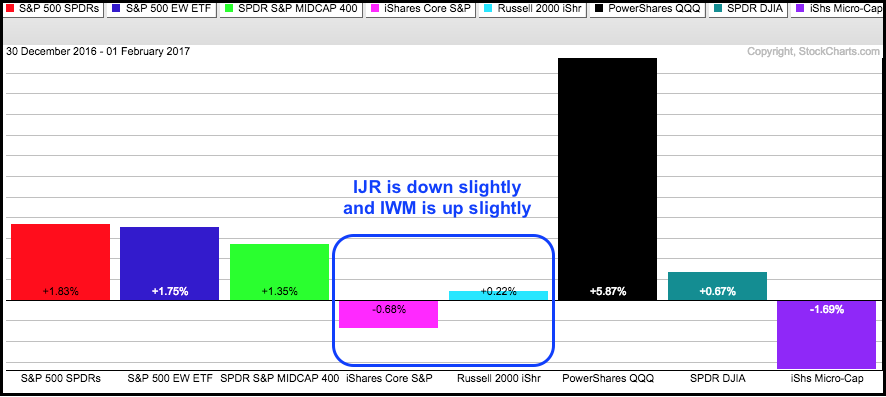
The broader market remains mixed this year, but the positives still outweigh the negatives. The PerfChart below shows modest gains for the S&P 500 SPDR, the Equal-weight S&P 500 ETF and the S&P MidCap SPDR. Actually, a modest 1.5% per month would turn into an astounding 18% per year. Thus, the year-to-date gains are quite respectable. QQQ is the lead with a 5+ percent again. Small-caps are split with the S&P SmallCap iShares down a fraction and the Russell 2000 iShares up a fraction. This is where the market is the most mixed.
A Big Surprise for the 3rd Leading Sector
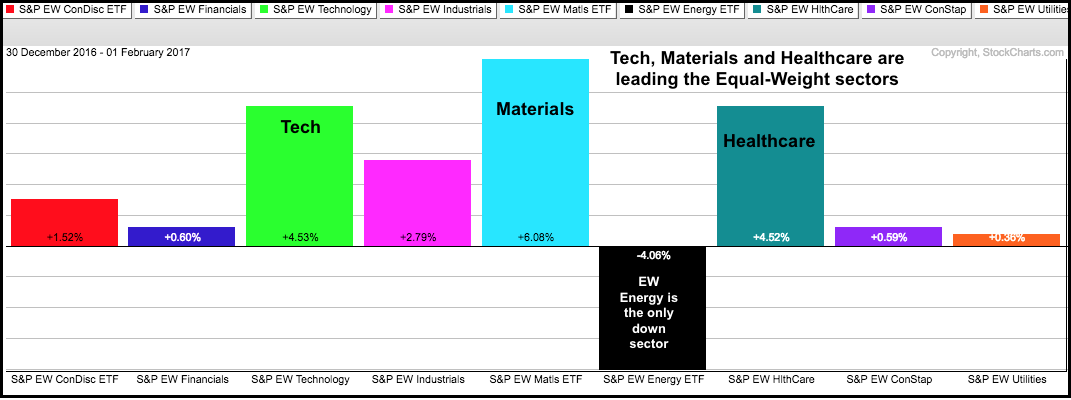
The next PerfChart shows year-to-date performance for the nine equal-weight sectors - and there is a surprise. I am showing the equal-weight sector ETFs because they best reflect performance for the group as a whole, not just large-caps. First, eight of the nine sectors are up so far this year. Second, technology, materials and industrials are showing leadership. Third, energy is the big laggard and the only sector with a loss. Healthcare is the big surprise because it sports the third biggest gain this year and is pretty much even with technology. Who would have thought! This has prompted me to re-examine the healthcare sector.
Breadth Indicators Trigger for Healthcare Sector
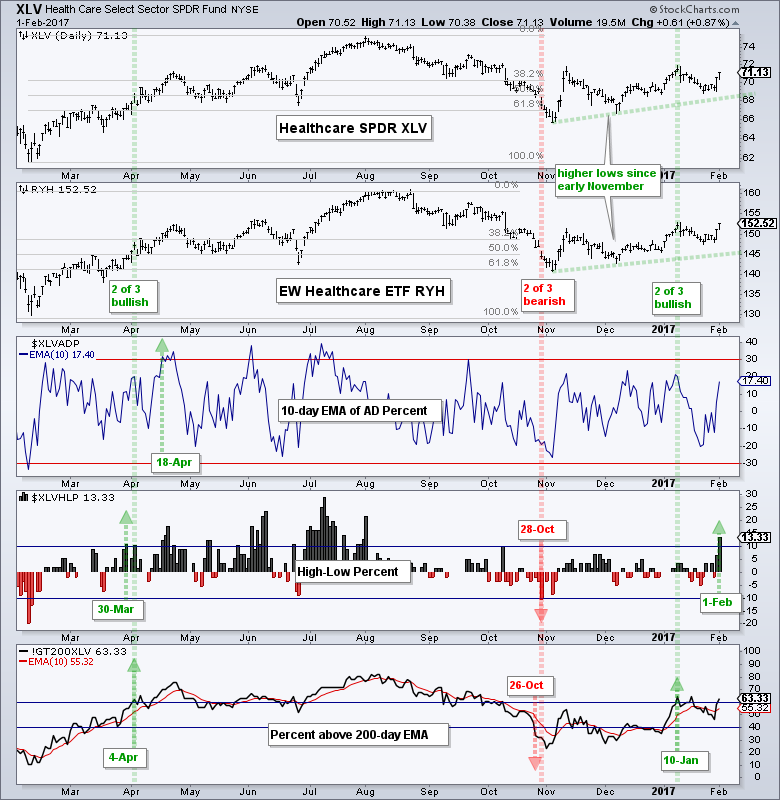
First, let's look at the HealthCare SPDR (XLV), the EW Healthcare ETF (RYH) and the three key breadth indicators specific to the sector. Here is a recap of the breadth signals. The 10-day EMA of HealthCare AD Percent ($XLVADP) triggers bullish with a move above +30% and bearish with a move below -30%. Healthcare High-Low% ($XLVHLP) triggers bullish with a move above +10% and bearish with a move below -10%. Healthcare %Above 200-day EMA (!GT200XLV) triggers bullish with a move above 60% and bearish with a move below 40%.
These breadth indicators enhance chart analysis by measuring internal strength or weakness. The green and red arrows show the individual signals for the breadth indicators. The vertical lines show when 2 of the 3 triggered bullish (green) and bearish (red). Two of the three triggered bearish on 28-Oct and this signal was countered when two of the three triggered bullish on 10-Jan. Notice that all three are now bullish because High-Low Percent surged to 13.33% on Wednesday. The healthcare sector recorded the most new highs since August 1st.
XLV Moves back above Long-term Moving Averages
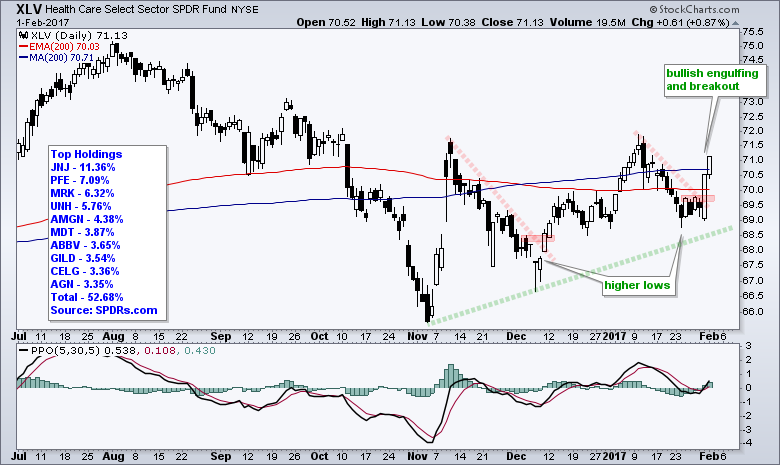
The chart shows XLV forming another higher low with a bullish engulfing and short-term breakout on Tuesday. The ETF followed through with more gains on Wednesday. It has been touch-and-go with this sector and I am returning to the bullish camp after seeing the price action and indicators over the last few days. Also note that XLV is back above the 200-day EMA and 200-day SMA. I prefer exponential moving averages because they put more weight on recent prices. This does not mean they perform better. It is just a personal preference.
Biotech ETFs Spring Back to Life
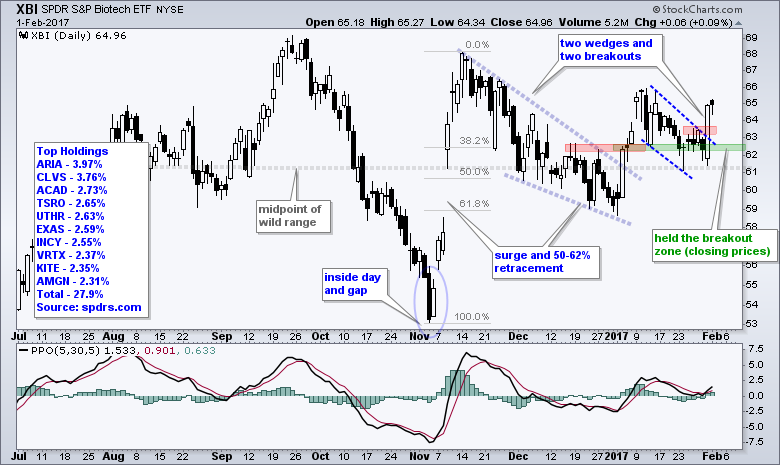
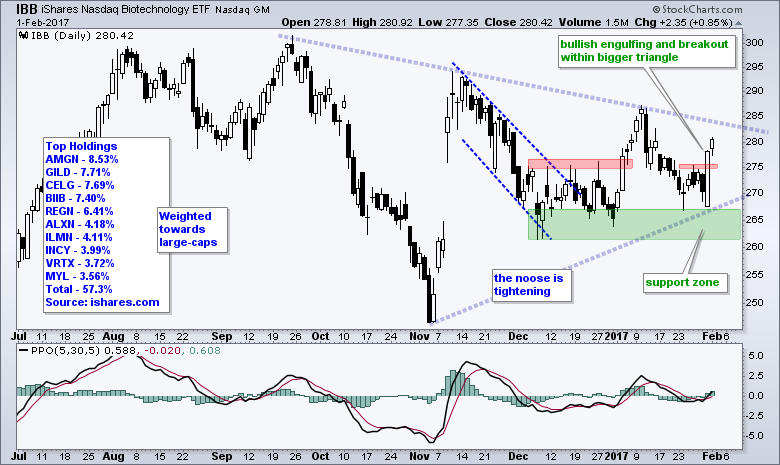
The Biotech iShares (IBB) and Biotech SPDR (XBI) also sprang to life with bullish engulfing patterns and short-term breakouts. The broad-based XBI is a little stronger because it held the early January breakout (did not close below 62). Tuesday's long white candlestick broke wedge resistance and XBI is staying bullish. IBB, which is weighted towards large-cap biotechs, failed to hold the early January breakout, but did managed to hold the December-January support zone.
Emerging Markets ETF Nears 52-week High
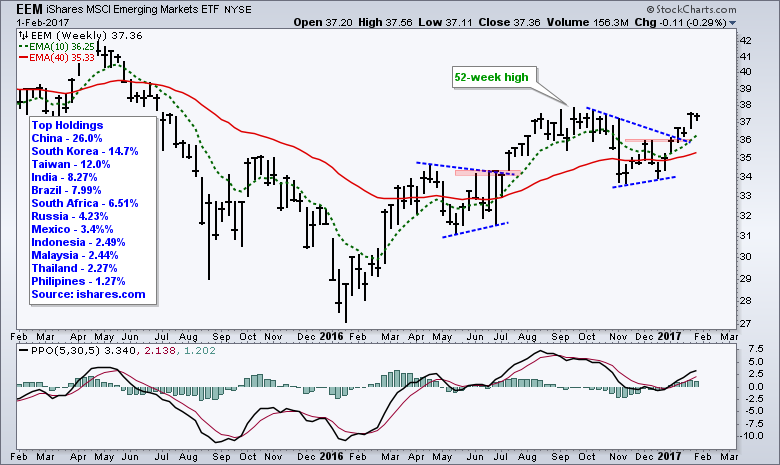
The Emerging Markets ETF (EEM) is a broad-based ETF representing 12 countries. China remains the biggest holding at 26%. Throw in South Korea and Taiwan, and the weighting for Asia is easily over 50%. Note that Samsung (S. Korea) accounts for 4% and is the single biggest stock holding. The price chart is bullish for EEM with a 52-week high in September, a consolidation into December and a breakout this year. Notice that the 10-week EMA held above the 40-week EMA in late December and the PPO (5,30,5) turned up five weeks ago.
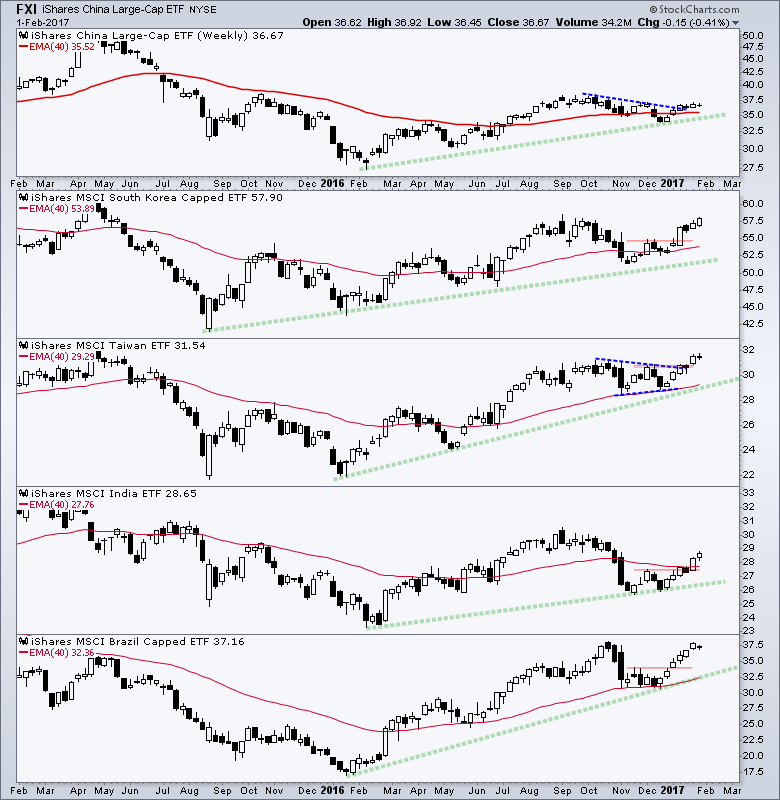
The next chart shows the top five country ETFs for EEM. Notice that all five are above their 40-week EMAs and they broke short-term resistance levels in January. The China iShares (FXI) is perhaps the weakest of the five because it struggled near its trend line break over the last three weeks.
Art's Charts ChartList Update
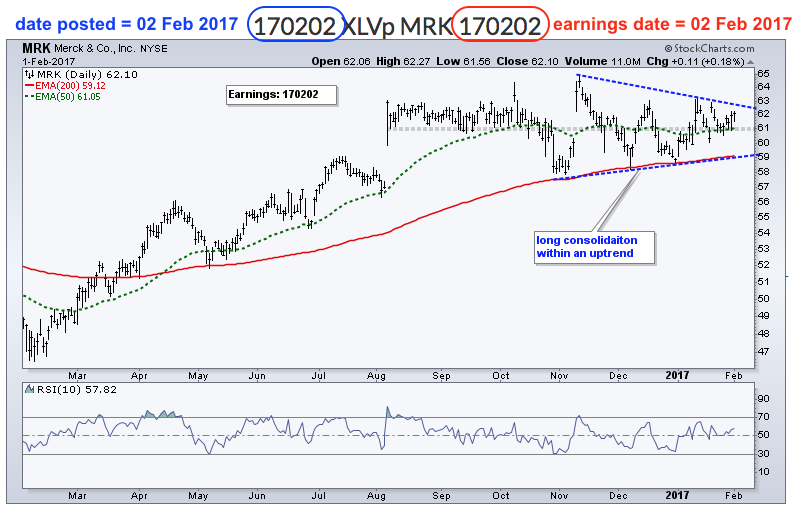
I added 16 annotated stock charts to the Art's Charts ChartList. There a several biotech stocks because many are bouncing off support zones (ABBV, AMGN, BIIB, CELG, GILD). There are a few pharma stocks (MRK, PFE, ABT). I also included bearish setups in SKX, CAKE, DRI and TXRH. On the flipside, we have bullish breakouts working in EA, STAY and USG.
Benzinga Pre-Market Prep
Note that I will be on the Pre-Market Prep with Joel Elconin (@Spus) and Dennis Dick (@TripleDTrader).
Tune in here on Friday morning at 8:30 AM EST.
Food for Thought
Facebook's multi-layered revenue story real attractive. James Cakmak (Monness, Crespi & Hardt) and Michael Graham (Cannacord Genuity) share their reactions to Facebook, as the company hits a record high following its Q4 earnings beat.
Is Apple still an iPhone company? Andy Hargreaves, Pacific Crest Securities senior analyst, and Jason Ware, Albion Financial CIO and Apple shareholder, discuss what investors should be watching for in Apple's earnings release and whether the tech giant needs to grow beyond the iPhone.
Too early to give up on the big oils? Doug Terreson, Evercore ISI top-rated energy analyst, shares his outlook on big oil companies including Exxon Mobil. With the “Fast Money Halftime Report” traders.
Small caps poised for big rally? Will President Trump’s policies boost smaller stocks? Boris Schlossberg of BK Asset Management and Ari Wald of Oppenheimer discuss with Brian Sullivan.
Morgan Stanley: It's Tough to Beat the S&P 500, and This Is Why.
Don't feel too bad, active managers. It's not your fault.
******************************************************
Spotting Pullbacks and Upturns within an Uptrend using RSI and MACD Histogram.
Difference between EMA and SMA - Using %Above 200-day EMA for Breadth Analysis.
Backtesting Different Moving Average Pairs with SPY, QQQ and IWM.
ETF Master ChartPack - 300+ ETFs organized in a Master ChartList and in individual groups.
Follow me on Twitter @arthurhill - Keep up with my 140 character commentaries.
****************************************
Thanks for tuning in and have a good day!
--Arthur Hill CMT
Plan your Trade and Trade your Plan
*****************************************


