.... Weekly Market Review & Outlook
.... Breadth Remains Bullish, But Lags Price Action
.... SPY Notches another New High
.... Sizing up a Potential Correction
.... QQQ Continues to Lead on the Charts
.... Small-caps Join the Party with Flag Breakout
.... Four Sectors Stand Out (XLK, XLI, XLB, XLF)
.... Materials Sector Extends Breakout
.... Energy Sports a Bullish Wedge
.... Staples and Utilities Hit Potential Reversal Zones
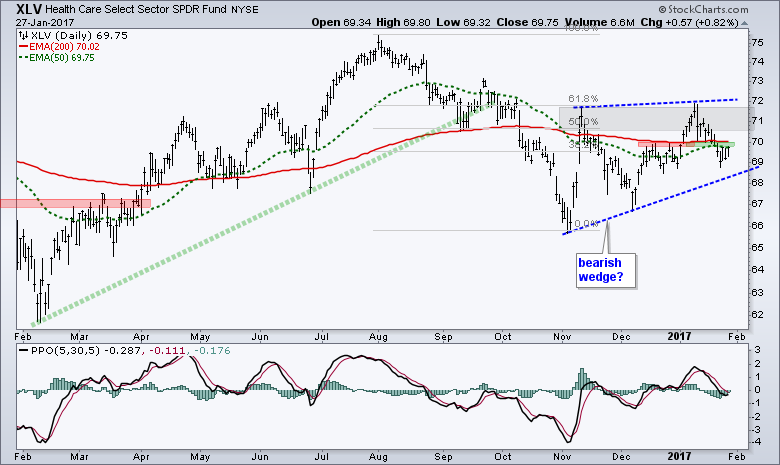
.... Healthcare Forms with Bearish Continuation Pattern
.... Bond ETFs Resume Bigger Downtrend
.... Gold Reverses Near Key Retracement
.... Oil Remains Bounces off Consolidation Support
.... Dollar Corrects within Bigger Uptrend
.... Video will be Posted on Saturday ....
Weekly Market Review & Outlook
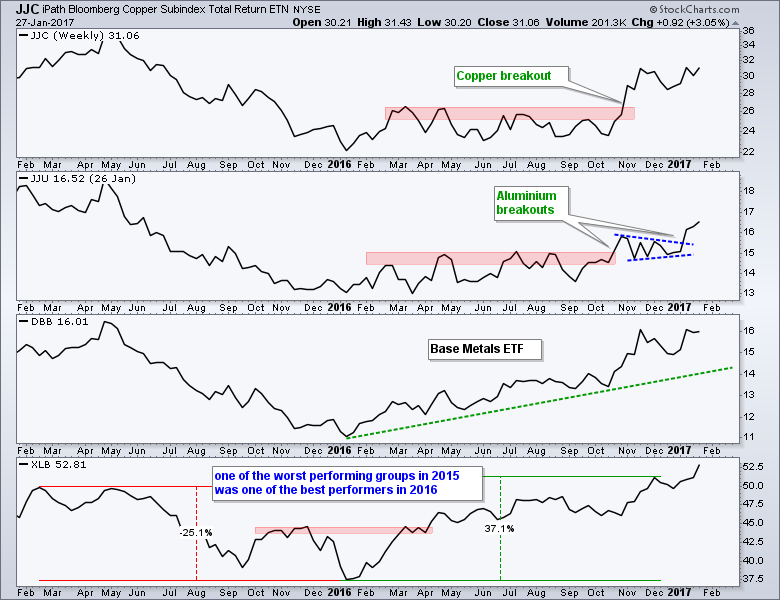
It was another big week for the stock market as several major index ETFs and several sector ETFs scored new highs. We can argue about overbought conditions and the need for a pullback, but there is no arguing the trend when hitting 52-week highs. Materials led the sectors as copper and aluminum moved higher. Industrial stocks were also strong with XLI and the EW Industrials ETF (RGI) hitting new highs.
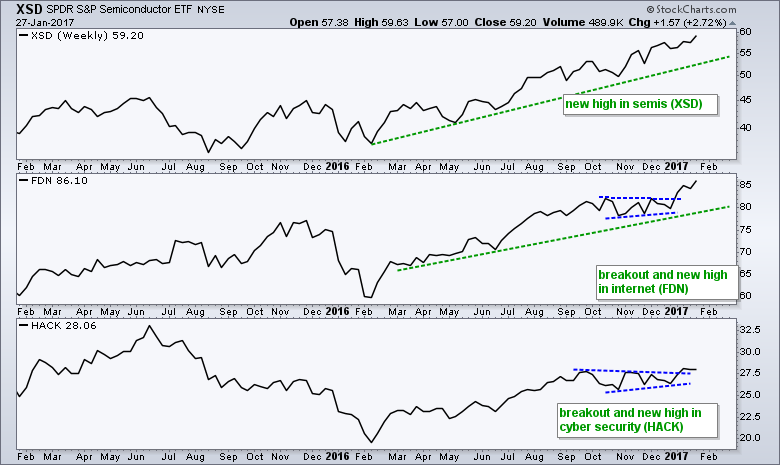
Elsewhere, we saw big moves out of housing with the Home Construction iShares (ITB) and the Home Builders SPDR (XHB) breaking out of falling wedge patterns. Techs were not left out as the Cloud Computing ETF (SKYY), Cyber Security ETF (HACK), Internet ETF (FDN), Networking iShares (IGN), Semiconductor SPDR (XSD) and Software iShares (IGV) hit new highs this week.
 Even though I am firmly in the bullish camp for the broader market, I think it is important to let the market come to you. In other words, be careful with the impulse to chase the market and chase breakouts. Fresh 52-week highs and price breakouts are bullish, no doubt. However, they do not always offer the best entry points for a position. Nobody knows when the market will correct, but I am guessing we will get some sort of correction in the first quarter.
Using ETFs for analysis, today's Weekly Review & Outlook will cover the broad market, the sectors, bonds, yields, gold, oil and the Dollar. This will become a regular Friday-Saturday feature to offer weekend chartists a thorough overview of market trends and conditions. I will take a step back by looking at one year bar charts and focusing on the bigger trends at work. I will also highlight patterns and setups within these trends when appropriate. I am still developing the format and coverage - and your feedback is always welcome (see comments section at bottom).
Breadth Remains Bullish, But Lags Price Action
The chart below shows the S&P 500 SPDR (SPY) with three breadth indicators for the S&P 1500: the 10-day EMA of AD% ($SUPADP), High-Low%($SUPHLP) and %Above 200-day EMA (@GT200SUP). The latter (@GT200SUP) is a user-defined index created using data from !GT200SPX, !GT200MID and !GT200SML. You can read more about these indicators in these three articles: AD Percent, High-Low Percent, and %Above 200-day EMA. The indicators have been net bullish since March 31st (2 of 3 with bull signals).
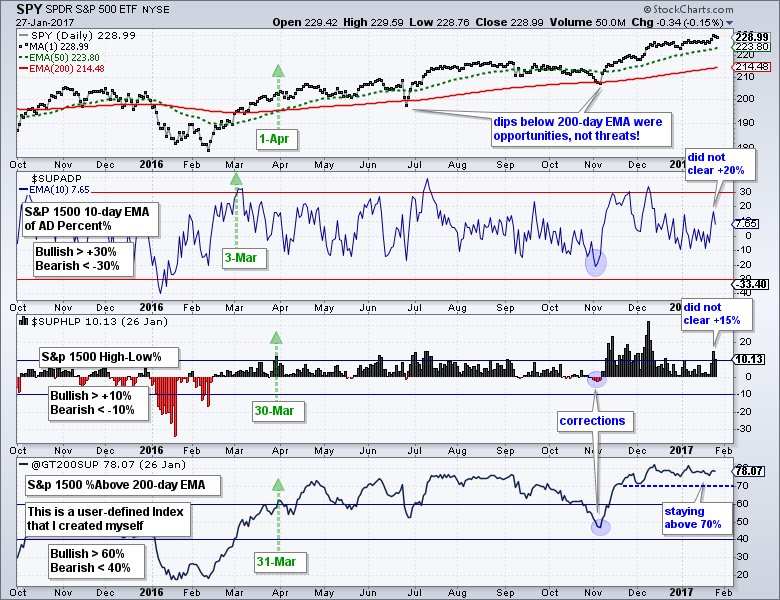 First and foremost, these breadth indicators triggered bullish signals in March and remain bullish overall. Despite a bullish market environment, I am seeing signs of less strength as the market pushes to new highs. The S&P 500 SPDR and S&P MidCap SPDR moved to new highs this week, but the S&P SmallCap iShares remains just short of a new high. New highs in two of these three is clearly more bullish than bearish. Even so, the 10-day EMA of AD Percent has yet to clear +20% this year and High-Low Percent has yet to clear +15%. This is not outright bearish, but it does point to less participation on the last push higher. The %Above 200-day EMA remains strong and well above 70%. A move below 70% could signal the start of a correction within this bull market.
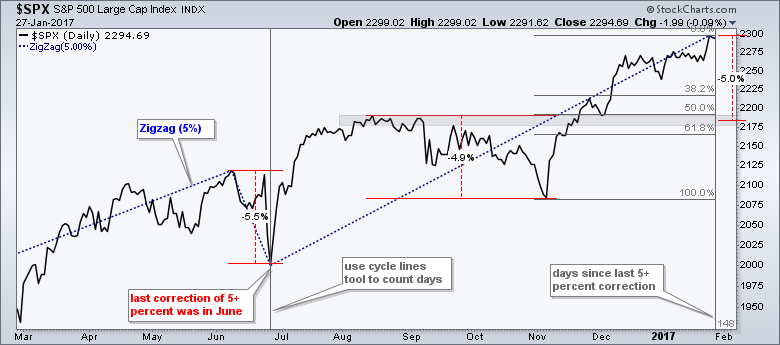
SPY Notches another New High
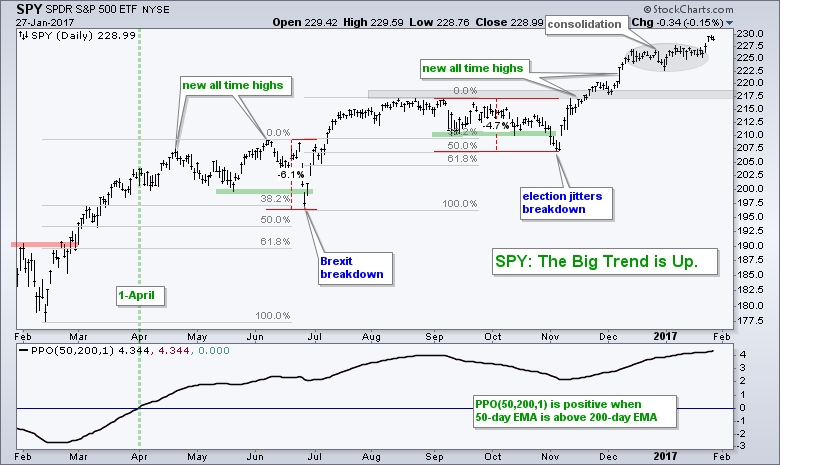
The S&P 500 SPDR (SPY) surged to new highs again this week. With this week's extension, the ETF is up over 10% from the November low and in a clear uptrend. The gray oval highlights a consolidation from 14-December to 23-January. This is basically a rest after the post-election surge. This week's breakout signals an end to this rest and a continuation of the uptrend. The consolidation zone now marks the first support area to watch should we see a pullback.
 Sizing up a Potential Correction
Timing or predicting a pullback within a bigger uptrend is tricky business because the uptrend is the dominant force. Ideally, I prefer to wait for pullbacks and use these as opportunities to partake in the bigger uptrend. We can expect 2 to 4 decent pullbacks (5-10%) in any given year. Just because the market is due for a pullback, however, does not mean it will happen. We will get a pullback at some point, I just don't know when (nobody does!).
The chart below shows the S&P 500 with the 5% Zigzag as the blue dotted line. The last 5+ percent pullback, on a closing basis, was in June. The August-November pullback was just short of 5%, but still a decent correction. Thus, it has not been that long since a correction. Should we get a 5% pullback from current levels, the S&P 500 would correct to the 2185 area. This would mark a 50-61.38% retracement of the November-January advance and a return to broken resistance. This is the area to watch if/when we do get a pullback.
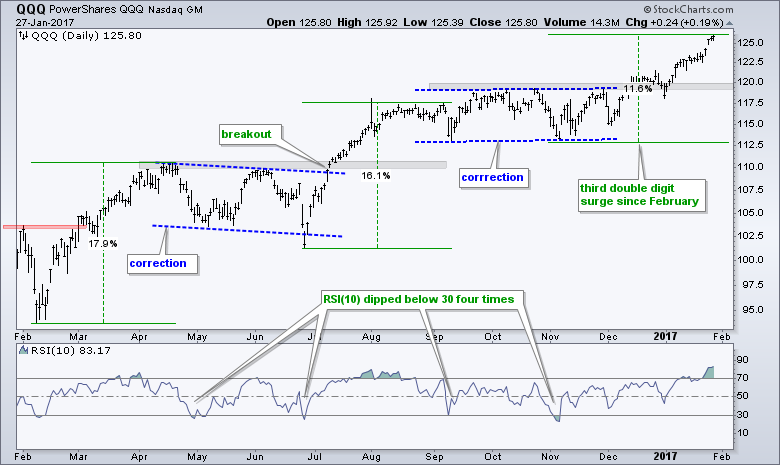
QQQ Continues to Lead on the Charts
QQQ surged over 10% from its early November low and this marks the third double-digit surge since February. The first two surges lasted seven to eight weeks and they were followed by corrective periods that lasted ten weeks or so. This is a pretty normal sequence: surge to new high, correct and continue. RSI(10) dipped below 30 four times to offer pullback opportunities to partake in the uptrend. QQQ is no doubt in an uptrend, but this trend is getting extended in both price appreciation and time. I would not be surprised to see a corrective period unfold sooner rather than later.
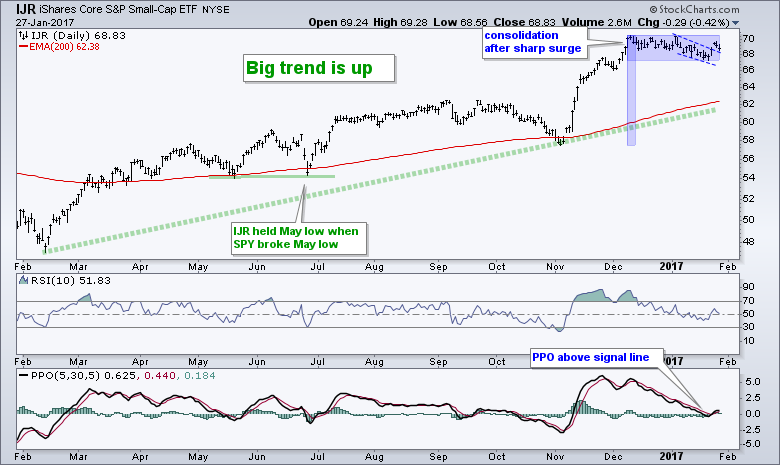
Small-caps Join the Party
The S&P SmallCap iShares (IJR) remains stuck in a consolidation since mid December, but there are signs of an upturn within this pattern. First, the ETF broke the small falling wedge with a surge above 79. Second, the PPO (5,30,5) turned up and moved back into positive territory. The breakout is already looking shaky and as IJR filled Wednesday's gap.
Four Sectors Stand Out (XLK, XLI, XLB, XLF)
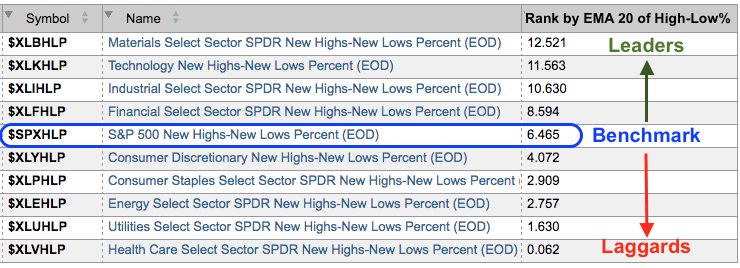
On a closing basis, five of the nine Sector SPDRs hit new highs this week and four of the five equal-weight sectors hit new highs. The difference stems from the fact that the Consumer Discretionary SPDR hit a new high and the EW Consumer Discretionary ETF did not. Technology, industrials, finance and materials are the strongest sectors overall. The consumer discretionary sector is mixed, while utilities, staples and healthcare are the weakest.
I ran some scans this week and the results confirm. The first table shows the 20-day EMA of High-Low Percent for the nine sectors. The blue oval marks S&P 500 High-Low% ($SPXHLP), which serves as the benchmark. Notice that High-Low Percent for materials, technology, industrials and finance is above the benchmark. These four sectors are leading when it comes to components hitting new highs. Consumer discretionary is just below the benchmark.
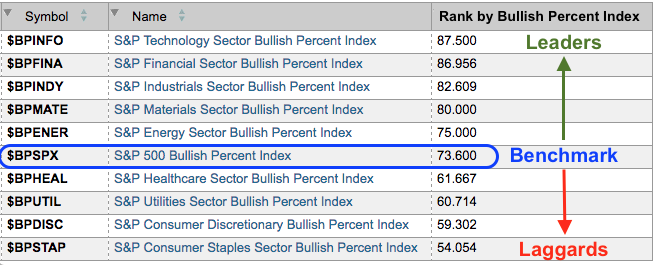
 The next scan shows the Bullish Percent Indexes for the S&P 500 and the nine sectors. The same four are leading and energy is just above the benchmark. These are the sectors we want to be focused on when looking for bullish stock setups (pullbacks within an uptrend). Notice that healthcare, utilities, consumer discretionary and consumer staples are below the benchmark.
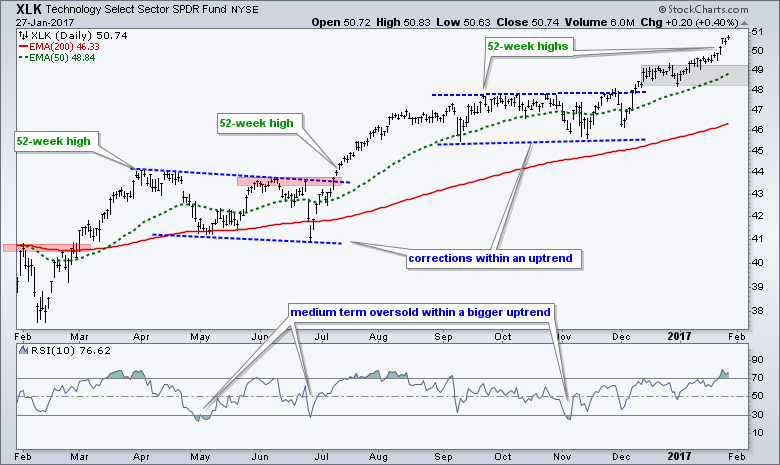
It is difficult to pick the single strongest sector, but I will stick with the Technology SPDR (XLK) as the leader right now. XLK hit another new high this week and is up around 10% from the mid December low. The gray area marks a consolidation zone that may offer support if there is a pullback.
Materials Sector Extends Breakout
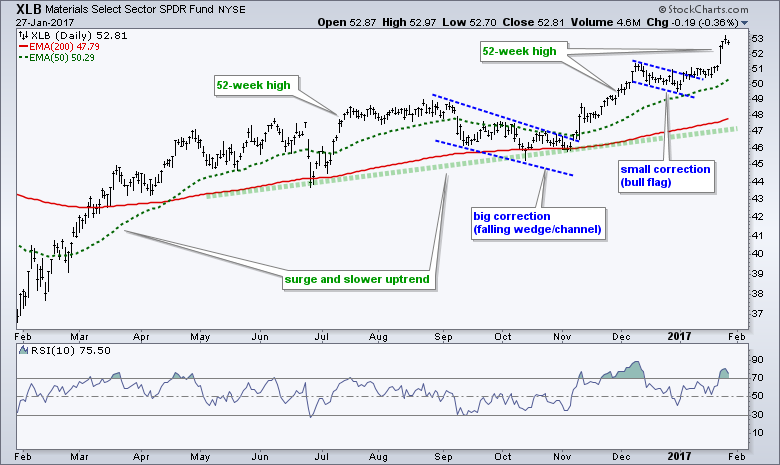
The Materials SPDR (XLB) surged to a new high and finally made good on the flag breakout in early January. There is no questioning the big trend with a fresh 52-week high. As with several other ETFs, XLB is current in no man's land. The trend is clearly up, but we just saw a big move to new highs. Even though this is bullish, the setup for new long positions is not there. I prefer to wait for a pullback or bullish setup.
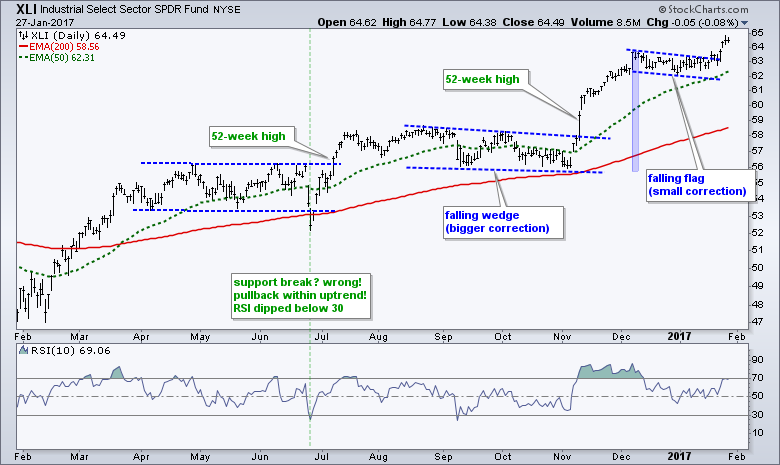
The Industrials SPDR (XLI) also made good on its flag breakout from early January and surged to a 52-week high. Note that this pattern is smaller than the September-October correction. Even though the prior move was bigger, I think the smaller pattern means we should expect less from the breakout.
Lifted by a revival in housing stocks and a breakout in ITB, the Consumer Discretionary SPDR (XLY) extended its uptrend and hit a new high this week. The flag breakout in early December was the last setup and signal. XLY is currently "in" trend and there is nothing to do but trail a stop-loss or wait for a pullback.
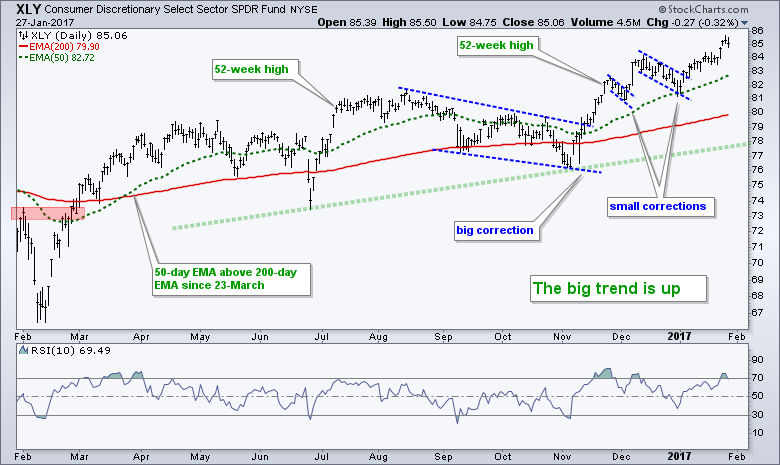
Even though there are clearly more pockets of strength than weakness in the stock market, retail remains a big sore spot as the Retail SPDR (XRT) fell to its lowest level since November 8th. This is weighing on the EW Consumer Discretionary ETF (RCD) and the main reason RCD is underperforming XLY.
The Finance SPDR (XLF) got a mini-breakout and eked out a new high this week. I am not sure if this mini-breakout will hold though. Even if it doesn't and the ETF breaks below the mid January low, I would still view this as an opportunity because it would be a pullback within a bigger uptrend. The 22 area marks a potential reversal zone.
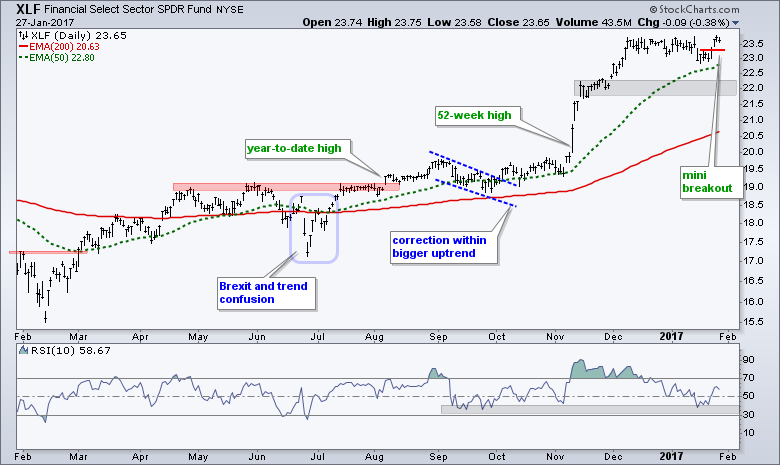
RSI(10) dipped into the 30-40 zone last week and bounced this week. Even though RSI did not break below 30 to become "oversold", there was a clear dip in momentum and this represents a correction of sorts. This is what I am trying to identify: corrections within an uptrend. Unfortunately, there is no set definition for short-term oversold. RSI(5) moved below 30, but RSI(10) did not.
Energy Sports a Bullish Wedge
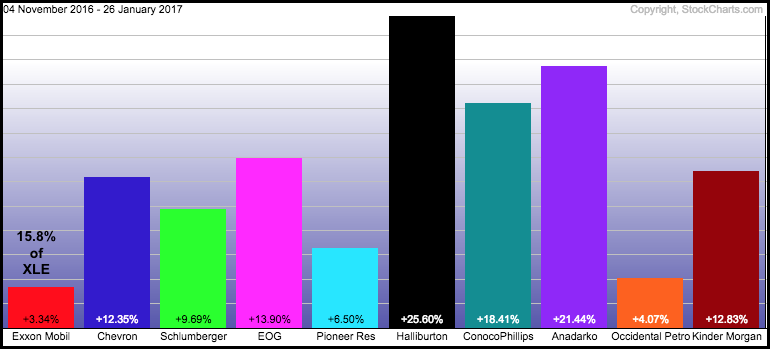
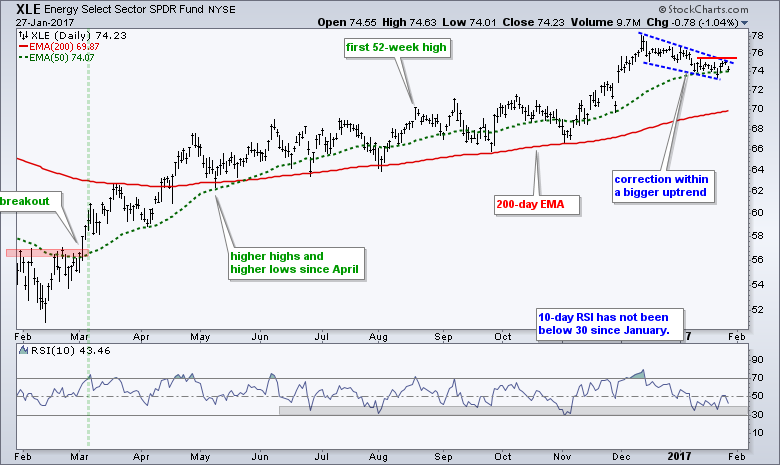
The Energy SPDR (XLE) remains with a bullish wedge, but ExxonMobil continues to weigh on the sector. The PerfChart shows the performance for the top ten stocks since early November. All are up, but XOM is up the least with a 3.34% gain. This is weighing on XLE because XOM is the biggest component (15.8%).
On the price chart, XLE remains with a long-term uptrend and a short-term falling wedge. This wedge is viewed as a correction within the bigger uptrend, which makes it an opportunity. A move above 75.5 would break wedge resistance and signal a continuation higher. The indicator window shows RSI(10) moving into the 30-40 zone twice this year. This means we have seen a pullback in momentum and should be on guard for an upturn.
Staples and Utilities Hit Potential Reversal Zones
The Utilities SPDR (XLU) and Consumer Staples SPDR (XLP) have similar patterns working, and both look bearish. They retraced around 61.8% of their prior declines with rising wedges. Both the retracement amount and the pattern are typical for counter-trend rallies. Wedge breaks would fully reverse these counter-trend advances and signal a continuation of the bigger downtrends.
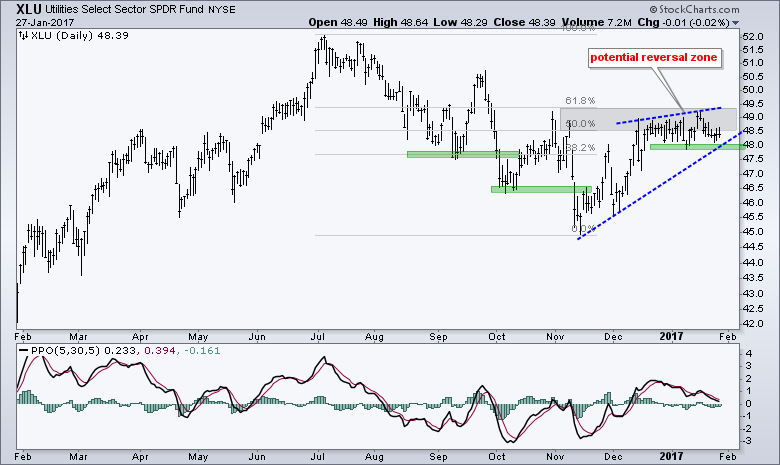
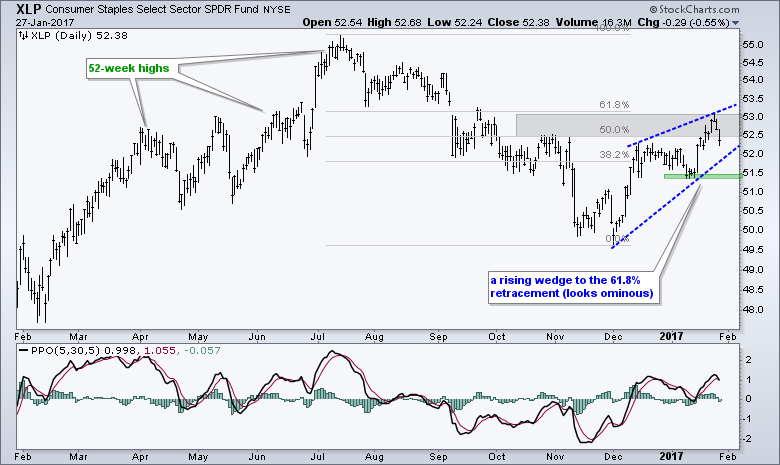
I am not interested in utilities and staples right now because they are underperforming since summer, they are negatively correlated to the 10-yr T-Yield and the stock market is bullish overall. I would not be interested in shorting these ETFs because of the bullish stock market.
Healthcare Forms Bearish Continuation Pattern
The HealthCare SPDR (XLV) remains the weakest of the nine sectors. In fact, pattern since early November is similar to that seen in XLP and XLU. XLV retraced 61.8% of the prior decline with a rising wedge of sorts. There was a breakout within this wedge, but the ETF moved back below 70 and the breakout failed. XLV is off my list for potential longs right now.
Bond ETFs Resume Bigger Downtrend
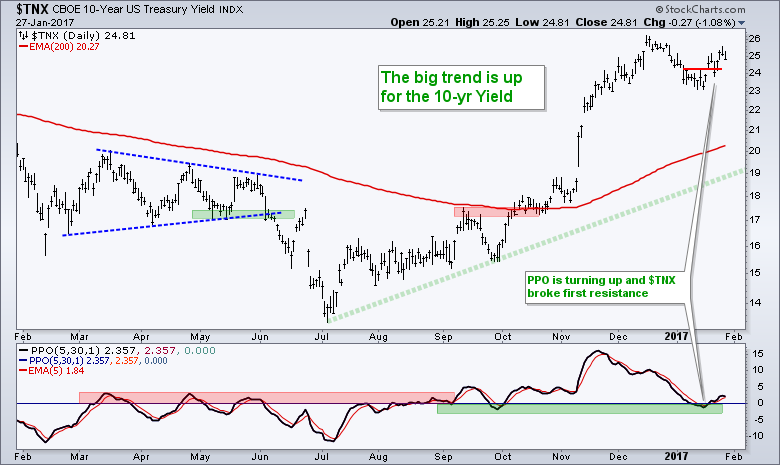
The 7-10 YR T-Bond ETF (IEF) and 20+ YR T-Bond ETF (TLT) remain in long-term downtrends. Both bounced from mid December to mid January and then reversed this bounce with a decline the last seven days. It looks like the counter-trend rally has ended and the bigger downtrend is resuming. The indicator window shows the PPO (5,30,5) moving into negative territory. This is positive for stocks because it means money is moving out of safe-haven bonds. This money will likely find its way into riskier assets, like stocks.
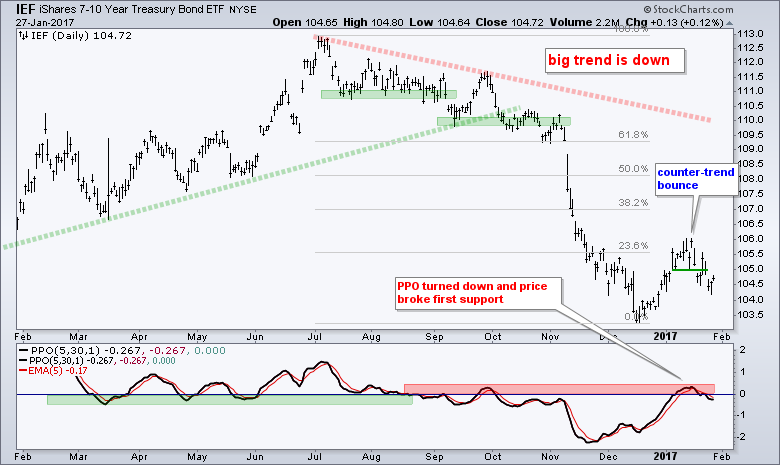
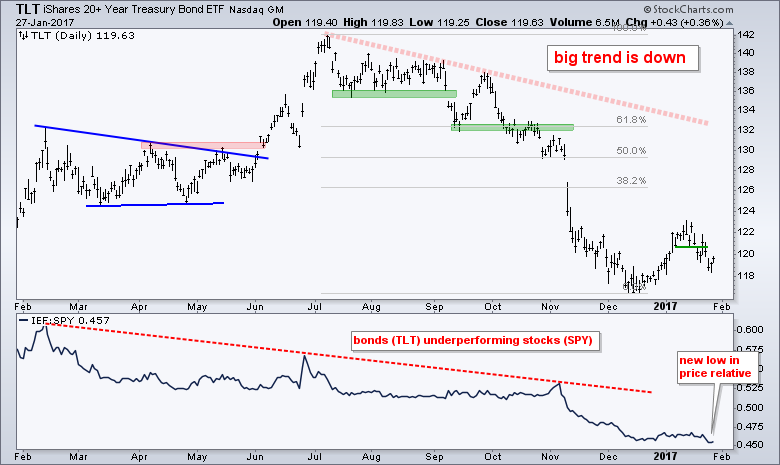 The indicator window shows the TLT:SPY ratio falling to a new low this week. This means bonds (safe-haven assets) are underperforming stocks (risk assets). This is net positive for stocks and negative for bonds. It certainly shows a preference for risk in the financial markets.
The 10-yr T-Yield ($TNX) confirms the breakdown in bonds with an upside breakout and bullish PPO upturn.
Gold Reverses Near Key Retracement
The Gold SPDR (GLD) is in a long-term downtrend and this means I view the bounce to 115 as a counter-trend move. I start anticipating the end of a counter-trend move when it retraces 38.2% to 61.8% of the prior move (plus or minus 50%). GLD hit the 50% retracement and fell this week. It looks like this bounce is reversing with a minor support break and a bearish signal line cross in the PPO (5,30,5).
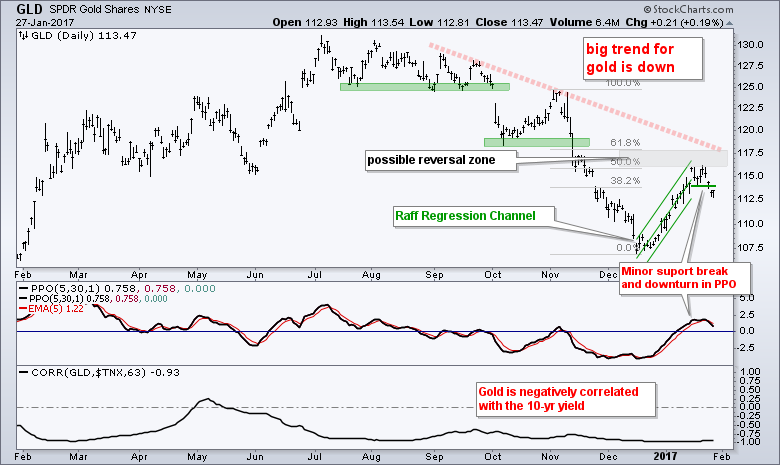 The indicator window shows the 63-day Correlation Coefficient (GLD,$TNX), which covers around three months. Notice that gold and the 10-yr Yield are negatively correlated. This means they move in opposite directions and the upturn in the 10-yr yield is negative for gold.
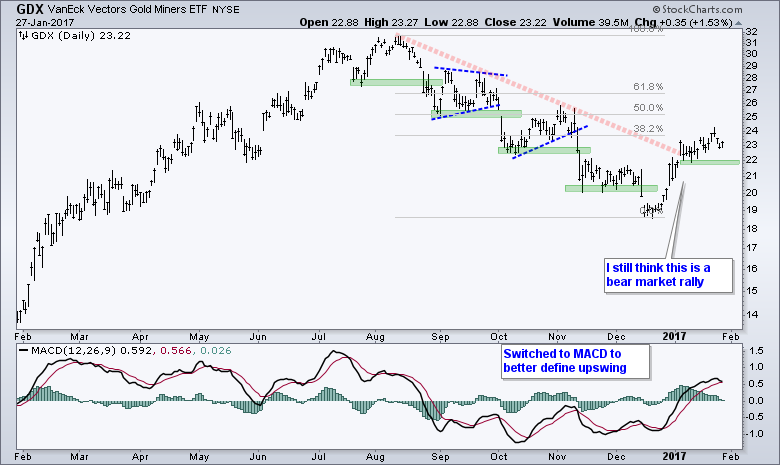
The Gold Miners ETF (GDX) reached the 38.2% retracement and fell back this week. The five week trend may still be up, but I would not be interested in this bounce because of my stance on gold. First support is set around 22 and MACD remains just above its signal line.
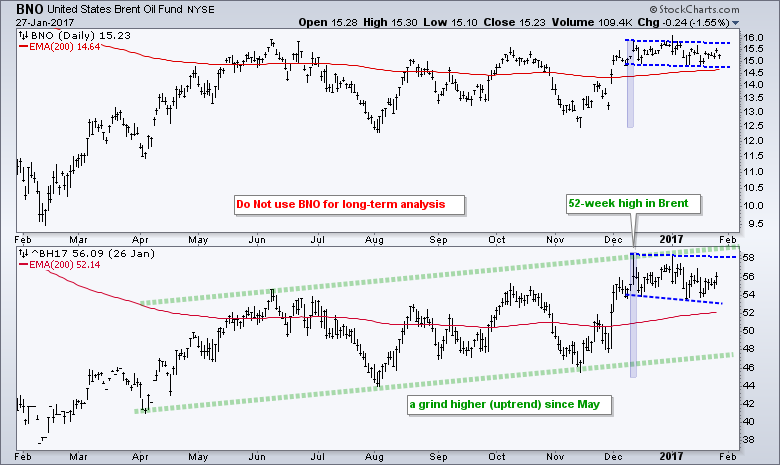
Oil Remains Bounces off Consolidation Support
There is not much change in oil. March Crude (^CLH17) sports higher highs and higher lows since May and the big trend is clearly up. Oil surged along with the stock market from mid November to mid December and then consolidated with a falling flag. Crude bounced off the flag lows this week and could be positioning for a move higher. I am not expecting anything dramatic, but the trend is clearly up and this flag is a bullish continuation pattern. Continued strength in oil bodes well for most oil-related stocks (except maybe XOM).

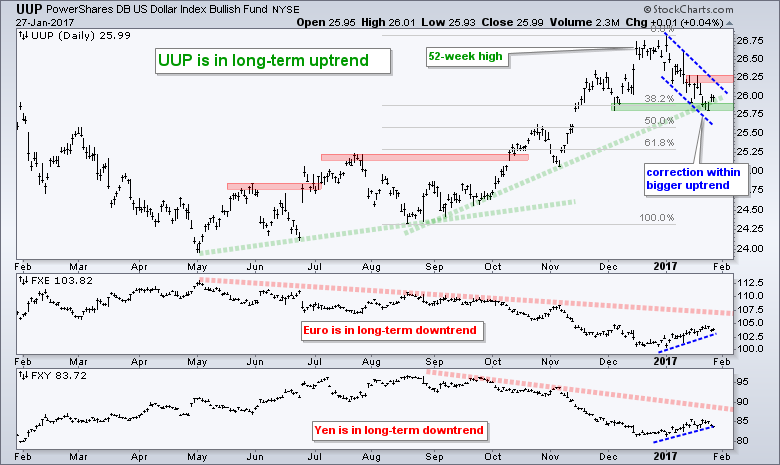
Dollar Corrects within Bigger Uptrend
The big trend for the US Dollar ETF (UUP) is up and the decline to the 25.75 area is viewed as a correction. The Fibonacci retracement zone extends from 38.2% to 61.8% and UUP is currently near the upper end. This is viewed as the top of a potential reversal zone. The trend blue trend lines define the correction with resistance marked at 26.25. A breakout here is needed to signal an end to the correction and a resumption of the bigger uptrend. Chartists can also watch the Euro ETF (FXE) and Yen ETF (FXY) for signs. Breakdowns in both would support a breakout in the Dollar.
******************************************************
Spotting Pullbacks and Upturns within an Uptrend using RSI and MACD Histogram.
Difference between EMA and SMA - Using %Above 200-day EMA for Breadth Analysis.
Backtesting Different Moving Average Pairs with SPY, QQQ and IWM.
ETF Master ChartPack - 300+ ETFs organized in a Master ChartList and in individual groups.
Follow me on Twitter @arthurhill - Keep up with my 140 character commentaries.
****************************************
Thanks for tuning in and have a good day!
--Arthur Hill CMT
Plan your Trade and Trade your Plan
*****************************************


