Small-caps Surge, but Mid-caps Lead Year-to-date .... IJR Breaks Flag Resistance .... SPY and QQQ Hit New Highs .... 14 Stocks Added to ChartList .... Food for Thought.... //// ....
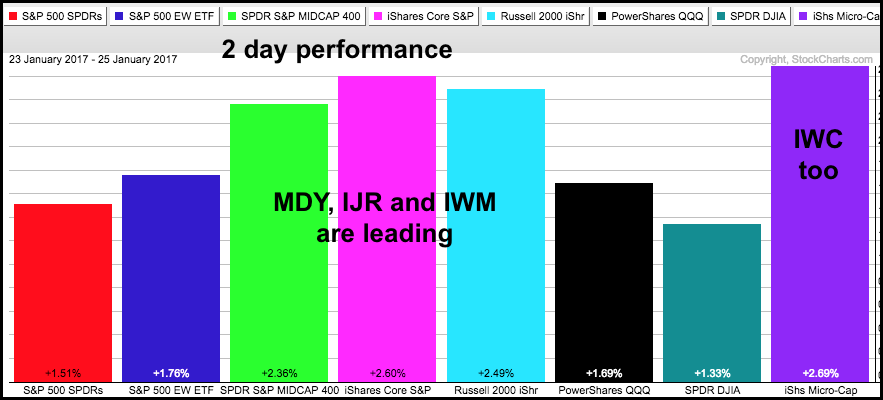
I will start with the S&P SmallCap iShares (IJR) because it led the bounce over the last two days. The PerfChart shows the eight major index ETFs. Well, perhaps the Russell MicroCap Index is not a "major" index. In any case, this PerfChart shows performance over the last two days with IJR up 2.6% and leading the pack. SPY and DIA are up the least and lagging the pack.
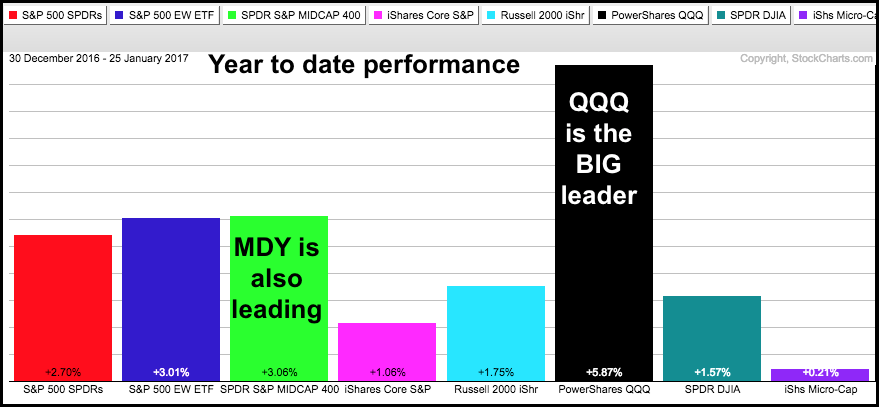
The next PerfChart shows year-to-date performance for this group. Even with the big gains, small-caps and micro-caps are lagging. I do not view this is bearish because I think the S&P SmallCap iShares (IJR) and Russell 2000 iShares (IWM) were just correcting after a sharp advance. Before leaving this chart, notice that the S&P MidCap SPDR (MDY) is the second best performer year-to-date (+3.06%).
IJR Breaks Flag Resistance
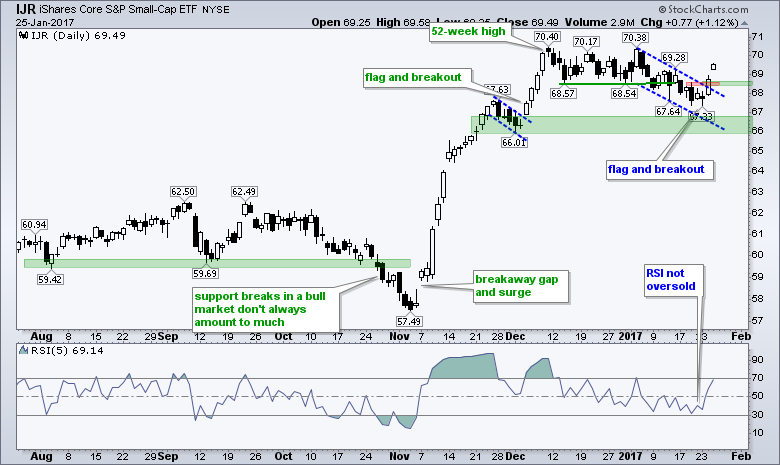
The S&P SmallCap iShares (IJR) was lagging this year because it corrected with a falling flag. RSI dipped to 32.18 last week, but did not become "oversold". Sometimes RSI does not fully cooperate and provide a nice oversold signal. This is when I look to the price chart for clues. First and foremost, the pullback over the last few weeks was always viewed as a correction within a bigger uptrend. IJR closed below 68 with a black candlestick last Thursday, firmed on Friday-Monday and then broke out on Monday. This is a four-candlestick reversal pattern - decline, stall and reverse. The breakout zone becomes the first area to watch for a failure. Thus, I think a close below 68.2 would call for a reassessment.
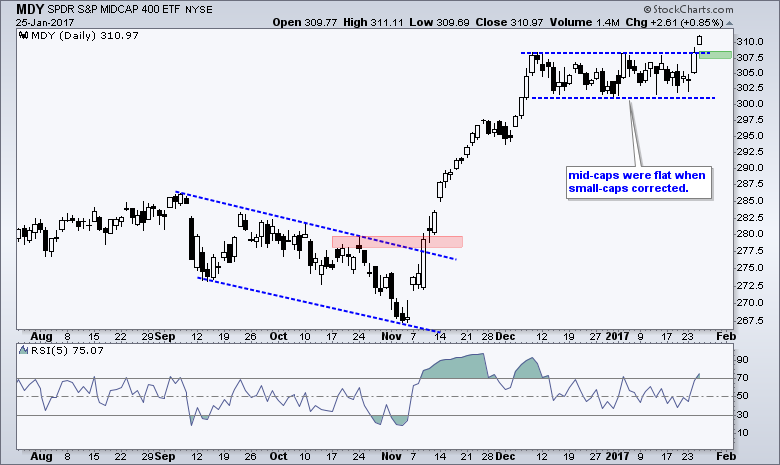
The next chart shows the S&P MidCap SPDR (MDY) breaking out to a 52-week high. While this breakout and 52-week high are technically bullish, I do not consider this a great bullish setup (at least not for my trading style). A bullish setup for me is when we see a pullback within an uptrend or a reversal off support. Some breakouts hold and prices sometimes continue higher without a pullback. The breakout zone becomes the first support zone to watch in the 307-308 area.
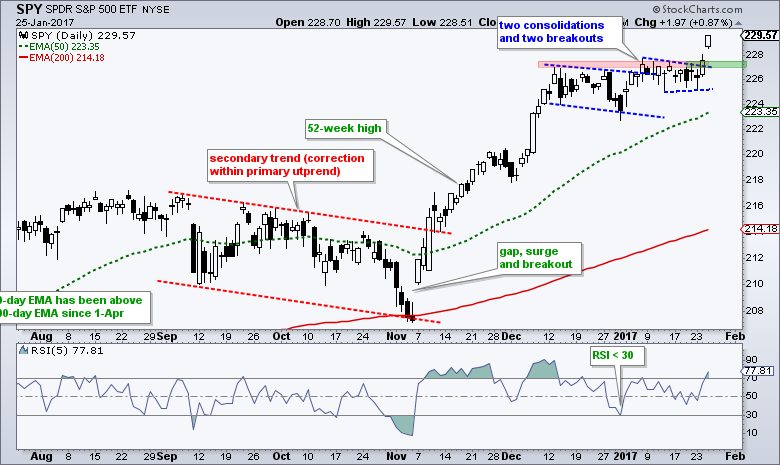
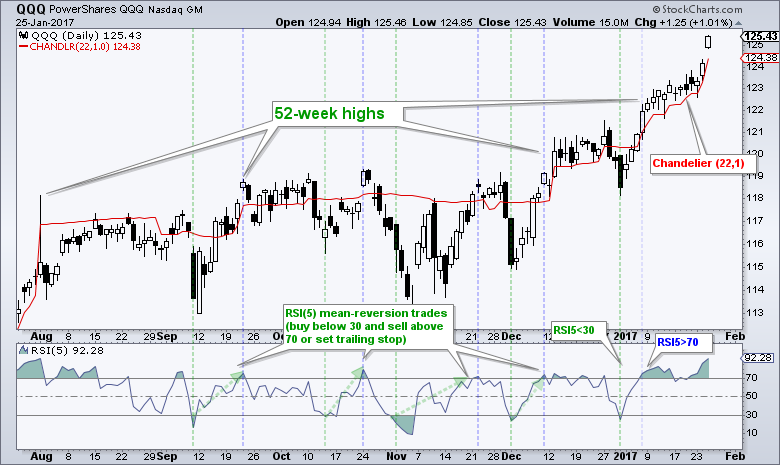
SPY and QQQ Hit New Highs
SPY broke out of its second consolidation and surged to a fresh 52-week high. The breakout zone around 227-228 becomes the first area to watch.
QQQ accelerated higher and hit yet another 52-week high. As noted before, indicators are not perfect, but sometimes they work great. The Chandelier Exit (22,1) did not work so great for SPY, but it has worked well for this advance in QQQ.
14 Stocks Added to ChartList
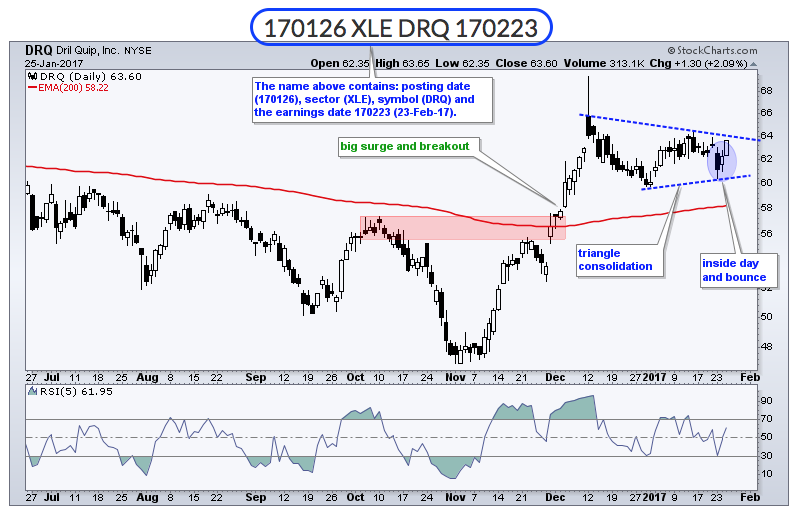
I updated the Art's Charts ChartList (here) with 14 stock charts that I found interesting (bullish, bearish, at support, at a Fibonacci level, strong breakout etc.). Note that the first 8 charts are from Tuesday. The next 14 stock charts include: DRQ, RDC, BAC, TWI, ATVI, TDC, CVS, ESRX, CAL, H, KATE, CAKE, DRI and TXRH. Note that we are in the middle of earnings season so I am avoiding stocks that report within the next two weeks. The name of the chart shows the sector and the earnings date. When viewing the ChartList as 10 per page, the name is just above the chart. The example below shows the posting date (170126), the sector (XLE), the symbol (DRQ) and the earnings date 170223 (23-Feb-17).
Food for Thought
The next two video links from CNBC:
Tony Dwyer of Canaccord Genuity. To paraphrase: The market has gone 146 days without a pullback of at least 5%. This is the second longest streak since the bull market began in 2009. He is long-term bullish, but expects a 4-7% pullback at some point
Robert McNamee of Elevation Partners and Moonlace (band). To quote: Trump favors nationalism, which is inherently more pessimistic, and when it follows globalism inevitably it has to lead to shrinkage in demand and less GDP around the world. The tech industry is so exposed to that. It needs China for supply of materials and demand for its products.
******************************************************
Spotting Pullbacks and Upturns within an Uptrend using RSI and MACD Histogram.
Difference between EMA and SMA - Using %Above 200-day EMA for Breadth Analysis.
Backtesting Different Moving Average Pairs with SPY, QQQ and IWM.
ETF Master ChartPack - 300+ ETFs organized in a Master ChartList and in individual groups.
Follow me on Twitter @arthurhill - Keep up with my 140 character commentaries.
****************************************
Thanks for tuning in and have a good day!
--Arthur Hill CMT
Plan your Trade and Trade your Plan
*****************************************


