----- Video Link ----- Art's Charts ChartList (updated 11-Feb) -----
Banks, Small-caps and the 10-yr Yield
Stocks extended their uptrends with the S&P 500, S&P MidCap 400 and Nasdaq 100 hitting new highs this week. The S&P Small-Cap 600 did not hit a new high, but made a bid to end its correction with a surge on Thursday-Friday. Overall, stocks are in a peculiar place. The S&P 500 and the Nasdaq 100 appear to be extended on the upside, but selling pressure has been minimal and there are no signs of a correction. The S&P Small-Cap 600, in contrast, corrected over the last eight weeks and does not appear extended. In fact, this small-cap barometer is showing signs of strength that could signal an end to the recent correction. We will dissect the S&P Small-Cap 600 this week by looking at a short-term breadth indicator and the nine small-cap sector ETFs.
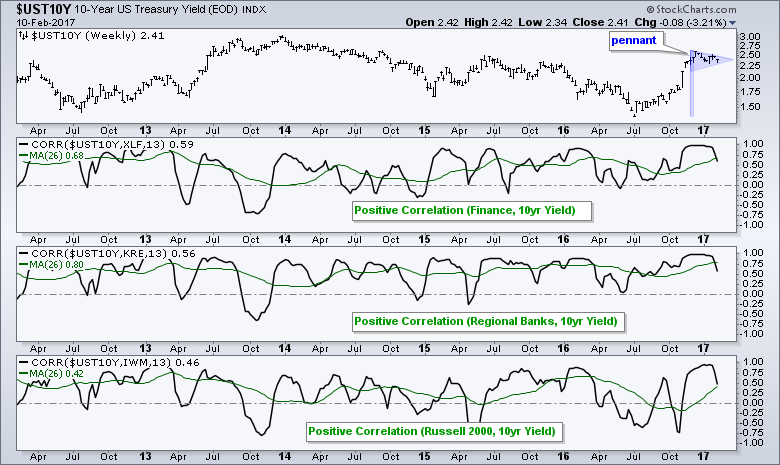
Chartists may want to watch the 10-yr T-Yield for clues on banks, small-caps and the broader market. The chart above shows the 10-yr yield and the 13-week Correlation Coefficients with the Finance SPDR (XLF), the Regional Bank SPDR (KRE) and the Russell 2000 iShares (IWM). The green line is the 26-week SMA to smooth out the correlation and provide a general assessment. There is a strong positive correlation between the Finance SPDR and 10-yr Yield, and between the Regional Bank SPDR and the 10-yr Yield. There is also a mostly positive correlation between the Russell 2000 iShares and the 10-yr Yield. This means they move in the same direction. Note that the finance sector accounts for 18% of the S&P SmallCap iShares (IJR) and 19.3% of IWM. A fall in the 10-yr yield could be negative for XLF, KRE and IWM, while a rise would be positive. Notice that a pennant is taking shape in the 10-yr yield and a breakout at 2.55% would call for higher yields.
SPY Extends after Consolidation Break
The S&P 500 SPDR (SPY) hit another new high for the current move and remains in a strong uptrend. The PPO(50,200,1) remains in positive territory and this means the 50-day EMA is above the 200-day EMA. Notice that SPY surged 9.8%, consolidated from mid December to mid January (gray box) and then broke out of the consolidation with a fresh new high on 25-Jan. Even though SPY fell back a few days later, this did not "undo" the new high. Hint: it still happened. Basically, we have a sharp advance (9.8%) followed by a slower advance the last seven weeks. Even though upside momentum may be slowing, slower advance is not actually bearish. The bulls clearly have the edge as long as prices advance - no matter how slow or fast.
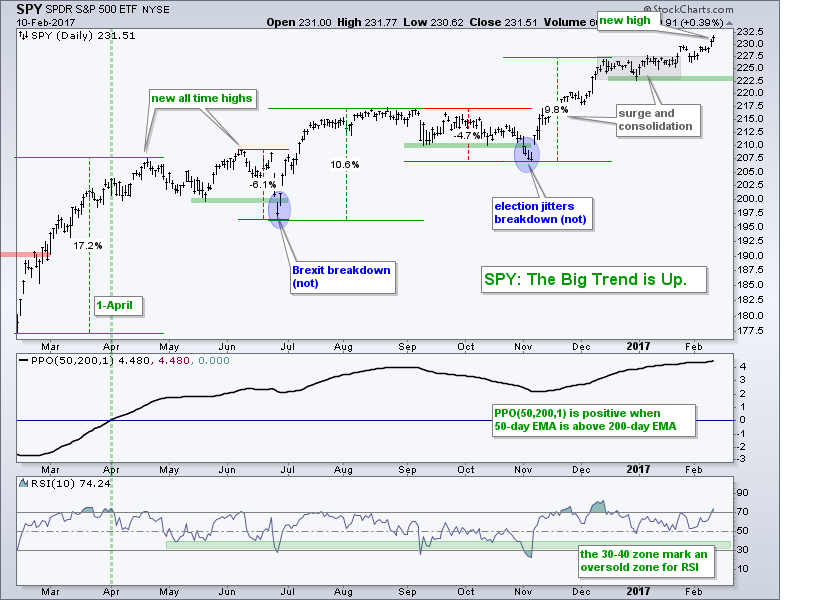
Despite a clear long-term uptrend, SPY is still looking extended on the shorter timeframes. The consolidation zone around 225 becomes the first area to watch for a potential reversal on a pullback. The green line marks a short-term reaction low in December. Some chartists may consider this a "support" level. Personally, I think a break below 222.5 would be more of an opportunity than a threat. Chartists can also watch the 30-40 zone to signal that RSI(10) is becoming oversold.
QQQ Extends its Over-Extendedness
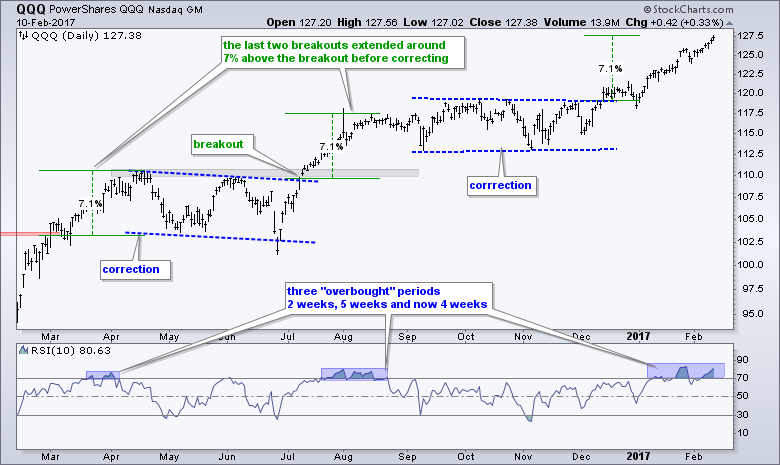
QQQ remains the leader this year with the biggest year-to-date gain of the major index ETFs. Note that QQQ is up more than twice as much as SPY and MDY. I do not see anything "bearish" on this chart. We can argue for caution after a double-digit advance since early November and a 7% gain year-to-date, but these are not bearish indicators. I did notice that QQQ extended around 7% after the last two breakouts and is current up around 7% from the mid December breakout. Also note that RSI moved above 75 this week and the indicator has been hovering around the 70 area for four weeks now. The indicator hovered around the 70 area for five weeks in July-August.
IJR Attempts another Breakout
In contrast to SPY and QQQ, IJR corrected over the last eight weeks and is not overbought. The ETF hit a new high with a move above 70 in early December and then fell back below 68 in January-February. The decline has been rather modest and more like a consolidation. A falling consolidation after a new high is a correction within an uptrend and the uptrend is expected to prevail at some point. IJR surged on Thursday and a breakout appears to be in the making.
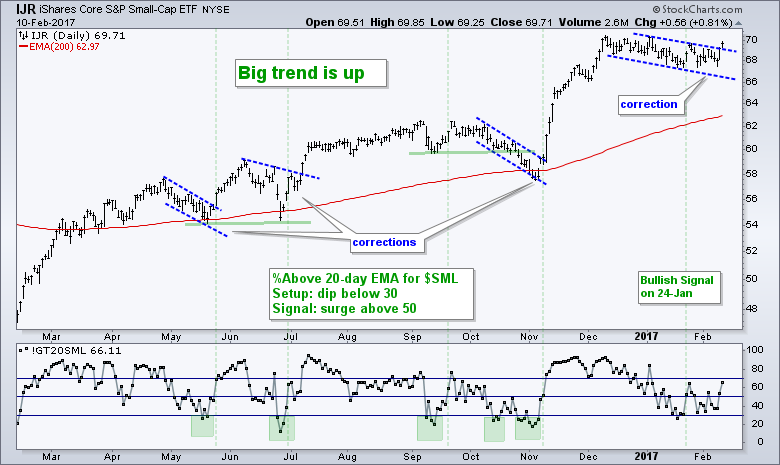
The indicator window shows the Small-Cap %Above 20-day EMA (!GT20SML). This setup-signal was first shown on Tuesday and the current bull signal in IJR remains valid. When the long-term trend is up (like now), I look for a move below 30% to signal a pullback in the majority of small-caps stocks. I then wait for a subsequent move above 50% to signal an upturn in the majority of small-cap stocks. A signal triggered on 24-Jan and remains in effect until the indicator moves back below 30%. The prior setups and signals are marked as well.
Tech and Healthcare Lead Small-cap Sectors
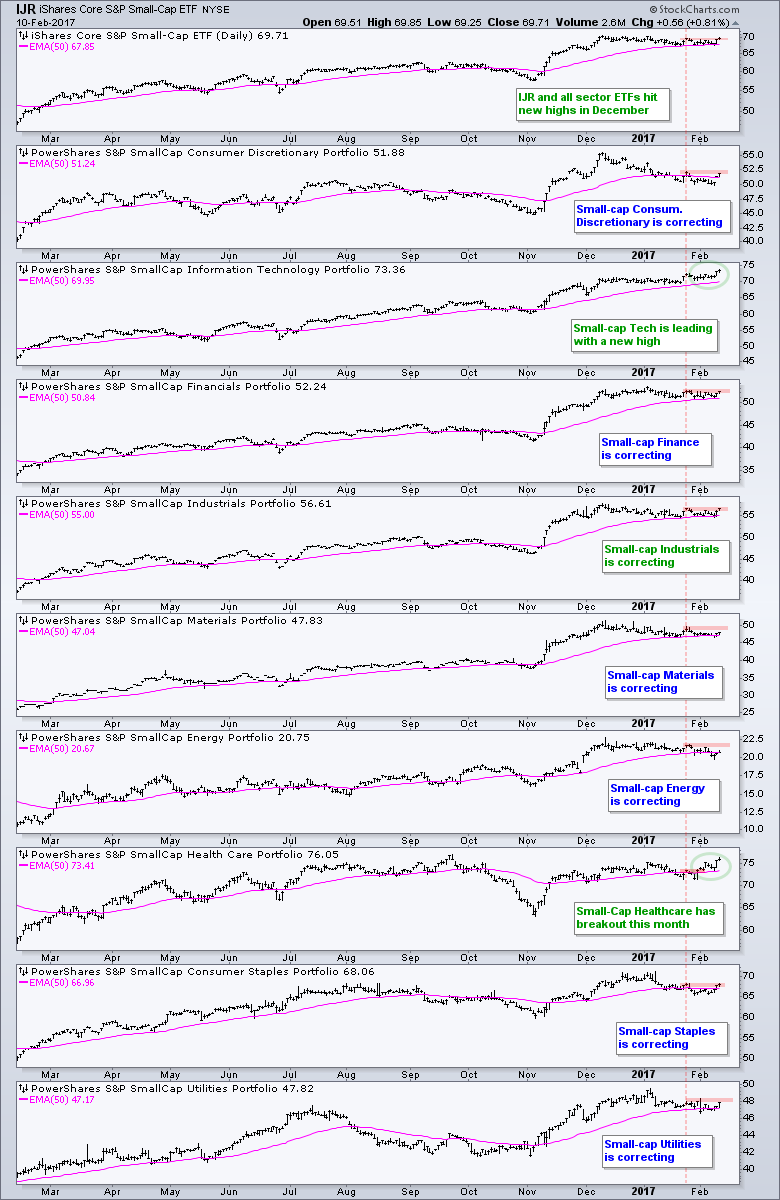
Chartists can breakdown the S&P SmallCap iShares by looking at the individual sector ETFs. Some of these have low volume levels and are not suitable for trading, but we can still use them for analysis purposes. The SmallCap Technology ETF (PSCT) is leading with the only new high. The SmallCap HealthCare ETF (PSCH) is actually in second place because it broke out of its correction last week and hit a high for the year (2017). The other seven sector ETFs remain in corrective mode (pullbacks after new highs). In particular, I am watching the SmallCap Consumer Discretionary ETF (PSCD), the SmallCap Financials ETF (PSCF) and the SmallCap Industrials ETF (PSCI) for breakouts that would validate any breakout in IJR. These three need to clear the late January high (red line) for breakouts.
Breadth Improves in Consumer Discretionary Sector
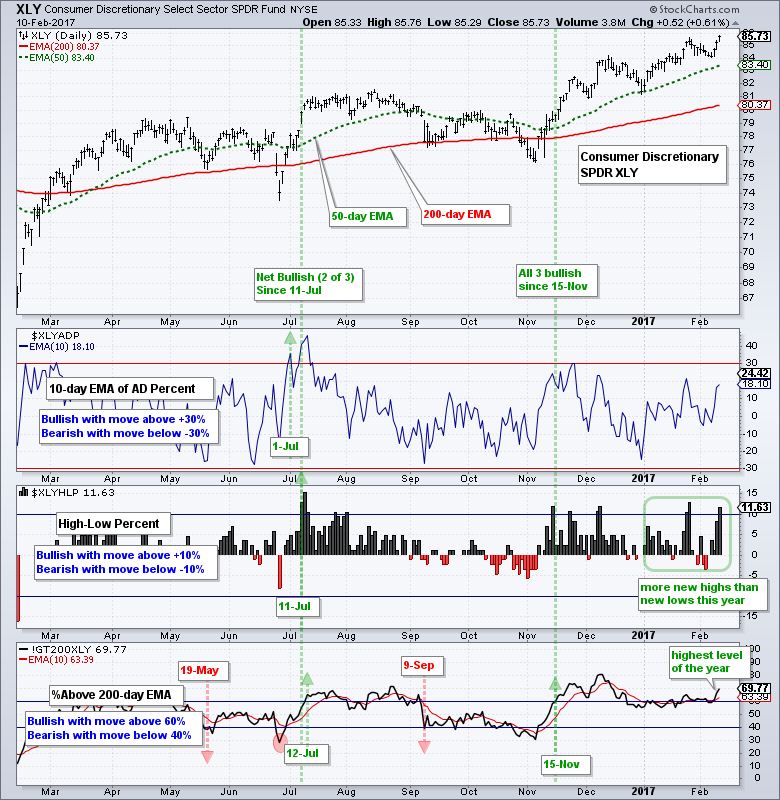
The consumer discretionary sector got a big lift this week with help from housing and retail. The first chart shows the Consumer Discretionary SPDR (XLY) with the three key breadth indicators: the 10-day EMA of AD Percent, High-Low Percent, and %Above 200-day EMA.. First, these breadth indicators have been net bullish since early July and all three have been on bull signals since %Above 200-day EMA (!GT200XLY) moved above 60% on 15-Nov. I am impressed with the surge in High-Low Percent and the uptick in %Above 200-day EMA on Thursday-Friday. The latter is at its highest level of the year (2017). An improvement in the consumer discretionary sector is very positive for the stock market because stocks in this sector are the most sensitive to the economy.
Retail Joins Housing with a Breakout
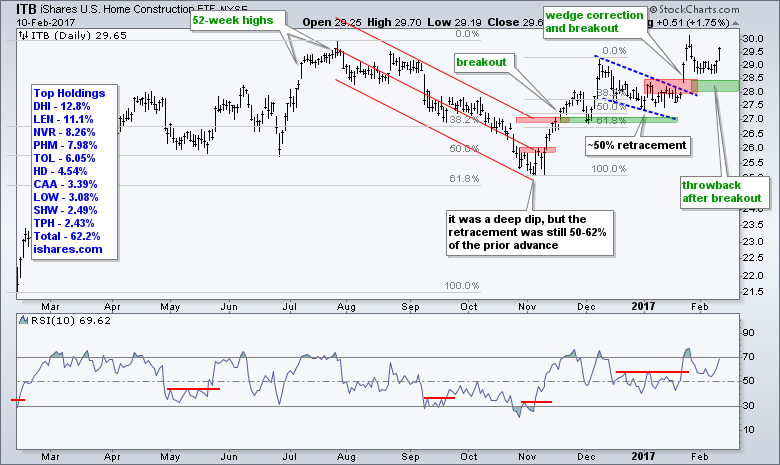
Note that I updated the Art's Charts ChartList with 30 Industry Group ETFs. The Home Construction iShares (ITB) broke out in late January, fell back to towards the breakout zone with a throwback and bounced at the end of the week. This breakout is bullish as long as 28 holds.
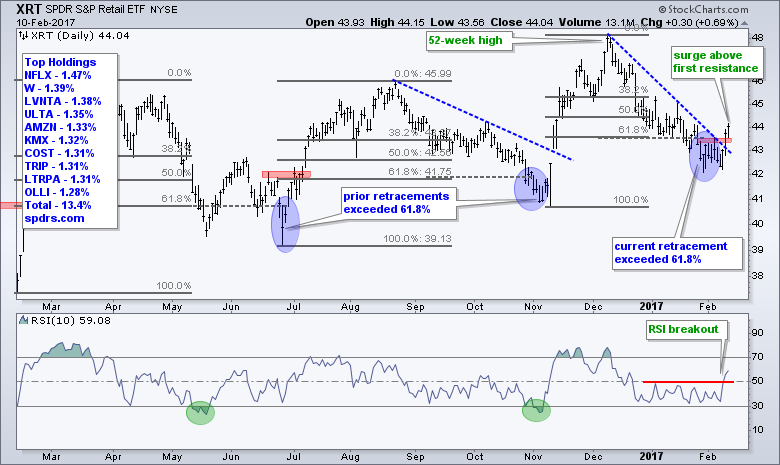
The Retail SPDR (XRT) appears to be in a long-term uptrend with higher lows and a 52-week high in December. This is valuable information because it means the most recent decline is a correction within a bigger uptrend. Even though the decline is deep, the blue ovals show the last three declines overshooting the 61.8% retracements. More importantly, this decline looks like it is reversing with breakouts on the price chart and in RSI.
Technology Leads Market with another New High
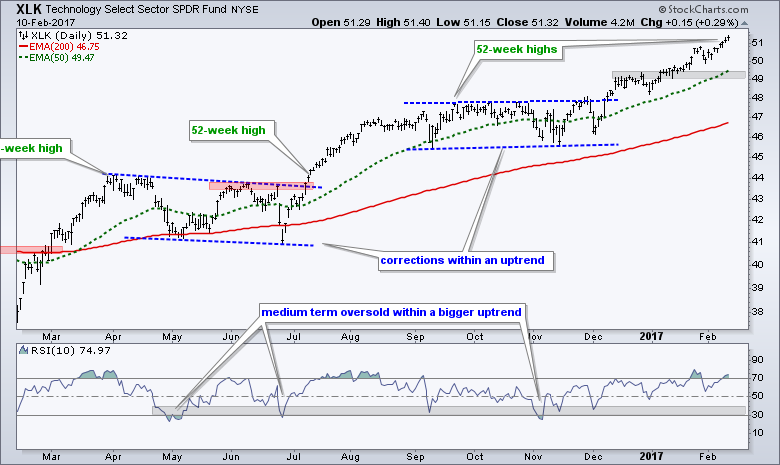
The Technology SPDR (XLK) raced to another 52-week high this week. Once again, tech shows leadership and this is positive for the broader market. Also note that SKYY (cloud computing), HACK (cyber-security), IGN (networking), IGV (software) and XSD (semis) hit new highs this week.
Insurance ETF Leads Finance Sector with New High
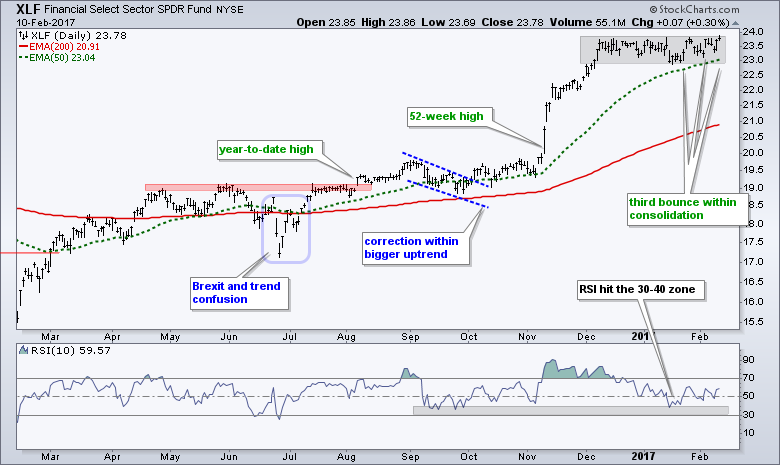
The Finance SPDR (XLF) remains within the confines of a consolidation. Signs of buying pressure are appearing as the ETF popped three times in the last three weeks. The bigger trend remains up and this favors a continuation of the bigger uptrend at some point.
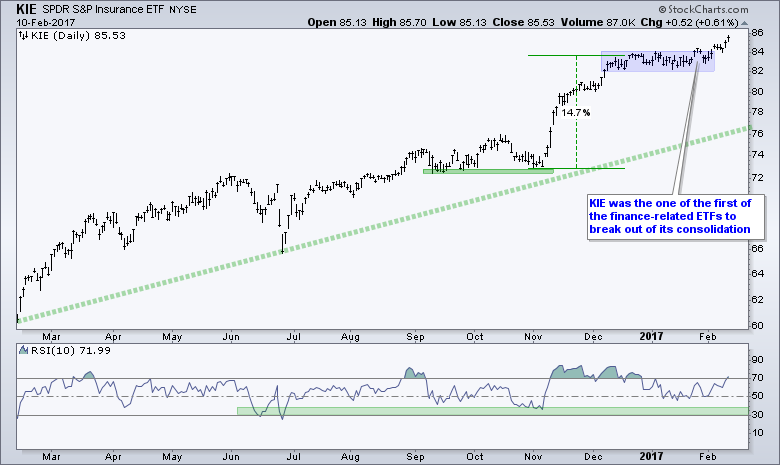
The Regional Bank SPDR (KRE) remains stuck in its consolidation, but the Mortgage REIT ETF (REM) and the Insurance SPDR (KIE) hit new highs this week. They are the finance leaders. The chart below shows KIE exceeding the consolidation high on 26-Jan, falling back into the consolidation and moving to new highs again over the past week. Insurance is one of the stronger groups within the finance sector.
Defense ETF Leads Industrials Sector with Wedge Breakout
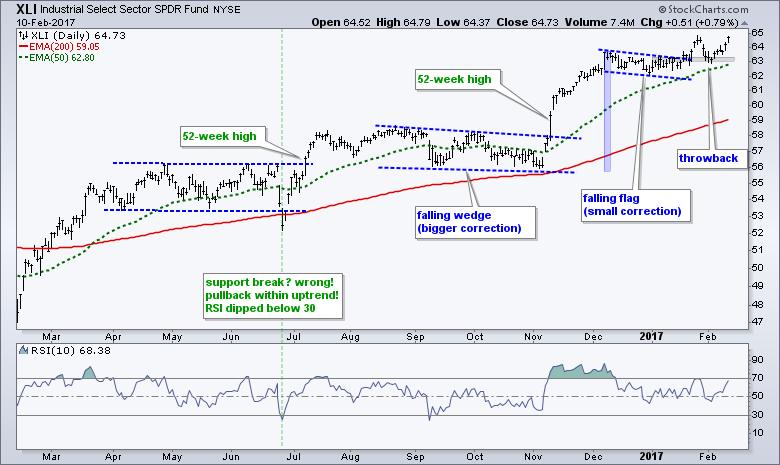
The Industrials SPDR (XLI) hit a 52-week high after the flag breakout in late January and then fell back to the breakout zone with a classic throwback. This breakout zone offered support as XLI turned up again this week.
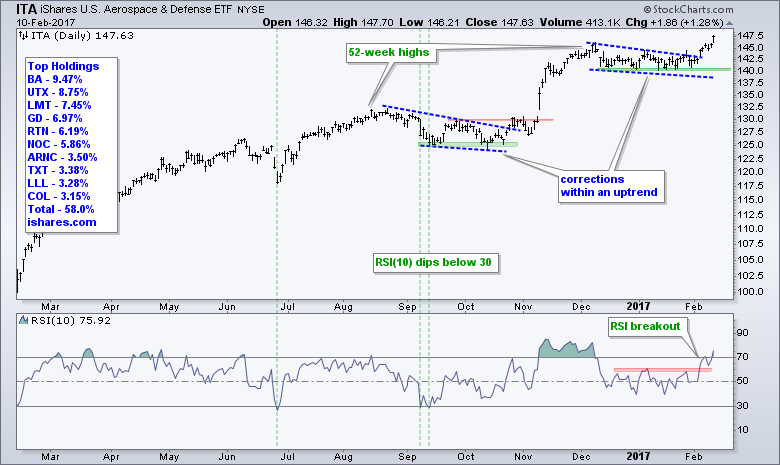
Within the industrials sector, the iShares Aerospace & Defense ETF (ITA) broke out of its falling wedge to signal an end to the shallow correction. Also notice that RSI broke out of its range for a momentum breakout.
Steel ETF Bids for Triangle Breakout
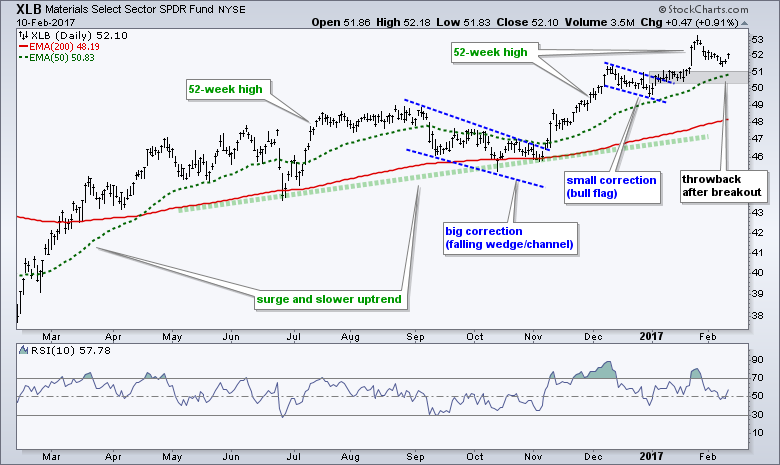
The Materials SPDR (XLB) remains in throwback mode after its breakout in mid January. Notice that the ETF broke flag resistance and this breakout zone is the first area to watch for a small reversal after a pullback (throwback).
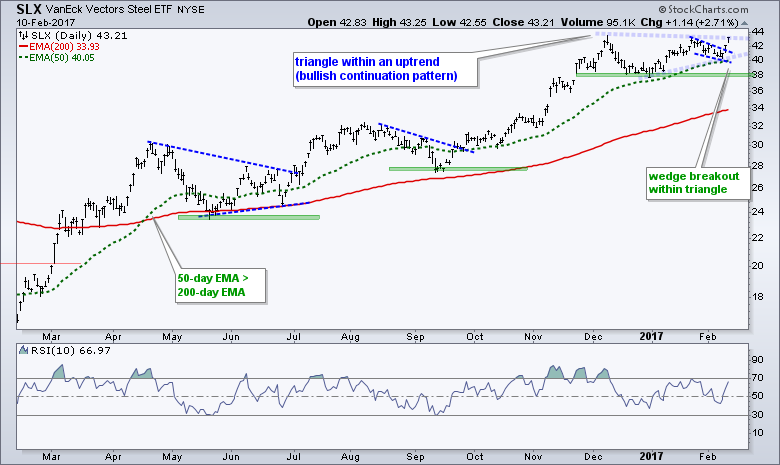
 Steel stocks appear to be perking up as the Steel ETF (SLX) broke out of a falling wedge pattern within a larger triangle. This is a particularly interesting setup because you have a smaller breakout with a big bullish pattern. A triangle in an uptrend is a bullish continuation. The wedge breakout signals a short-term reversal within the pattern and increases the chances for a bigger breakout near 44. Note that steel stocks account for around 50% of the Metals & Mining SPDR (XME), which hit a new high this week.
Energy SPDR Attempts Reversal at Key Retracement
The pullback in the Energy SPDR (XLE) may have extended a little longer and a little further than expected, but it was always viewed as a pullback within a bigger uptrend. The ETF hit a new high in early December and the decline into February returned to the September-October highs (gray area). Also notice that the pullback retraced 50-61.8% of the prior advance. In a two steps forward and one step backward world, the 72 area marks a potential reversal zone - and we may be getting that reversal now. A move above 74 is needed to break flag resistance and "officially" reverse the eight week slide.
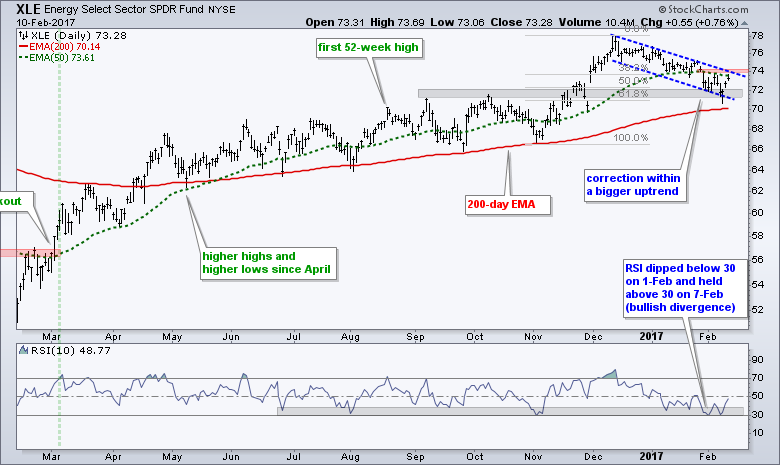 The indicator window shows RSI(10) dipping below 30 for the first time since January 2016. This is "officially" oversold and this is a bullish setup because the bigger trend is up. Chartists looking for even more granularity should look at a two month chart because RSI formed a small bullish divergence over the last two weeks. I don't use divergences very often, but I like this one because it fits with the bigger uptrend. Also notice that hammers formed over the last two weeks on the weekly chart.
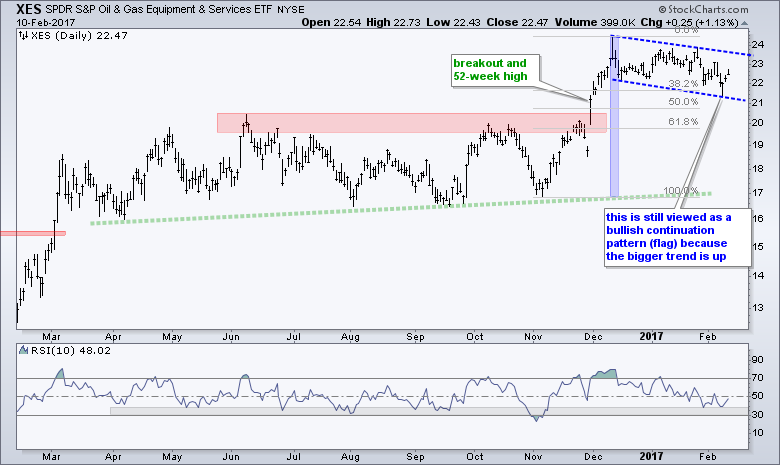
I would expect the Oil & Gas Equip & Services SPDR (XES) to move in the same direction as the Energy SPDR (XLE) because these two have a high positive correlation. They are also positively correlated with the price of oil. On the XES chart, I am trying to keep an eye on the big picture and ignore the noise. This means I see a long-term uptrend because of the November breakout and 52-week high. Assuming a long-term uptrend, I view the decline below 22 as a pullback within this uptrend. I prefer mean-reversion opportunities to breakouts so this means XES is at a very interesting juncture right now.
Biotech SPDR Propels Healthcare Sector
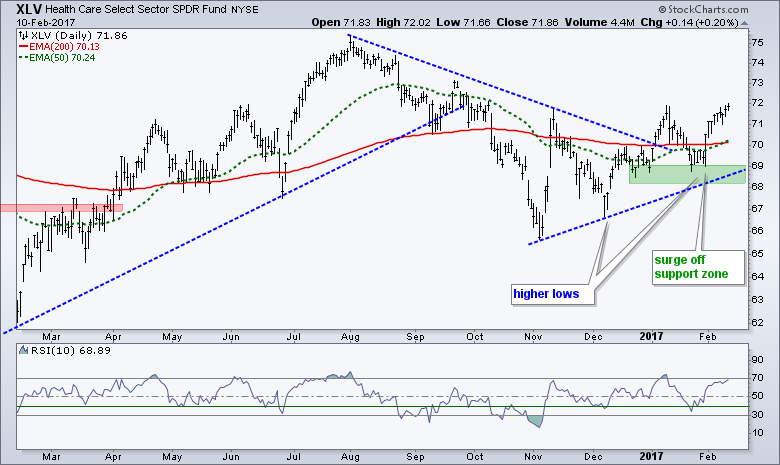
The HealthCare SPDR (XLV) continues to impress since last week's surge off support. The 50-day EMA edged above the 200-day EMA this week and price is above both EMAs.
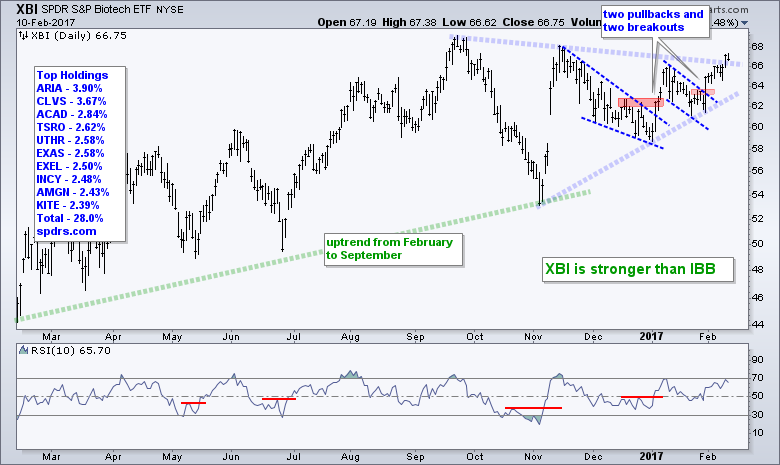
 The Biotech SPDR (XBI) advanced from February to September for a seven month uptrend. A trading range then took shape the last few months and this range narrowed into a triangle. There are now two pullbacks and two breakouts within the triangle, and XBI is poised to break above the triangle trend line. This would be a continuation breakout and I would expect a new 52-week high in the coming weeks or months.
Staples, Utilities and the 30-yr T-Yield
My general opinion of the consumer staples and utilities sectors has not changed. These are not my preferred sectors because we are in a bull market and I think long-term Treasury yields are in long-term uptrends. These sectors often lag in such an environment. The Utilities SPDR (XLU) remains with a rising wedge that retraced around 61.8% of the prior decline. The trend is up as long as the wedge rises and support around 48 holds. The REIT iShares (IYR) sports a similar pattern and setup.
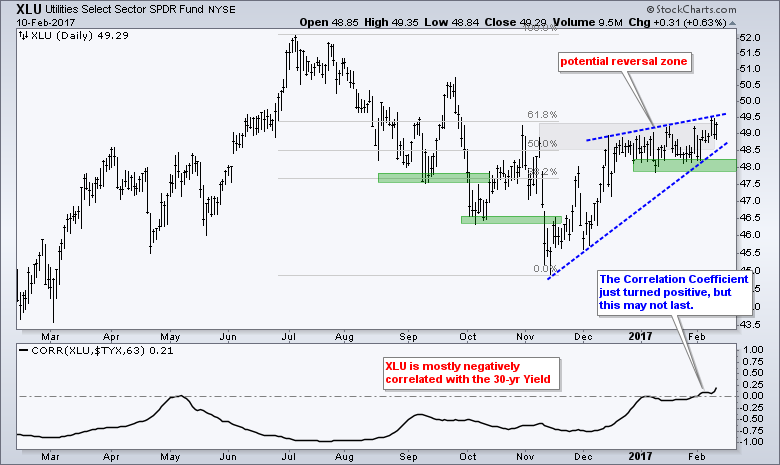
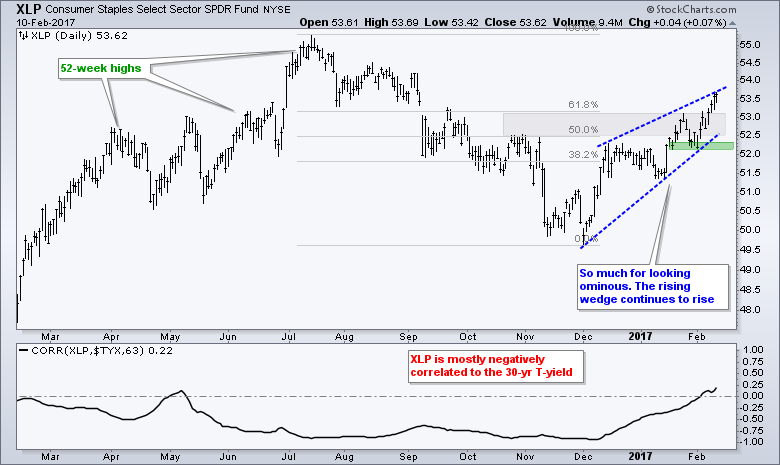 The XLP chart is somewhat stronger because the ETF surged above the 61.8% retracement. The indicator window shows the Correlation Coefficient measuring the 63-day correlation to the 30-yr T-Yield ($TYX). I chose 63 days because this is around 3 months and I am looking for a general idea of the correlation (positive or negative). This is certainly not a timing indicator. In any case, the Correlation Coefficients both edged into positive territory. Even so, the overall picture shows more negative correlation than positive. This suggests that XLP and XLU move in the opposite direction as the 30-yr T-Yield.
Watching Bonds for Clues on Stocks and Gold
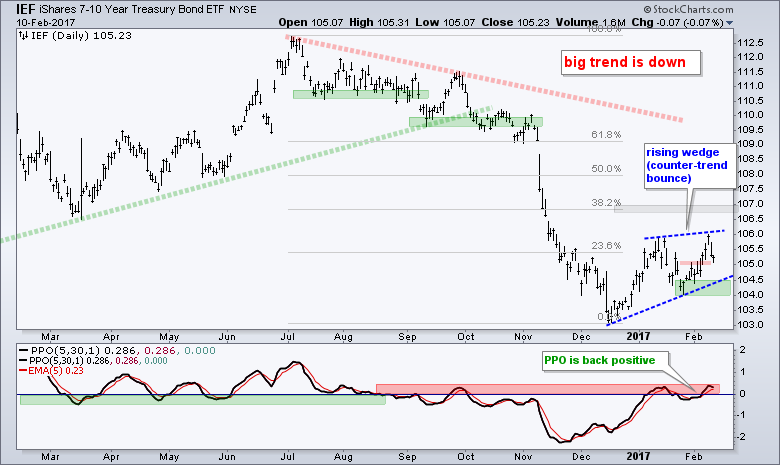
I am most concerned with the action in the bond market this week. The 7-10 YR T-Bond ETF (IEF) surged above 106 on Wednesday and sports an uptrend the last two months. This is weighing on the finance sector and helping staples, utilities and gold. Continued strength in the bond market could affect the stock market and lead to a correction. Bonds are the ultimately safe-haven and the natural alternative to stocks. It is, therefore, negative for risk assets when money flows into bonds.
On the price chart, I still think the 7-10 YR T-Bond ETF (IEF) remains in a long-term downtrend. In addition, the think the current bounce is a counter-trend move that will ultimately fail. When and where are the key questions. The pattern looks like a rising wedge and this is typical for counter-trend bounces or bear market rallies. However, as we saw with gold and consumer staples, these wedges can extend and this bounce could extend to 107. Such a move would be positive for gold and negative for bank stocks. The lower trend line of the wedge and late January low mark the first support zone in the 104-104.5 area. A break below 104 would clearly reverse this short-term uptrend and signal a continuation of the bigger downtrend.
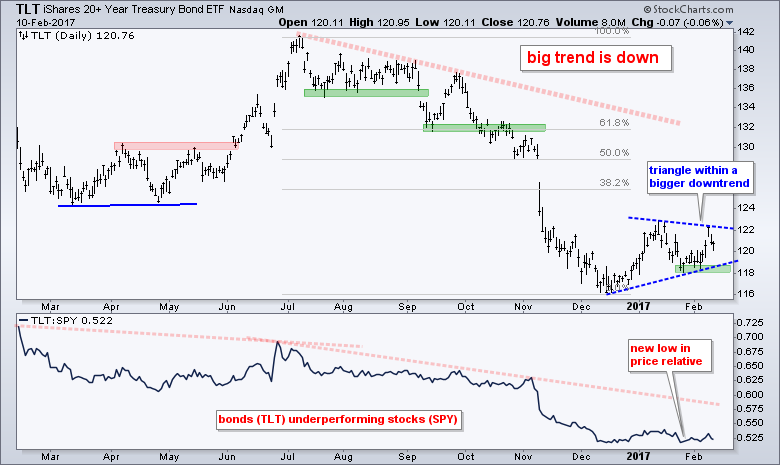
 The 20+ YR T-Bond ETF (TLT) did not exceed its January high and instead formed a lower high. This means a triangle could be taking shape within a bigger downtrend. This is a continuation pattern and the prior move was down. Thus, a break below 118 would signal a resumption of the bigger downtrend.
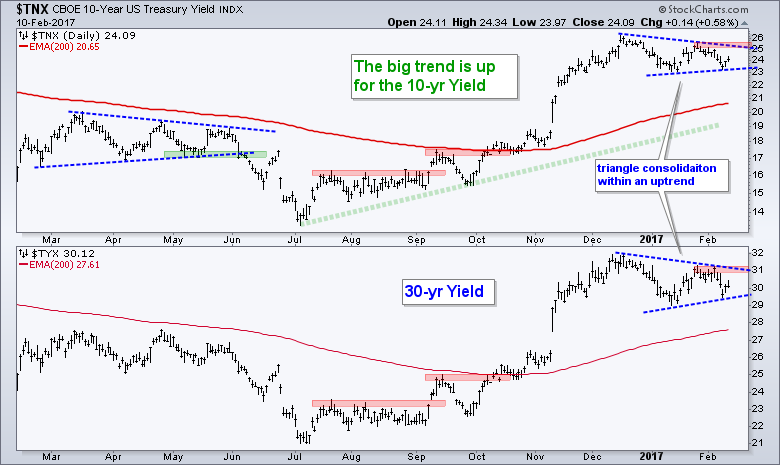
 The 10-yr T-Yield ($TNX) and the 30-yr T-Yield ($TYX) are both forming triangle consolidations - after big advances. These represent a rest within the uptrend and they are continuation patterns. Upside breakouts would signal a continuation of the bigger uptrend. On the reverse side, a break below this week's low would point to a bigger pullback in yields.
Using a Raff Channel to Define Upswing in Gold
I still think the Gold SPDR (GLD) is in a long-term downtrend and that the advance above 118 is a counter-trend move. I am using a Raff Regression Channel to define this advance and mark 114.5 as the key level. A close below 114.5 would reverse this upswing and signal a continuation of the bigger downtrend.
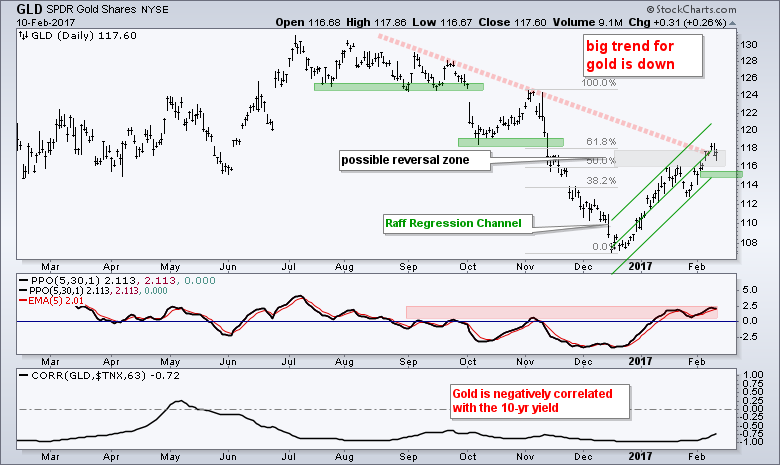 A lot depends on what happens with the 10-yr T-Yield and the Dollar because gold is negatively correlated to both. Weakness in the 10-yr T-Yield and Dollar would be bullish for gold, while strength in both would be bearish for gold.
Copper, Aluminum and Base Metals ETFs Hit New Highs
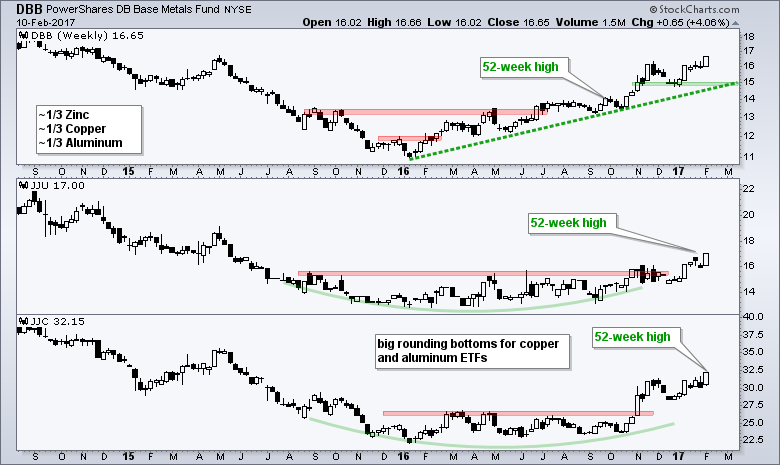
Base metals surged this week with the Copper ETN (JJC) and Aluminum ETN (JJU) notching fresh 52-week highs. The Base Metals ETF (DBB), which is equal parts aluminum, copper and zinc, also hit a new high. Notice that JJC and JJU formed big rounding bottoms and broke out. DBB has been trending higher since January 2016 because zinc has been on a tear the last twelve months.
Oil Forms a Bullish Wedge within a Bigger Uptrend
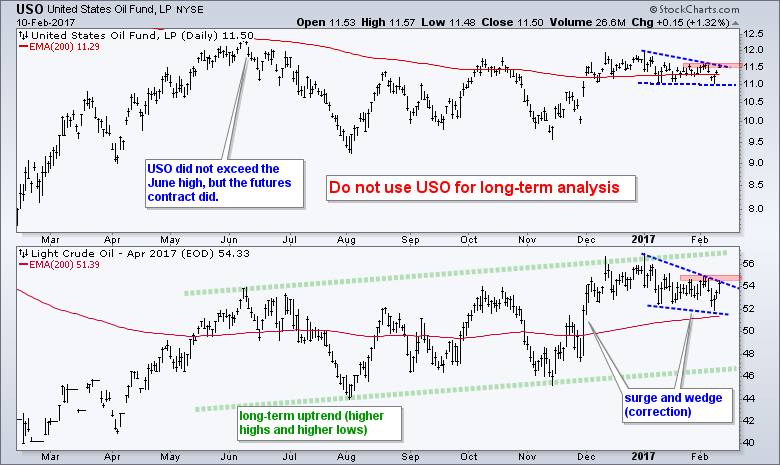
There is no real change in the oil analysis. First, the bigger trend is up because April Crude (^CLJ17) sports a series of higher highs and higher lows. Note that I rolled over to the April Crude contract this week. More recently, crude surged from 46 to 56 and then corrected with a falling wedge. Yep, this is viewed as a pullback or bullish correction. A breakout at 55 would signal a continuation higher.
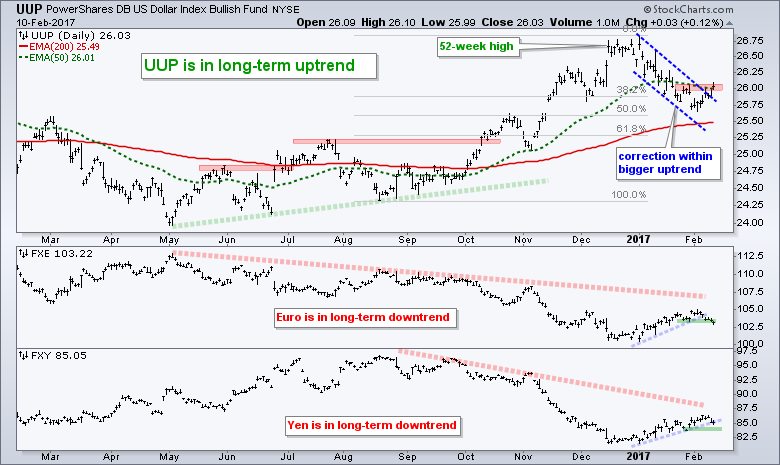
Dollar Makes a Bid to Reverse the Pullback
The US Dollar ETF (UUP) bounced this week as the Euro ETF (FXE) fell four of the last five days. First, the long-term trend for UUP is up and the long-term trend for FXE is down. UUP retraced around 50% of the prior advance with a falling wedge decline to the 25.70 area. This is a good spot for a reversal and the ETF is making a breakout attempt this week. A successful breakout would signal a continuation of the bigger uptrend. Dollar strength would be negative for gold.
******************************************************
Spotting Pullbacks and Upturns within an Uptrend using RSI and MACD Histogram.
Difference between EMA and SMA - Using %Above 200-day EMA for Breadth Analysis.
Backtesting Different Moving Average Pairs with SPY, QQQ and IWM.
ETF Master ChartPack - 300+ ETFs organized in a Master ChartList and in individual groups.
Follow me on Twitter @arthurhill - Keep up with my 140 character commentaries.
****************************************
Thanks for tuning in and have a good day!
--Arthur Hill CMT
Plan your Trade and Trade your Plan
*****************************************


