
 |
---- Introduction |
Introduction
This System Trader article will introduce and update a momentum trading system that I presented at ChartCon in September 2016.
First and foremost, note that momentum trading systems are by definition volatile because they choose stocks with the strongest upside momentum. These systems perform very good during broad market upswings and generate drawdowns during downswings.
Momentum systems are largely successful because the gains on the upswings are bigger than the losses on the drawdowns. Even if you do not use this momentum system, there are several techniques and takeaways in this article that can help with stock selection.
Trading Universe and Timeframe
The first thing we need is a trading universe and a timeframe. I chose the S&P 1500 because it covers large-caps, mid-caps and small-caps. The Russell 3000 is a broader index, but the selection criteria for the Russell 2000 (small-caps) is not as stringent as that used for the S&P Small-Cap 600. I am looking for higher quality small-cap stocks with a little less volatility and opted for the S&P Small-Cap 600.
I am using a weekly timeframe to filter out some of the noise and reduce trading signals. The signals are based on weekly closing prices and the trades are based on the next open. This means all the indicators are set to a weekly timeframe as well. This also means that chartists can evaluate the signals anytime between Friday's close and Monday's open.
Culling the Herd
With some 1500 stocks in our universe, we need a way to cull the herd and narrow the list of tradable candidates. Chartists can filter for volatility, liquidity, minimum price and maximum move to exclude unacceptable stocks. Keep in mind that this is a personal choice. Some traders may like low-price stocks or stocks with high volatility. While such stocks can, and often do, improve returns, they do so at the expense of higher drawdowns. I prefer lower drawdowns.
Volatility Filter
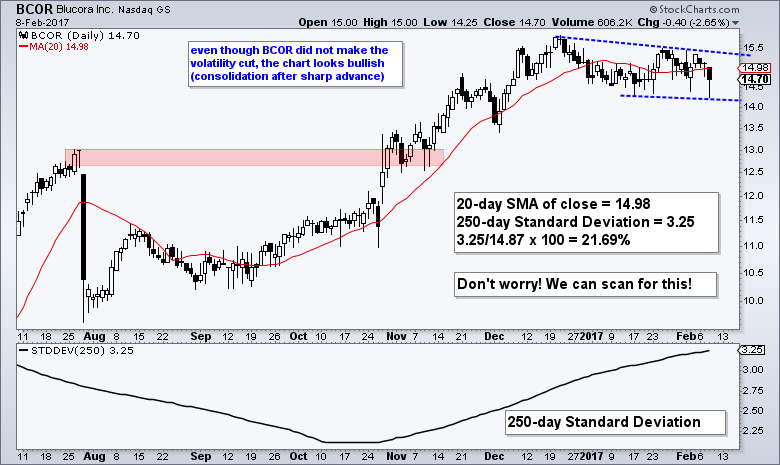
The volatility filter excludes stocks with a normalized standard deviation above 20%. Even though StockCharts does not have this indicator, we can create it in the scan engine with a little code, which is shown at the end of this article. The normalized standard deviation is the 250-day Standard Deviation (one year) divided by the 20-day SMA of the close (monthly closing average).
Minimum Liquidity Filter
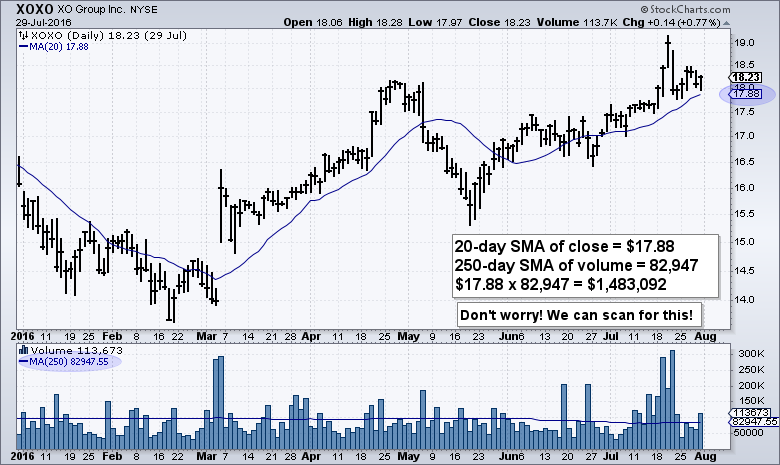
The next filter is for minimum liquidity. Again, StockCharts does not have an indicator for Dollar-Volume, but we can scan for Dollar-Volume. I am basically looking for stocks that have a minimum daily Dollar-Volume greater than $5 million.
Minimum Price Filter
Minimum price is designed to filter out stocks that are less than $10. I realize that the potential returns seem higher with "low priced" stocks, but the inclusion of these stocks in a trading system usually increases the Maximum Drawdown. Again, it is a personal preference.

Maximum Rate-of-Change Filter
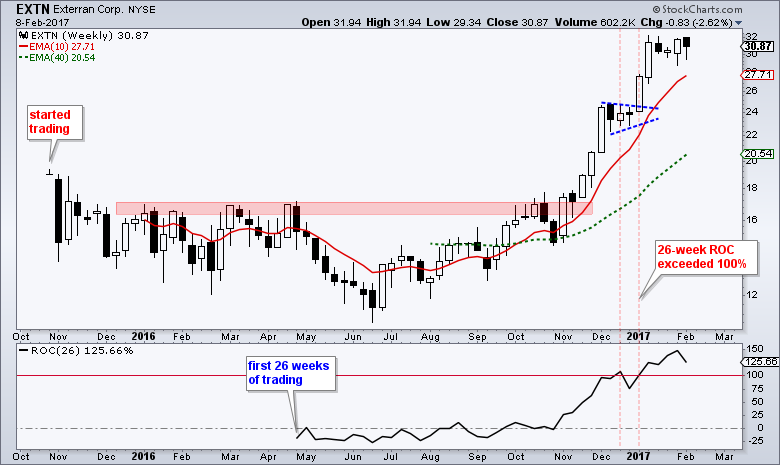
The final filter is to exclude stocks that have already doubled in the last six months. We can measure this by plotting and scanning for the 26-week Rate-of-Change. The chart below shows Exterran with a nice breakout in November and a strong move into January. However, the 26-week Rate-of-Change exceeded 100% the first week of January so it would be excluded from new positions.
Even though the number varies, these four filters will exclude anywhere from 100 to 250 stocks. This scan picked out 236 stocks based on the February 8th close. Thus, this scan reduced the trading universe to around 1264 (1500 - 236 = 1264).
The All Important Trend-Market Filter
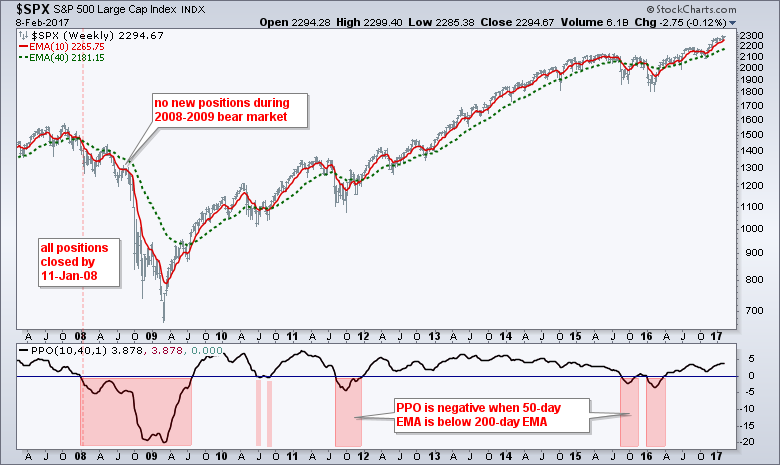
This system only trades when the S&P 500 is in a long-term uptrend (bull market), which is measured by the Golden EMA Cross. Thus, the system looks for long positions when the 50-day EMA is above the 200-day EMA for the S&P 500.
The system does not look for long positions when the 50-day EMA is below the 200-day EMA. Note that the system does not exit all long positions when the 50-day EMA moves below the 200-day EMA. The exits happen when a stock's ranking for the 26-week Rate-of-Change drops out of the top 150.
Setting the Trading Rules
This is a rotational trading system that buys stocks with the strongest upside momentum and sells when they drop below a certain threshold. I also added a trend filter to make sure the 10-week EMA is above the 40-week EMA.
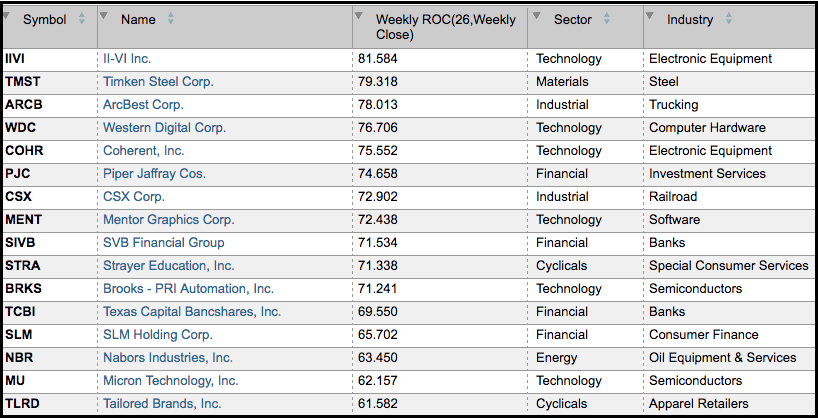
The portfolio starts by buying the 15 stocks with the highest 26-week Rate-of-Change (top 15). Note that Rate-of-Change (ROC) is one of the purest momentum indicators. These stocks are held until they drop out of the top 150 (ranked by ROC). The stock is then sold and replaced by the stock with the highest Rate-of-Change (26-week).
The signals based on weekly closing prices and the buy/sell prices are based on the next open. The commissions are $10 per trade, the portfolio starts at $100,000 and there are 15 positions.
Backtesting is based on historical constituents for the S&P 1500 to prevent survivorship bias. This is very important because many stocks in the S&P 1500 today were not part of the index ten years ago. Also note that the data was adjusted for dividends, which means we are dealing with total return data.
Backtest Results
The table below shows backtest results for buy-and-hold for SPY and the golden EMA cross for SPY on the first two lines. These are the benchmark returns. The third line shows results for the momentum rotation system using stocks in the S&P 1500. The Compound Annual Return of 14.30% is quite good and the Maximum Drawdown was less than 21%, which is also quite good considering the returns. There were 1346 total trades over a 16 year period and this averages out to around 84 trades per year or 7 trades per month.
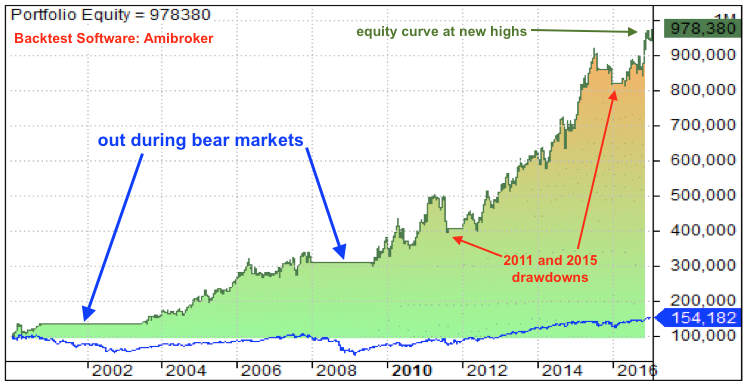
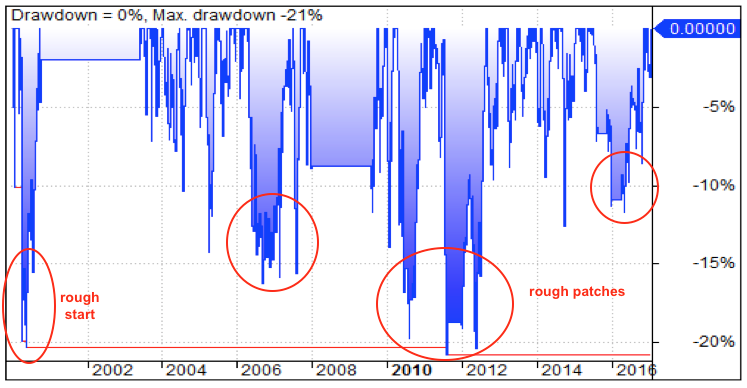
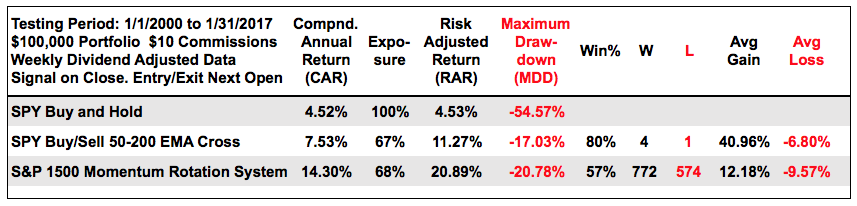 The system produced positive returns because the gains were bigger than the losses. While that may sound obvious, notice that the Win% was 57% and the Average Gain was around 2.5% greater than the Average Loss. There are going to be plenty of losing trades in this system (43%) and the losers will average around 10%. It is a winning system on the whole, but sticking with such a system would require some strong discipline. The charts below show the equity curve and the Maximum Drawdowns.
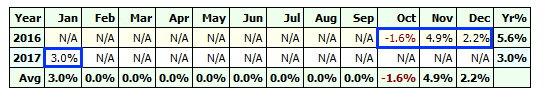
This trading system was originally presented in September 2016. I ran a backtest from 1-October-2016 to 31-January-2017 to see how it performed the last four months. October was a down month, but November, December and January produced respectable gains. This is hardly surprising given the market surge from early November to mid December.
Conclusions
The idea here is not to present a turn-key trading system, but to show the power behind momentum and relative strength. The top 150 stocks in the scan are the leaders and these are great candidates for long positions. Chartists can use these scan results to create ChartLists and analyze the individual charts for bullish setups.
In theory, this trading system could be run "as is" by traders with the discipline to stick with the system. Keep in mind that the backtest results are based on taking every trade and sticking to the system. Also note that past performance DOES NOT guarantee future performance. I do not think we can pass judgment on a weekly system in just a few months and would evaluate the results based on rolling six-month returns.
And finally, chartists should check to make sure the top stocks are not involved in a merger or acquisition. I have no way of doing this with the backtests, but you can check MergerInvesting.com for a list of pending mergers. There is no sense wasting time on stocks already involved in a deal.
Scan Code
You can copy the scan code below and paste it into the "advanced scan workbench" to run this momentum rank yourself:
// set stock universe
[group is SP500] or [group is SP400] or [group is SP600]
// weed out extremely high volatility
AND [Std Deviation(250) / SMA(20,Close) * 100 < 20]
// insure daily Dollar Volume is greater than $5 million
AND [SMA(20,close) * SMA(250,volume) > 5000000 ]
// weed out low-priced stocks
AND [SMA(20,Close) > 10]
// weed out stocks that have already doubled
AND [Weekly ROC(26) < 100]
// only stocks that are in long-term uptrend
AND [Weekly EMA(10,close) > Weekly EMA(40,close)]
Rank by Weekly ROC(26)
FAQ
Did you test other momentum periods? Yes, the Compound Annual Return/Average Drawdown are as follows: 13-week Rate-of-Change (4.06%/32.07%), 26-week (14.30%/20.78%), 39-week (11.86%/24.14%) and 52-week (9.39%/26.57%). The 26-week Rate-of-Change, which measures around six months, tested the best and seems to mark the sweetspot.
Did you test different position quantities? Yes, The CAR/MDD are shown with each test. The results are as follows: 10 positions (12.46%/28.86%), 15 positions (14.30%/20.78%), 20 positions (12.41%/21.58%), 25 positions (11.22%/22.09%) and 30 positions (10.43%/22.55%).
Did you test different momentum cutoffs? Did you test different momentum cutoffs? The sell signal triggers when the 26-week Rate-of-Change drops out of the top 150. I also tested this using the top 100 stocks (13.07%/21.61%), the top 200 (13.25%/23.16%), the top 250 (14.70%/24.15%) and the top 300 (13.95%/24.59%).
Have you tried reducing the Maximum Rate of Change filter? The backtest above filters out stock that are up more than 100% in 26 weeks (ROC(26)). This produced a CAR of 14.3% and a MDD of 20.89%. Reducing the Max ROC(26) to 50% resulted in a much lower CAR (4.95%) and a MDD of 10.90%.
Have you tried adding stops? No. This is a momentum rotation system. It rotates into the stocks with the strongest momentum and rotates out when they are not the strongest.

******************************************************
Thanks for tuning in and have a good day!
--Arthur Hill CMT
Plan your Trade and Trade your Plan
******************************************************
Other Articles in the SystemTrader Series:
- Introduction to Key Performance Metrics - Quantifying the Golden Cross for the S&P 500
- Golden Cross and 5 Major Indexes - EMAs versus SMAs - Do Short Positions Add Value?
- Short-term Moving Average Crosses - Differences in Major Indexes - Do Trend Filters Work?
- MACD Crosses - Rules to Reduce Drawdowns and Increase Gains - Testing PPO Strategy
Follow me on Twitter @arthurhill - Keep up with my 140 character commentaries.


