.... Bond Market Moves Ahead of the Fed
.... S&P MidCap SPDR Becomes Short-term Oversold
.... Copper ETN Pulls Back within Uptrend
.... Valero and Marathon (Refiners) Hold Up within XLE
.... Computer Associates, QQQ and New Highs
.... FFIV, PFPT and QLYS Bounce within Cyber-Security Group
.... Three Biotechs to Watch (CELG, ILMN, REGN)
.... LULU and FIVE Break Down
.... Nissan and Wabco Break Out to Lead Auto Group
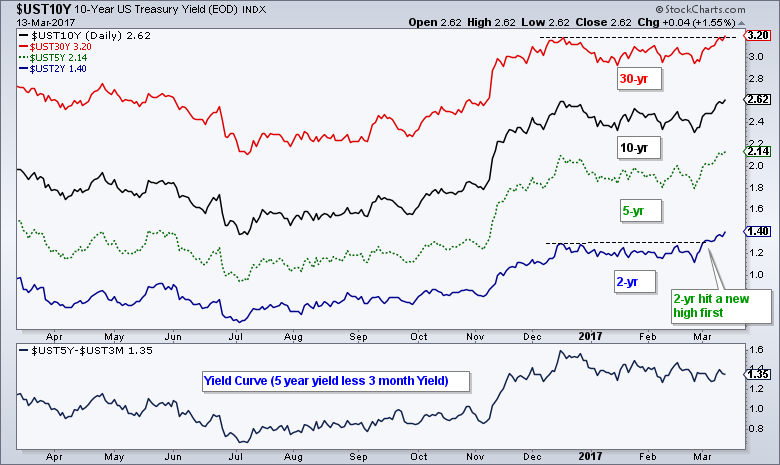
The markets may be on edge the next two days because there is a Feb meeting starting today and policy statement on Wednesday afternoon. Bonds already made their decision as the 20+ YR T-Bond ETF (TLT) broke down last week and the 2-yr T-Yield ($UST2Y) surged to its highest level since June 2009. Note that 2-yr yield hit a new high on March 2nd and the short end of the curve is leading the long end. The 30-yr yield hit a new high on Monday. The rise in yields means money is moving out of bonds and this is net positive for stocks.
S&P MidCap SPDR Becomes Short-term Oversold
I featured a short-term trading strategy last week and MDY triggered a bullish signal. When the 50-day EMA is above the 200-day EMA for the S&P 500 (a bull market), the system looks for pullbacks in SPY, QQQ, MDY, IJR and DIA. The system buys when RSI(5) moves above 30 and sells when price closes below the Chandelier Exit (22,1). There are no stops and the exit is simply based on the Chandelier Exit. MDY triggered a bullish signal when RSI(5) moved above 30 last week.
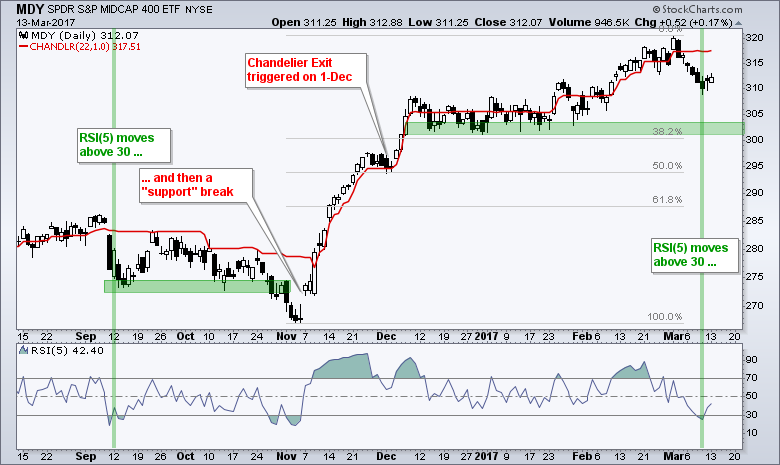 I do not know if this signal will work or fail and I do not know what path MDY will take until the exit. Nobody does. The last buy signal triggered on September 12th and an exit signal did not trigger until December 1st. In the meantime, MDY drifted lower into October and even broke so-called support in early November. RSI also dipped below 30 three more times. It would have been tough to ride it out, but this what system trading involves. The backtest results are based on taking every signal and following the rules - without question. MDY could dip below 300 and break so-called support again before an exit setup materializes. Thus, it may be best to hold off if you think the stock market will correct in the coming weeks.
Copper ETN Pulls Back within Uptrend
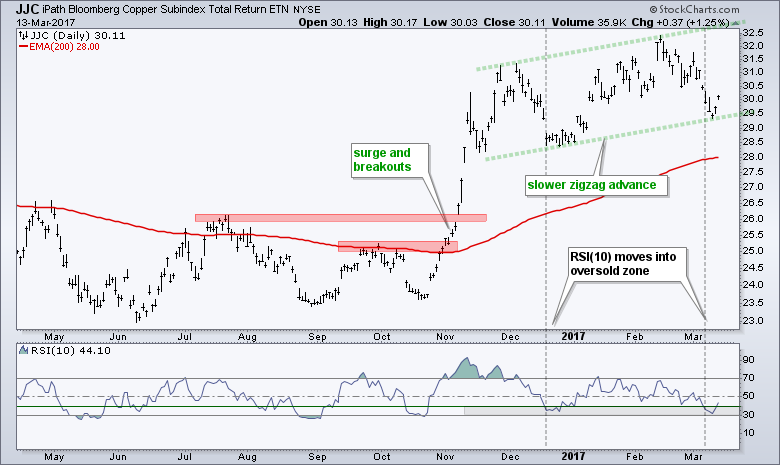
The next chart shows the Copper ETN (JJC) with a similar strategy at work. First and foremost, note that JJC is in a long-term uptrend after the surge and breakouts in October-November. This means I am looking for pullbacks within the uptrend. RSI(10) is less sensitive than RSI(5) so I mark an oversold zone in the 30-40 area with RSI(10). JJC is becoming oversold when RSI(10) moves below 40 and I am then on alert for an upturn. Sometimes RSI(10) continues below 30, sometimes it doesn't. In any case, RSI turned up the last two days and JJC bounced with a higher low forming. It looks like a rising channel could be taking shape and the uptrend continuing.
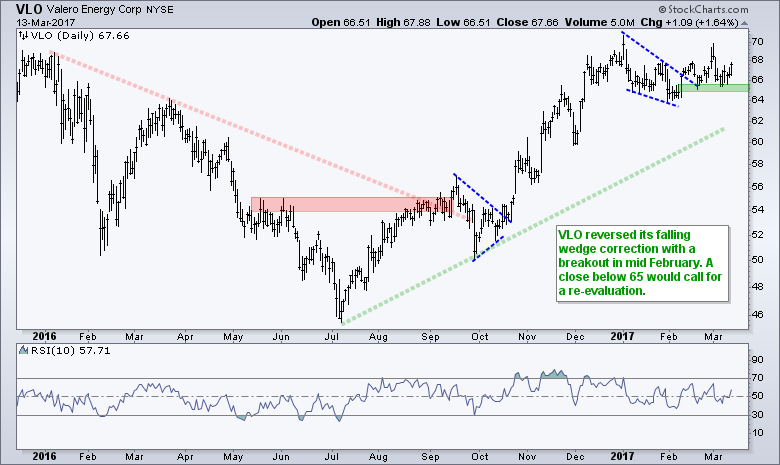
Valero and Marathon (Refiners) Hold Up within XLE
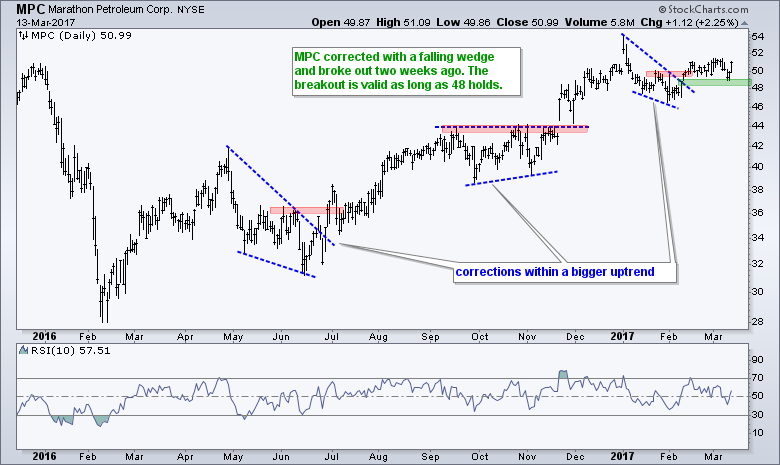
I highlighted two refiners two weeks ago and these two held up a lot better than the Energy SPDR (XLE). Refiners are downstream and make their money on the end product, gasoline. The first chart shows Marathon Petroleum (MPC) with a wedge breakout holding as the stock surged off the breakout zone the last two days. The second chart shows Valero (VLO) with a similar setup and breakout.
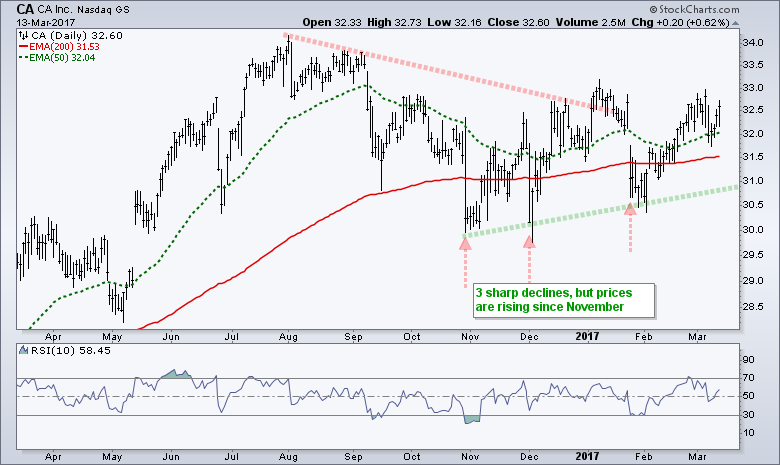
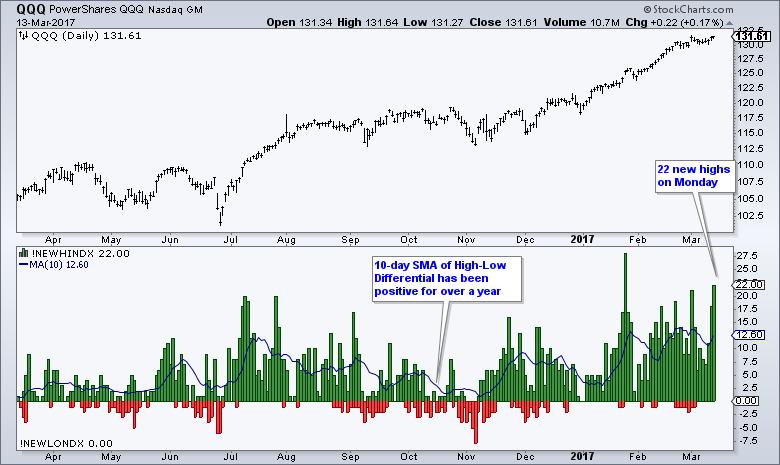
Computer Associates, QQQ and New Highs
I don't have a real signal or setup to show for Computer Associates (CA), but the chart looks bullish overall. Notice that the stock was hit three times with intense selling pressure for a day or two and then quickly recovered. There is a slight upward bias in prices since November and the 50-day EMA is above the 200-day EMA.
 CA is also part of the Nasdaq 100 and there were 22 new highs in this index on Monday. Tech is the place to be. The chart below shows the new highs and new lows for the Nasdaq 100. Notice that the 10-day SMA (blue line) of the high-low differential has been positive for over a year.
 The next two stocks are from the technology sector, but I have no idea what they do. I can, however, comment on the chart.
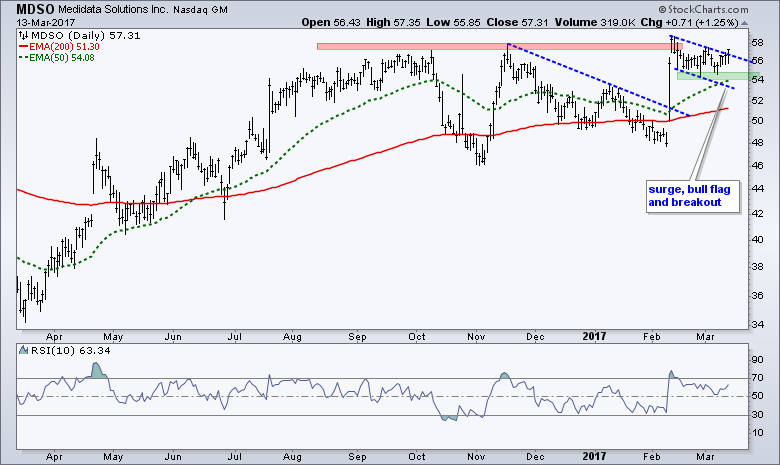
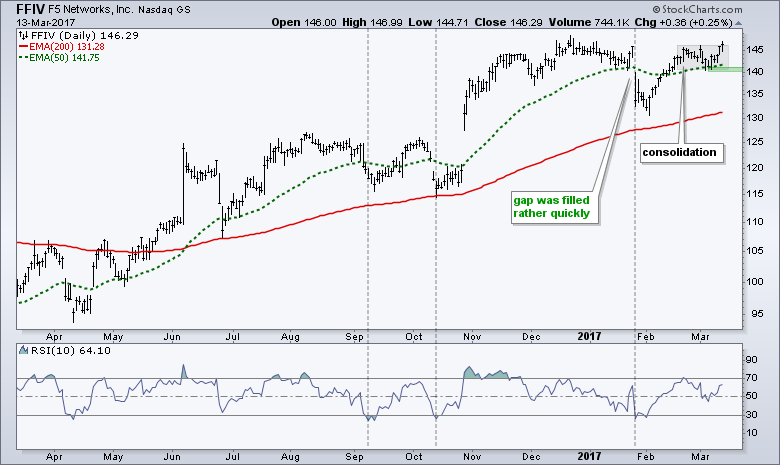
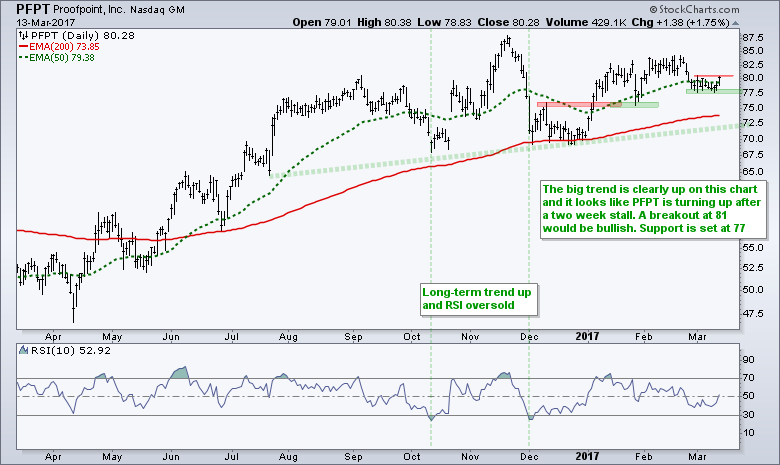
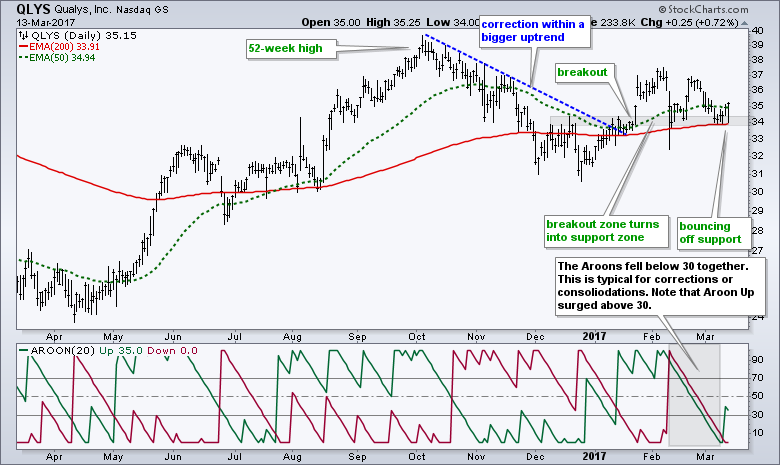
FFIV, PFPT and QLYS Bounce within Cyber-Security Group
The next three stocks come from the Cyber Security ETF (HACK). F5 Networks (F5) may be the next Nasdaq 100 stock to hit a new high as it attempts to break out of its consolidation. Proofpoint (PFPT) and Qualys (QLYS) broke out in mid January and fell back toward their breakout zones in February. The pullbacks may be ending as both bounced on Monday.
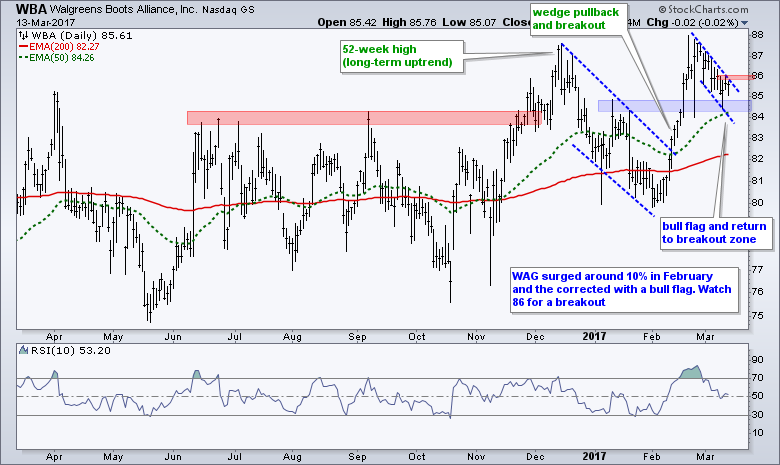
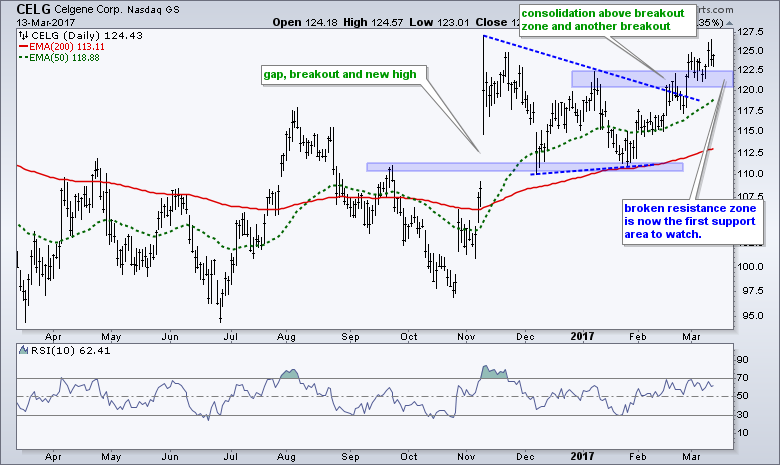
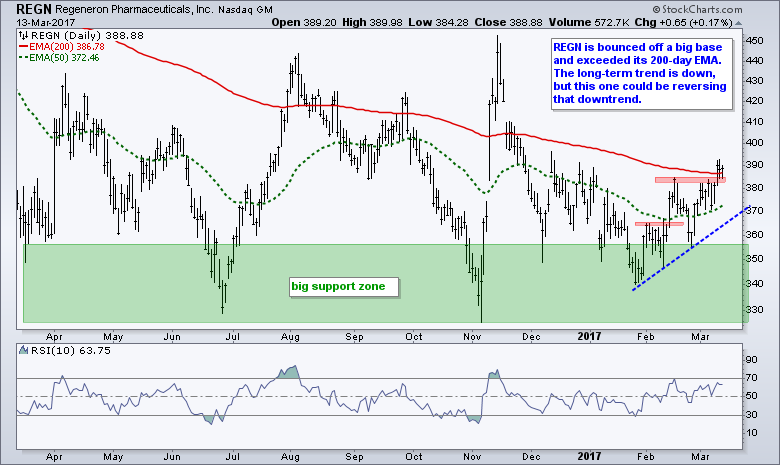
Three Biotechs to Watch (CELG, ILMN, REGN)
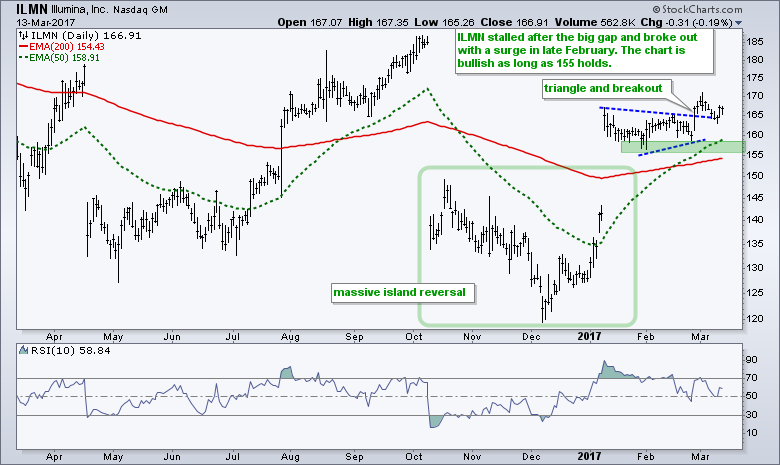
The next three charts come from the biotech group, which is one of the strongest groups in 2017. Celgene (CELG) broke out of its consolidation with a surge in February. Notice that the broken resistance zone turns into the first support zone. Illumia (ILMN) is holding its triangle breakout.
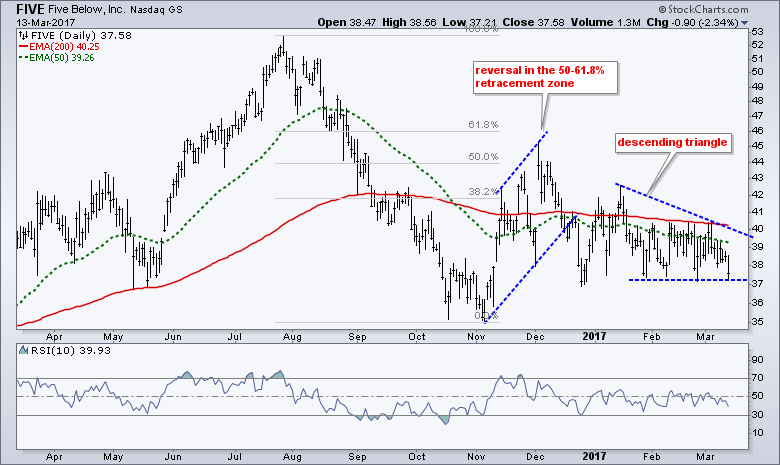
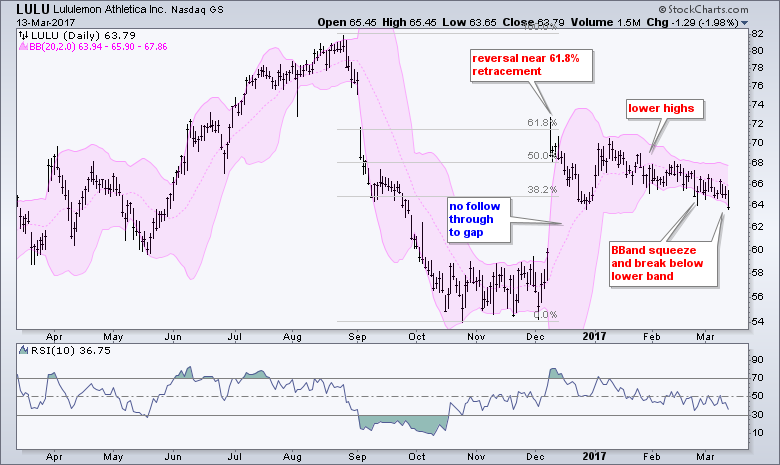
LULU and FIVE Break Down
The next two stocks are in the consumer discretionary sector and the apparel industry group. Retail is the weakest group in the market and these two stocks are leading lower. Warning: Five Below (FIVE) and Lululemon (LULU) report earnings next week. FIVE formed a bearish continuation pattern (descending triangle) and is on the verge of a support break. LULU never followed through on the gap and moved below the lower Bollinger Band.
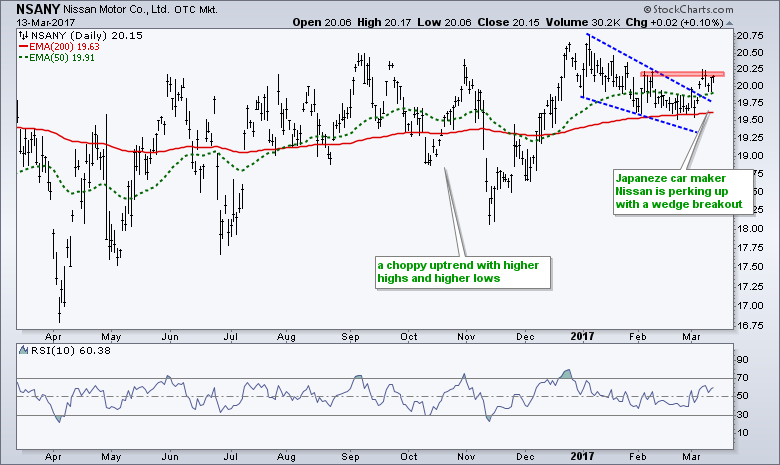
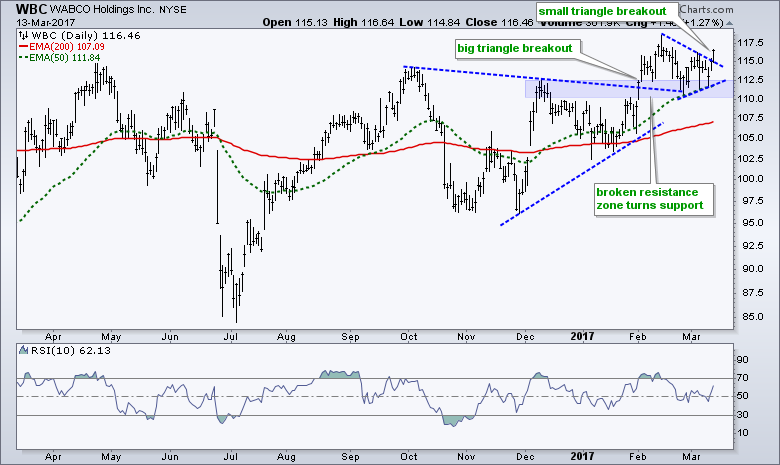
Nissan and Wabco Break Out to Lead Auto Group
The next two charts come from the automobile group. Nissan (NSANY) is, of course, the Japanese carmaker. The long-term trend is choppy, but there is a clear upward bias. The stock most recently broke out of a wedge correction. WABCO (WBC) is in the auto parts group and this is one of the stronger groups in 2017.
******************************************************
Spotting Pullbacks and Upturns within an Uptrend using RSI and MACD Histogram.
Difference between EMA and SMA - Using %Above 200-day EMA for Breadth Analysis.
Backtesting Different Moving Average Pairs with SPY, QQQ and IWM.
ETF Master ChartPack - 300+ ETFs organized in a Master ChartList and in individual groups.
Follow me on Twitter @arthurhill - Keep up with my 140 character commentaries.
****************************************
Thanks for tuning in and have a good day!
--Arthur Hill CMT
Plan your Trade and Trade your Plan
*****************************************


