.... The Airline Group is Tiny, Really Tiny
.... Comparing the Airline Index with the Airline ETF
.... JETS Hits Oversold Zone
.... The Big Three (AAL, DAL, UAL)
.... Three Regional Carriers (HA, JBLU, SKYW)
.... Where to Find a List of Airline Stocks
.... Two More Charts with Bullish Setups (F and AKAM)
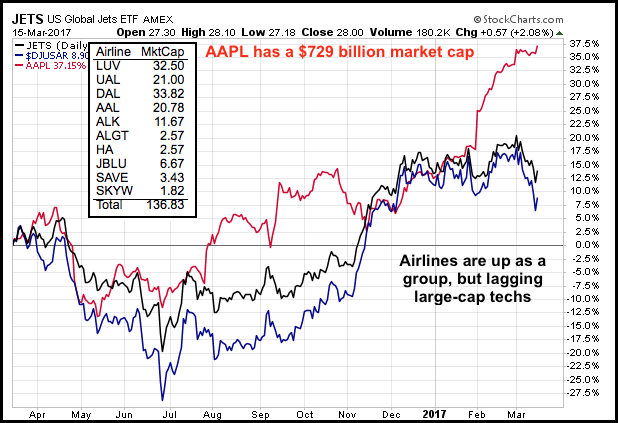
The Airline Group is Tiny, Really Tiny
The focus today will be on the airline group because I am seeing short-term oversold conditions within a long-term uptrend. Chartists can follow the group by analyzing the Airline ETF (JETS) or the DJ US Airline Index ($DJUSAR). The ETF is, of course, tradable, but the average volume is not that high. Keep in mind that the airline industry is quite small as a whole. The total market cap of the top ten US airlines is around $136 billion. In comparison, Apple has a market cap of $729 billion, which is five times more than the entire group.
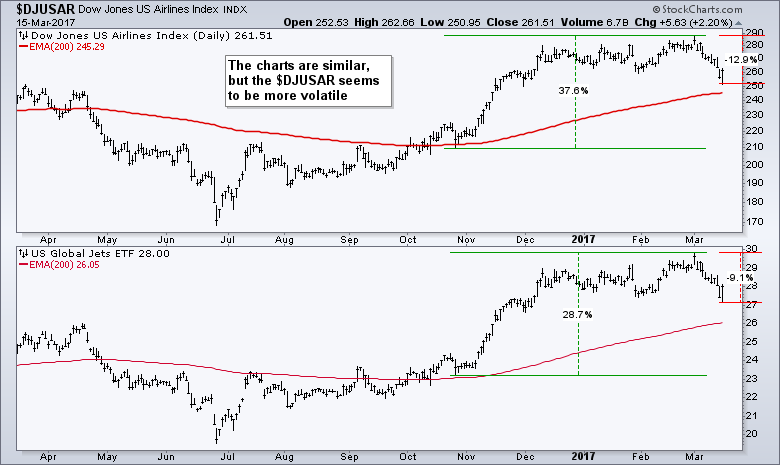
Comparing the Airline Index with the Airline ETF
Personally, I like the ETF because it is easy to find a list of the components and their weightings. Simply go to usglobaletfs.com for the most recent list. Good luck finding components and weightings for the Dow Jones industry groups. I have tried over the years and always came up empty handed or stale information. The chart below shows the DJ US Airline Index in the top window and the Airline ETF in the bottom window. The DJ US Airline Index is more volatile because it shows a bigger gain on the way up and a bigger loss on the pullback.
JETS Hits Oversold Zone
As noted at the beginning, I was attracted to airline stocks because they pulled back within a bigger uptrend. This pretty much sums up my trading style. I look for short-term oversold conditions when the bigger trend is up. The Airline ETF hit 52-week highs in November and February so the big trend is clearly up. The ETF fell back sharply in early March and then reversed near the prior low with an outside day on Wednesday. RSI hit 30.31 on Tuesday and the outside reversal on Wednesday is enough to suggest that the correction may be ending.
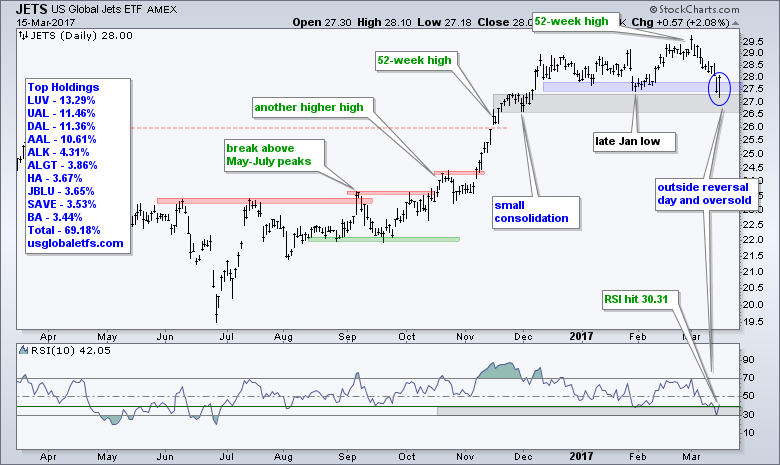
It is tempting to call the late January low "support", but I am suspect of support and resistance levels for ETFs and indexes with dozens of moving parts. See this ChartWatchers article for details.
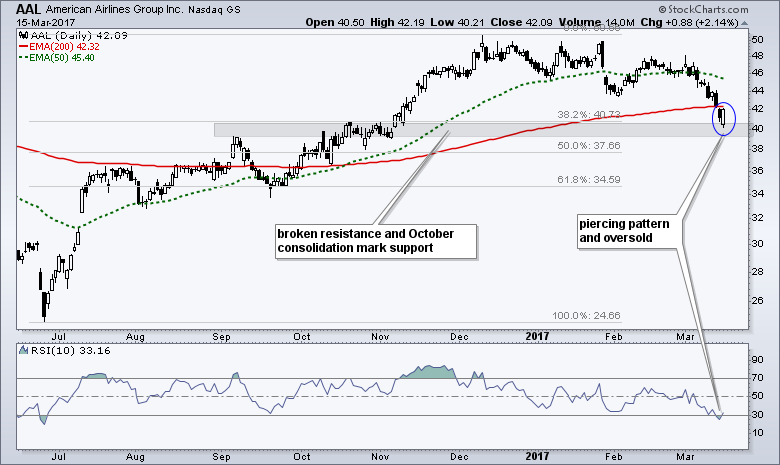
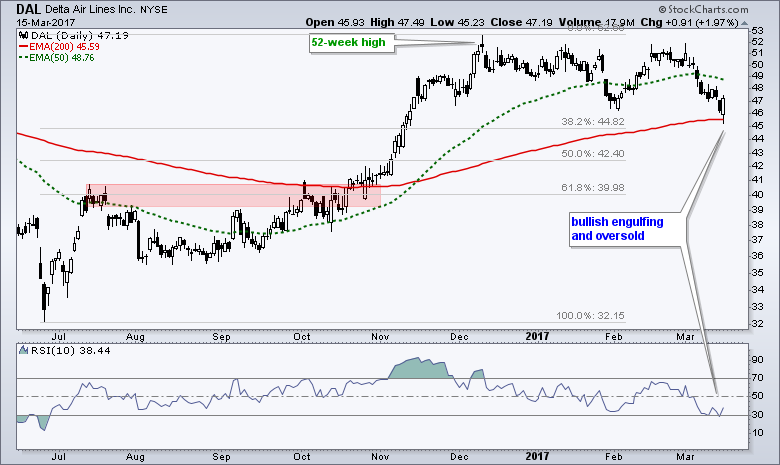
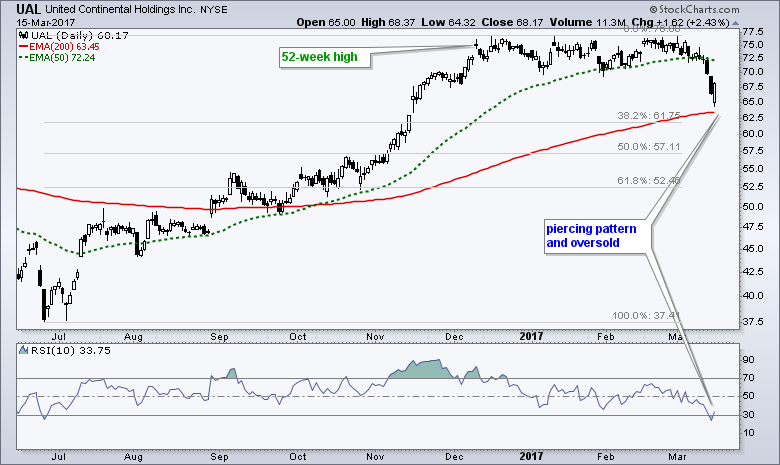
The Big Three (AAL, DAL, UAL)
The next three charts show the big legacy carriers: American Airlines (AAL), Delta Airlines (DAL) and United Continental (UAL). The 50-day EMA is above the 200-day EMA for all three and all three recorded 52-week highs in December. I am not showing the EMAs because I like clean charts. In addition, I do not think moving averages should be considered robust support or resistance levels. All three retraced around 38% of the prior advance and became oversold with Tuesday's decline (RSI below 30). This is a mean-reversion setup and the stocks formed bullish candlestick reversal patterns on Wednesday.
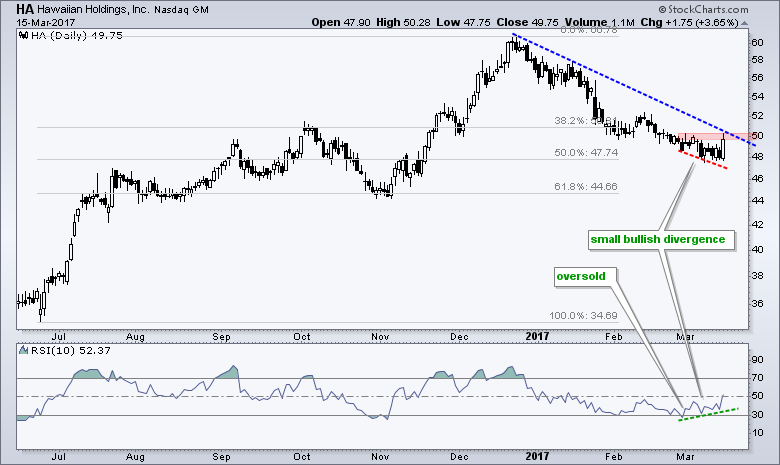
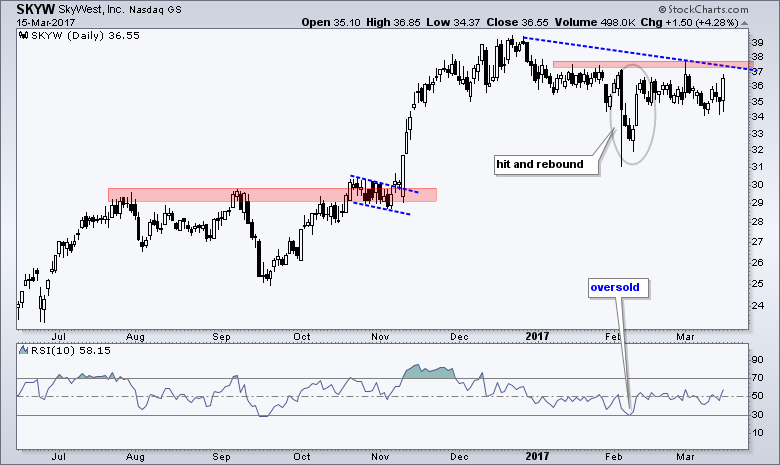
Three Regional Carriers (HA, JBLU, SKYW)
The next three charts highlight some regional carries, which can be more volatile than the behemoth carriers. They offer a little more beta (risk) than the big three. First, note that the 50-day EMA is above the 200-day EMA for all three and all three hit 52-week highs in December. Hawaiian Airlines (HA) and Jetblue (JBLU) corrected fairly hard with retracements that extended 50 to 61.8 percent. HA became oversold in early March and RSI formed a small bullish divergence. A break above 50.30 would provide the first sign that the correction is ending.
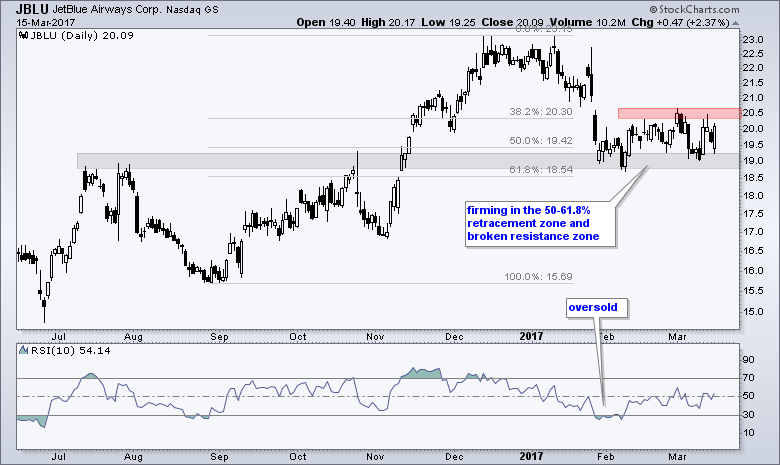
JBLU fell sharply in January and then firmed over the last two months. Notice that broken resistance and the 50-61.8% combine to mark a support zone. RSI became oversold in late January. Look for a break above the early March high to signal an end to this corrective period.
The final chart shows SkyWest (SKYW) with a hit and rebound in early February. The stock consolidated after this volatility spat and surged on Wednesday. Look for a follow through break above the early March high to reverse this correction.
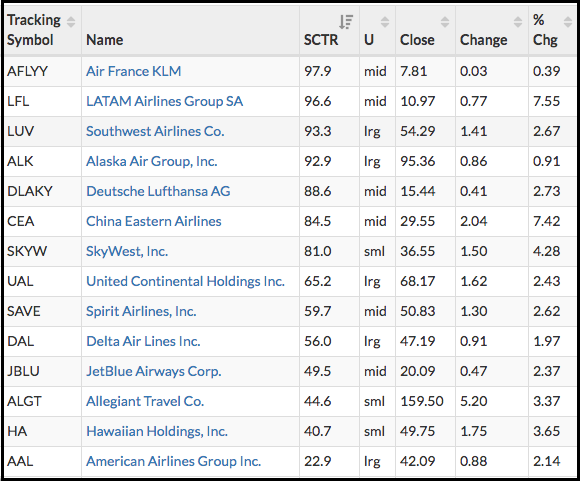
Where to Find a List of Airline Stocks
StockCharts users can find a list of airline stocks using the sector summary tool. Actually, you can find a list of stocks in any industry group using this awesome tool. Airlines are part of the industrials sector so first click on the "Industrials Sector" in the name column. All the industry groups in this sector will then be shown and chartists can click "Airlines" to see all the stocks in that group. The table below shows these stocks sorted by the StockCharts Technical Rank (SCTR).
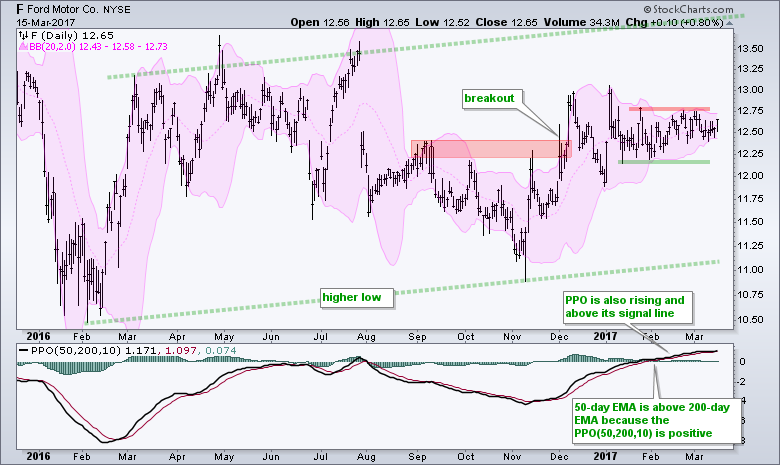
Two More Charts (F and AKAM)
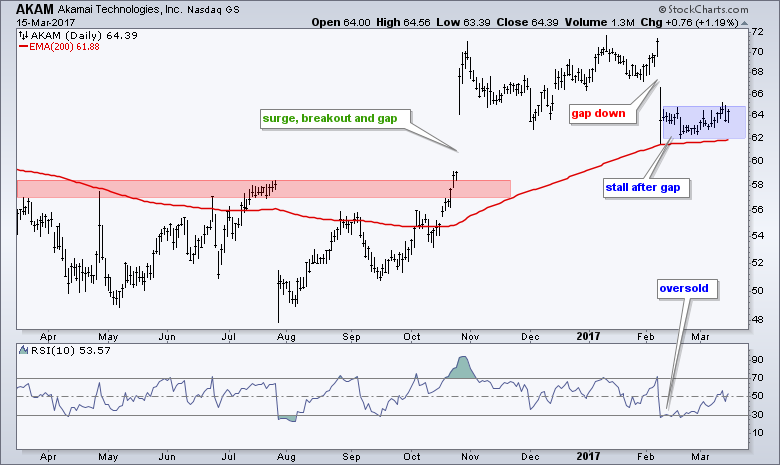
Ford (F) was featured on February 28th and Akamai (AKAM) was featured on March 7th. These two have not done much since then so I thought I would refresh the charts. The setups remain the same. Ford is in an uptrend overall because the PPO(50,200,1) is positive. The stock remains stuck in a consolidation with a Bollinger Band squeeze working. Look for a break above 12.8 to end this correction and open the door to higher prices. A close below 12.1 would be bearish.
AKAM gapped down in early February and immediately firmed. I am not normally interested in stocks after big down gaps, but I have seen a few of these gaps filled. AKAM is in the tech sector and part of the internet group, both of which are leaders right now. Note that AKAM is in a long-term uptrend and firming in the 62-64 area. A break above the consolidation highs would be bullish.
******************************************************
Spotting Pullbacks and Upturns within an Uptrend using RSI and MACD Histogram.
Difference between EMA and SMA - Using %Above 200-day EMA for Breadth Analysis.
Backtesting Different Moving Average Pairs with SPY, QQQ and IWM.
ETF Master ChartPack - 300+ ETFs organized in a Master ChartList and in individual groups.
Follow me on Twitter @arthurhill - Keep up with my 140 character commentaries.
****************************************
Thanks for tuning in and have a good day!
--Arthur Hill CMT
Plan your Trade and Trade your Plan
*****************************************


