.... The Fab Five Remain Strong (GOOGL, AAPL, FB, MSFT, AMZN)
.... Equinix Looks Set to Continue Uptrend
.... Think Market, Sector, Group and Trend First (NVDA)
.... A Payment Processor, A Big Data Player and an IoT Leader (PYPL, TDC, XLNX)
.... Crown Castle, Zoetis and General Cable Turn Up (CCI, ZTS, BGC)
.... Watch GE, Emerson and Caterpillar for clues on XLI ....
The Fab Five Remain Strong (GOOGL, AAPL, FB, MSFT, AMZN)
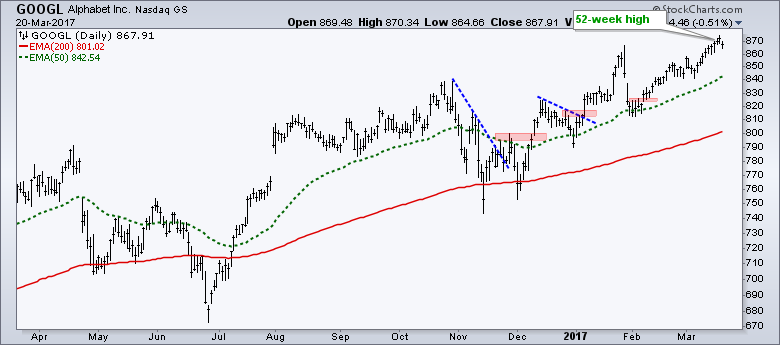
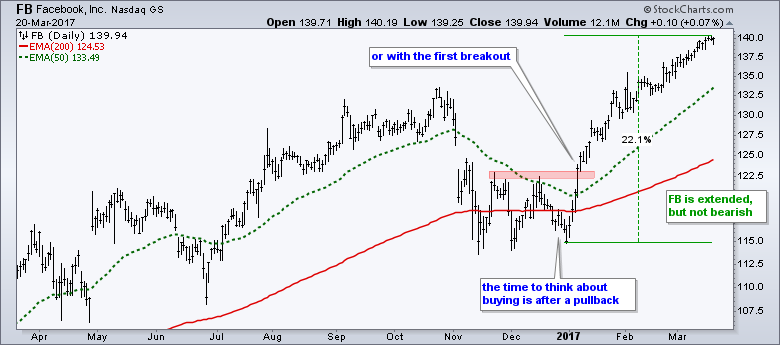
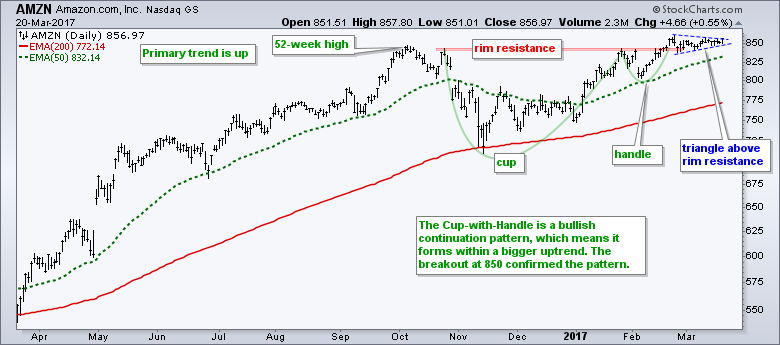
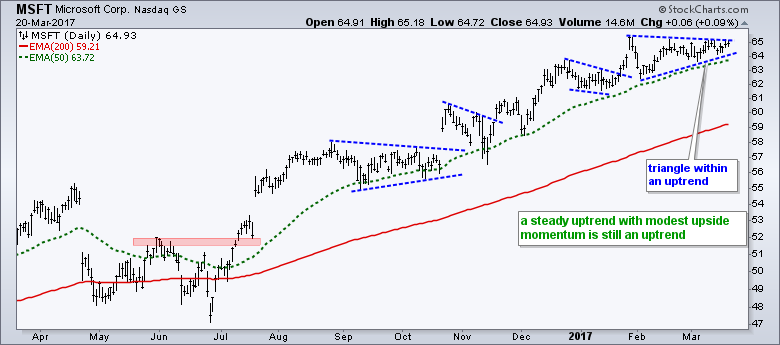
Since we are down to the sweet 16 in March madness, I will start with the Fab Five and look at the top stocks in the Nasdaq 100 ETF (QQQ). Note that APPL (11.91%), GOOGL (8.86%), MSFT (8.05%), AMZN (6.56%) and FB (5.29%) account for 40.67% of QQQ. These five stocks report earnings in a month and their uptrends could become even more extended. Think buy the rumor and sell the news. Note that QQQ, GOOGL, FB and AAPL hit 52-week highs last week and there are no signs of significant selling pressure.
AMZN and MSFT are consolidating with triangle patterns and both are very close to 52-week highs. Considering their business models, these triangles could be considered clouds.
As noted in my ChartWatchers article on MACD this weekend, I cannot stress the importance of the bigger trend enough. In short, we should ignore short-term bearish signals and setups when the bigger trend is up. I understand if AAPL, FB and GOOGL are too extended to consider new long positions, but this is not a reason to be bearish or even negative on these stock.
Equinix Looks Set to Continue Uptrend
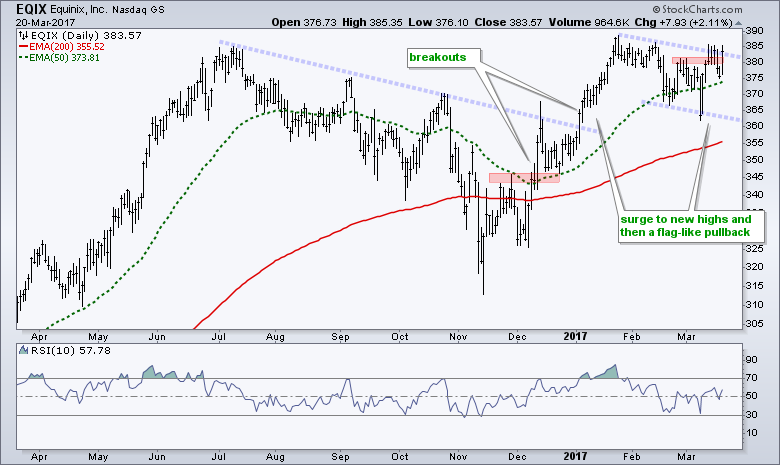
Equinix (EQIX) surged on Monday and it looks like the flag correction is ending. The blue trend lines are thin and light to denote a "soft" area. I do not consider trend lines as "hard" resistance. Instead, the slope of the trend line defines the rate of ascent or descent. As far as EQIX is concerned, I am impressed with the break above the red resistance zone.
Think Market, Sector, Group and Trend First (NVDA)
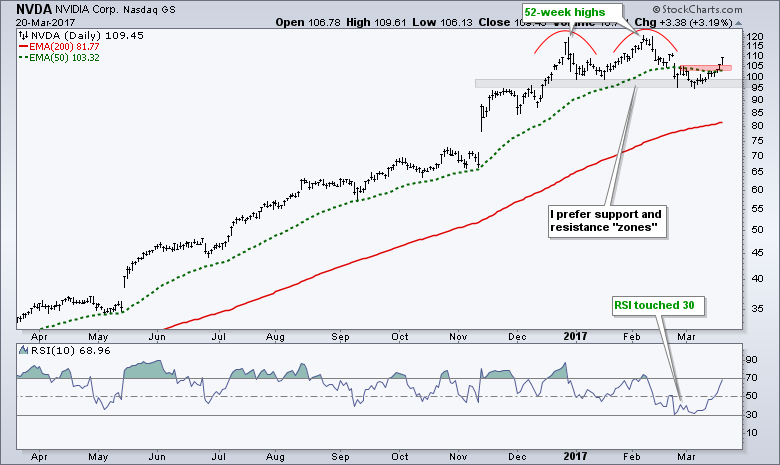
Nvidia (NVDA) looked like it formed a double top and even confirmed with a break below the January lows. The break did not last long as the stock moved back above 100 over the last two weeks. Here are a few items to consider before making your analysis. First, we are in a bull market. Second, technology is one of the strongest sectors. Third, the semiconductor group is one of the leading industry groups. Fourth, NVDA hit a 52-week high in mid February. Fifth, the 50-day EMA is above the 200-day EMA. These five items tell me NOT to look for bearish patterns in stocks like NVDA. Thus, I would be more inclined to draw a support zone around 95-100 and watch RSI for an oversold condition. Yeah yeah, hindsight is 20-20 so I will peer a little into the future as well. With the bounce over the last few days, it looks like NVDA is heading back to new highs.
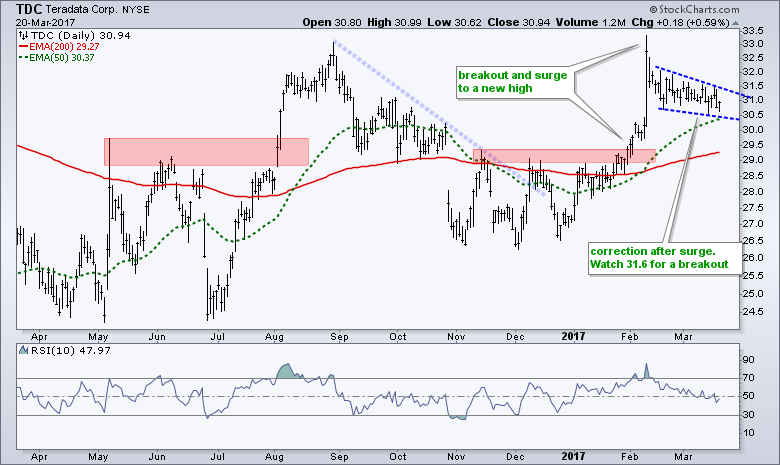
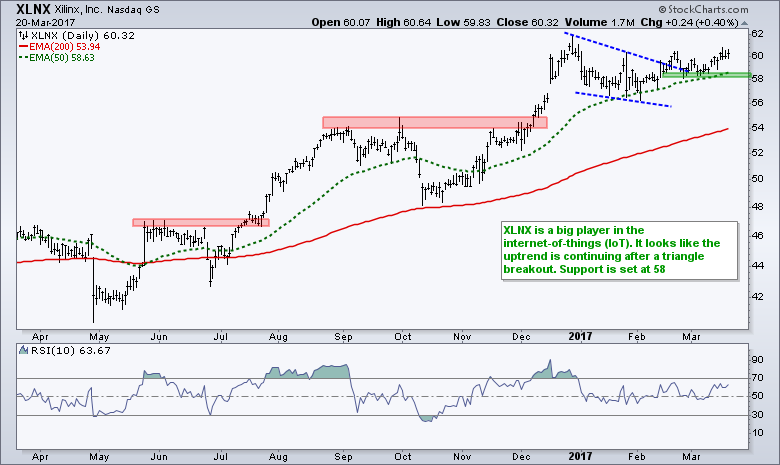
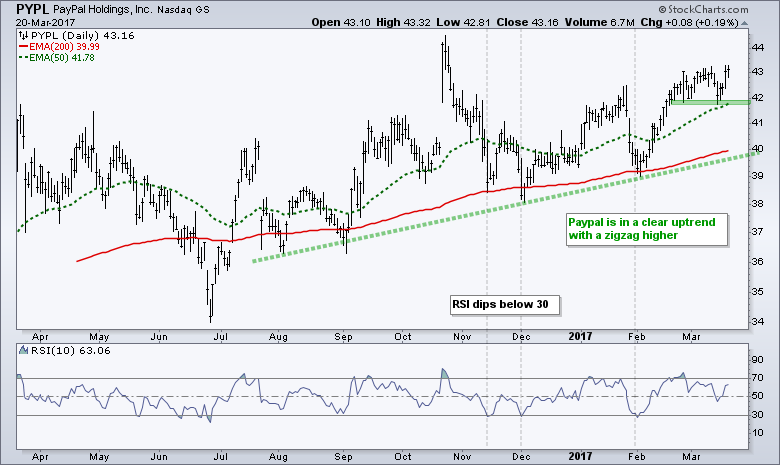
A Payment Processor, A Data Player and an IoT Leader (PYPL, TDC, XLNX)
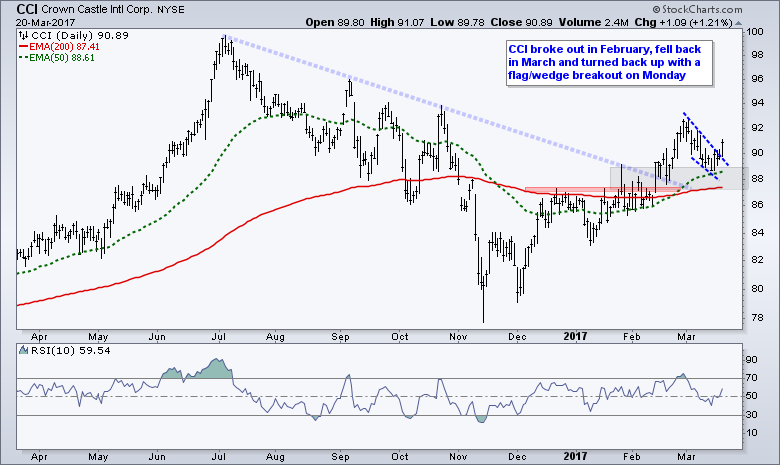
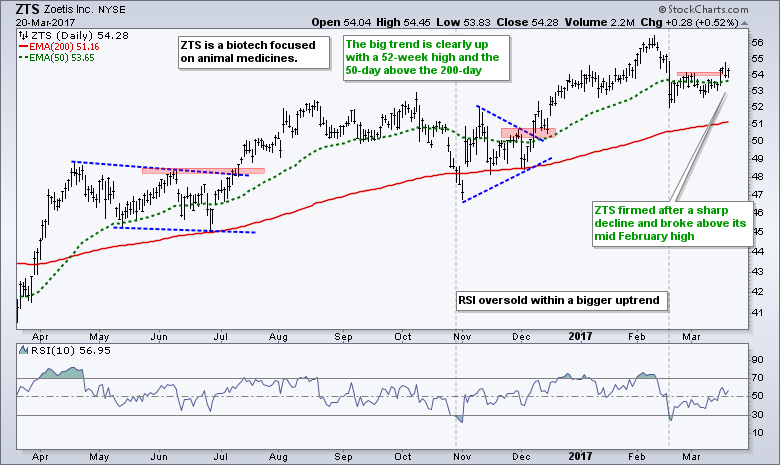
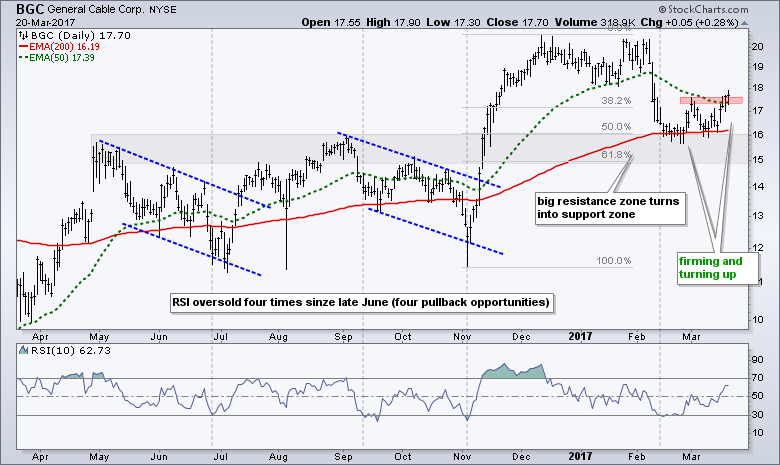
Crown Castle, Zoetis and General Cable Turn Up (CCI, ZTS, BGC)
Watch GE, Emerson and Caterpillar for clues on XLI
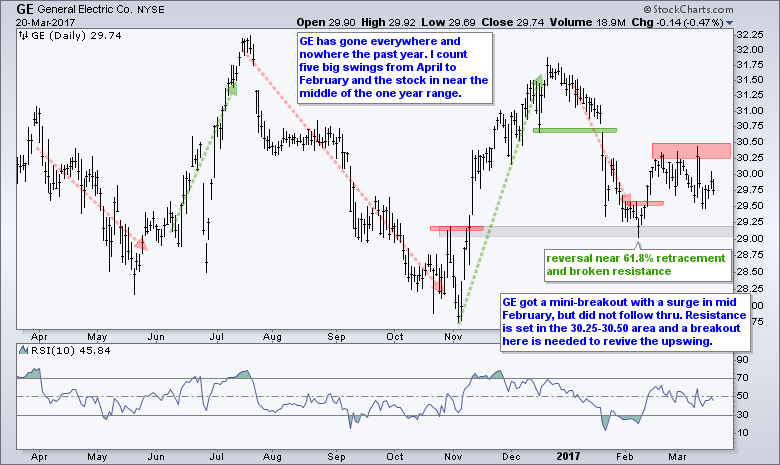
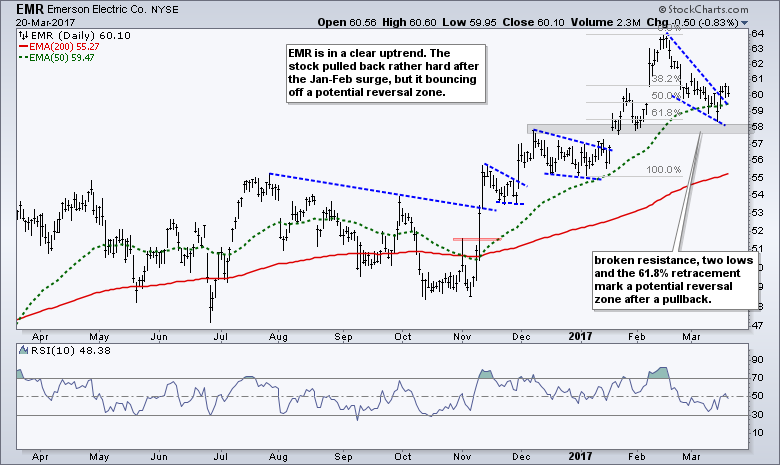
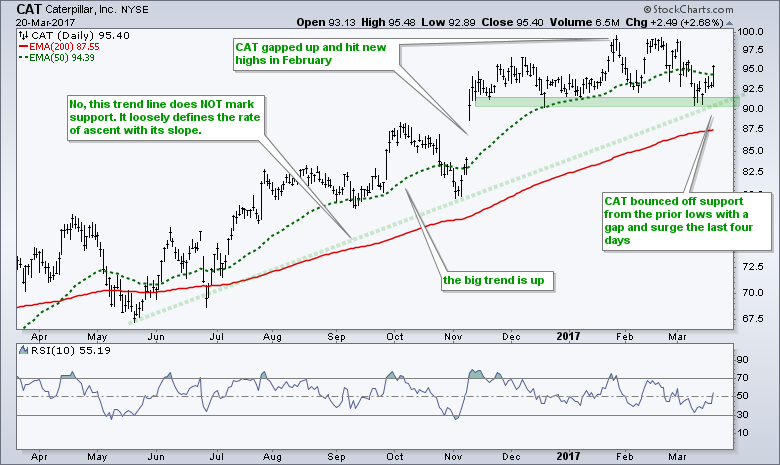
The next three stocks come from the Industrials SPDR (XLI). General Electric is the biggest holding (8.69%) and we should watch this one for clues on XLI. An upside breakout would be bullish for the stock and should lift the sector. Elsewhere, Emerson Electric is making a bid to reverse its wedge correction and Caterpillar is bouncing off a support zone.
******************************************************
Spotting Pullbacks and Upturns within an Uptrend using RSI and MACD Histogram.
Difference between EMA and SMA - Using %Above 200-day EMA for Breadth Analysis.
Backtesting Different Moving Average Pairs with SPY, QQQ and IWM.
ETF Master ChartPack - 300+ ETFs organized in a Master ChartList and in individual groups.
Follow me on Twitter @arthurhill - Keep up with my 140 character commentaries.
****************************************
Thanks for tuning in and have a good day!
--Arthur Hill CMT
Plan your Trade and Trade your Plan
*****************************************

