 |
..... A Bollinger Band Squeeze System |
A Bollinger Band Squeeze System
Today we are going to look at a system using a version of the Bollinger Band squeeze. This system is designed to find stocks that are consolidating within uptrends. John Bollinger theorized that volatility contractions are followed by volatility expansions so I am going to hunt for contracting Bollinger Bands. Note that this system is not exactly as explained in Bollinger's book, Bollinger on Bollinger Bands. I will then use StochRSI for a momentum trigger to signal that the contraction is ending. The idea is to buy when the consolidation ends and hold until there are signs that the trend is turning down. This is more like a breakout system or a trend following system.
Trend Filters and Trading Signals
The bullet points below explain the trend filters, trading setup and trading signals. I provided some links to ChartSchool articles for more information on how the indicators work.
- S&P 500 is in Long-term Uptrend: the 50-day EMA for the S&P 500 is above the 200-day EMA. This insures that the long-term trend for the broad market is up. I only consider long positions when the long-term trend is up. Using broad market timing, this strategy was exposed to the market around 70% of the time from January 2000 to March 2017. The 50-day EMA was below the 200-day EMA the other 30% of the time.
- Stock is in Long-term Uptrend: the 50-day EMA for the stock is also above the 200-day EMA. I want to trade in the direction of the bigger trend and this is the best way to do that.
- BandWidth (20,2) Dips below 6%: A bullish setup occurs when BandWidth moves below 6%. This indicates that a consolidation is underway because volatility is contracting.
- StochRSI(10) Surges above .80: This is the bullish trigger. A StochRSI surge above .80 acts as a bullish momentum thrust. This indicates that the volatility contraction is ending and the bigger uptrend is resuming.
- Rate-of-Change(125) is the Tie Break: In the event there are more signals than available positions in the portfolio, the 125-day Rate-of-Change is used to break the tie. The stock with the highest Rate-of-Change will be chosen and this favors the stocks with the strongest momentum. This filter is not so important with the S&P 500, but it is important when the universe includes mid-caps and small-caps (S&P 1500).
- RSI(10) Moves below 30: A move below 30 in RSI(10) signals strong downside momentum and acts as the sell signal. In contrast to a mean-reversion system, this is a trend following system designed to ride the trend until the first signs of a reversal appear.
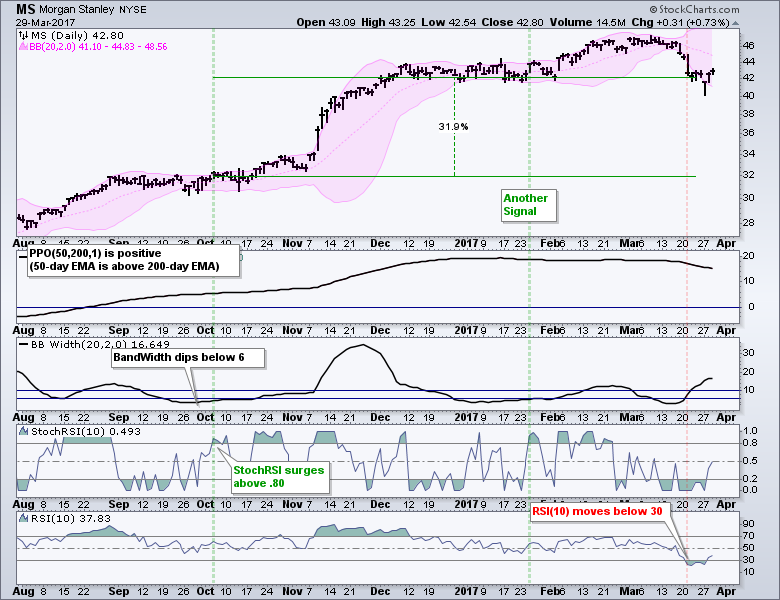
Morgan Stanley with a Winner and a Loser
I will first show a winning trade with JP Morgan. Actually, there is a winning trade and a losing trade on this chart. The PPO(50,200,1) turned positive in late August and BandWidth dipped below 6% for the setup in late September. A signal triggered when StochRSI surged above .80 in early October (green dashed line). This signal remained in play until the sell signal on March 21st (red dashed line), which is when RSI(10) dipped below 30. Note that there was also another bullish signal in late January (green dashed line). The first trade resulted in a 30+ percent gain, while the second trade resulted in a 3% loss.
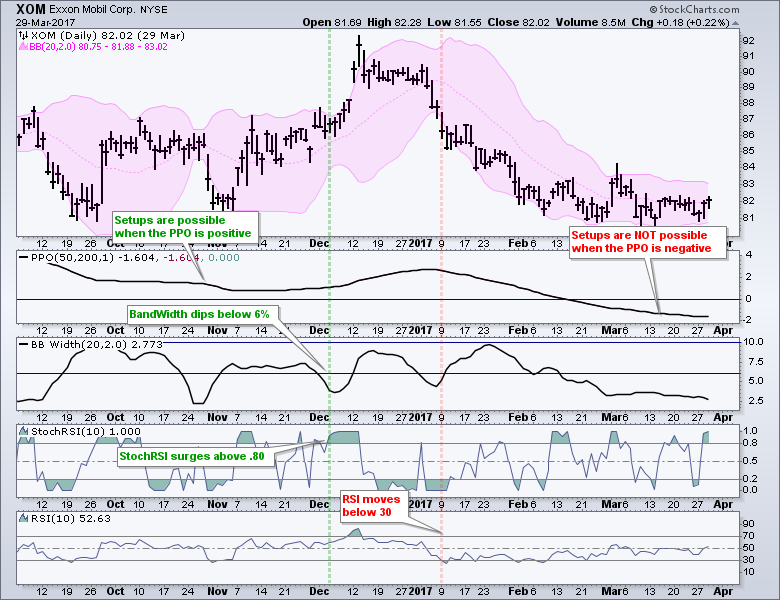
ExxonMobil with A Losing Trade
The second chart shows ExxonMobil with a losing trade. The stock triggered a bullish signal in early December and appeared to break out later that month. This breakout failed to hold as XOM fell sharply in January. RSI moved below 30 to trigger a sell signal on January 9th.
 I realize that RSI(10) can be part of a mean-reversion strategy, which means the setup occurs with a dip below 30 and the trigger is with a move back above 30. This system is not a mean-reversion system so I am using RSI in a different way.
System Ground Rules
- Historical Constituents: The stock universe will be based on the historical constituents for the S&P 500, S&P MidCap 400, S&P Small-Cap 600 and S&P 1500. This means a test in the year 2010 will be based on the stocks that were in the index at that particular time.
- The testing period runs from 1-January-2000 to 1-March-2017. This is an interesting period because the buy-and-hold return for the S&P 500 SPDR (SPY) was just 2.97% per year. There were two bear markets and two bull markets.
- The portfolio begins at $100,000 and commissions were set at $10 per trade. There are 20 equal weight positions in the portfolio. I did not account for slippage, which can occur with thinly traded stocks in the S&P Small-Cap 600.
- Signals were generated based on closing prices. The entry and exit prices were based on the next open. Thus, this is an end-of-day (EOD) system. There are no signals or trades intraday.
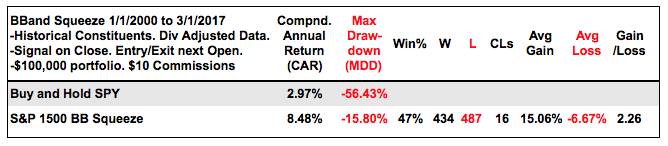
Backtest Results for S&P 1500
The table below shows the backtest results for SPY buy-and-hold and the 20-stock portfolio using the Bollinger Band Squeeze for S&P 1500 stocks. The results outperformed buy-and-hold by a wide margin and the Maximum Drawdown was well below -20%. There are slightly more losing trades than winning trades so the Win% is below 50% (47%). Note, however, that the average gain is more than twice the average loss. This is where the system makes money. There were some difficult runs from the there were 16 consecutive losses at one point over the last 18 years (CLs).
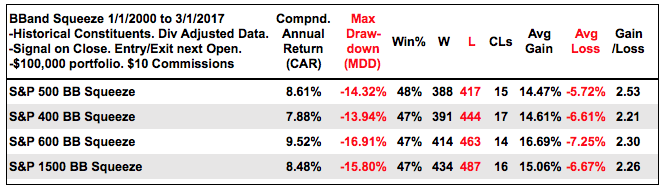
The next table breaks down the results by market cap. The S&P 500 is at the top, the S&P MidCap 400 is second and the S&P Small-Cap 600 is third. The portfolios still hold 20 stocks, but the tradable universe is much smaller (about 2/3 smaller). Overall, the results are pretty good with small-caps generating the highest returns and the highest drawdown. I was a bit surprised to see mid-caps in third place for Compound Annual Return though.
Conclusions and Caveat Emptor
The results are pretty good, but not earth-shattering. Keep in mind that SPY returned just 2.97% per year over this period and the testing period was difficult for stocks. I think this system provides a good methodology for finding entries. I was not entirely happy with the exit strategy and there is clearly more work to be done here. My educated guess is that a profit target would help lock in some profits and reduce the drawdown. This means taking profit after a certain percentage gain or when a price target is reached.
Before asking questions, note that I ran a few optimizations and even tried some other exit strategies (Chandelier, PPO signal line Cross, EMA crossover).
Portfolio level backtesting means I am testing a portfolio of stocks. I never know which picks will be winners and which will be losers. These systems are profitable because the profit from the winners exceeds the profit from the losers. Also note that the results are based on taking every trade and sticking to the system, which is harder in real life. And finally, keep in mind that past results to not guarantee future results.
******************************************************
Thanks for tuning in and have a good day!
--Arthur Hill CMT
Plan your Trade and Trade your Plan
******************************************************
Other Articles in the SystemTrader Series:
- Introduction to Key Performance Metrics - Quantifying the Golden Cross for the S&P 500
- Golden Cross and 5 Major Indexes - EMAs versus SMAs - Do Short Positions Add Value?
- Setting up Momentum Scans, Creating ChartLists and Exporting Lists. - Differences in Major Indexes - Do Trend Filters Work?
- MACD Crosses - Rules to Reduce Drawdowns and Increase Gains - Testing PPO Strategy
- Follow me on Twitter @arthurhill - Keep up with my 140 character commentaries.


