 |
.... Is One Week of Risk-On Enough? .... Breadth Underwhelms on latest Surge .... SPY Remains in Corrective Mode .... IJR Gets a Mini-Breakout within a Consolidation .... Another New High for QQQ, but.., .... Five Sectors Still Holding Up .... Finance and Regional Bank ETFs Reverse .... Watch TLT and the 10-yr Yield for Clues .... Watch GE for Clues on XLI .... Healthcare Still in Corrective Mode .... Energy Surges to First Resistance Zone .... Oil Holds Uptrend with Short-term Reversal .... 20+ YR T-Bond ETF Backs off Resistance .... Gold Cues off Bonds and the Dollar .... Correction within Uptrend for the Dollar .... |
----- Video Link ----- Art's Charts ChartList (updated 31-Mar) -----
Is One Week of Risk-On Enough?
Stocks caught a big bid this week as Treasury bonds fell. We also saw money moving into oil and industrial metals as gold fell back. Overall it was a clear risk-on week for the markets. Even though I see a reversal in oil and resistance in bonds, I have my doubts on this return to risk in the stock market. I moved to the correction camp a week ago Wednesday and I remain in that camp. Note that I am NOT calling a top and I am certainly not turning long-term bearish on stocks. I am simply staying in the correction camp for the S&P 500.
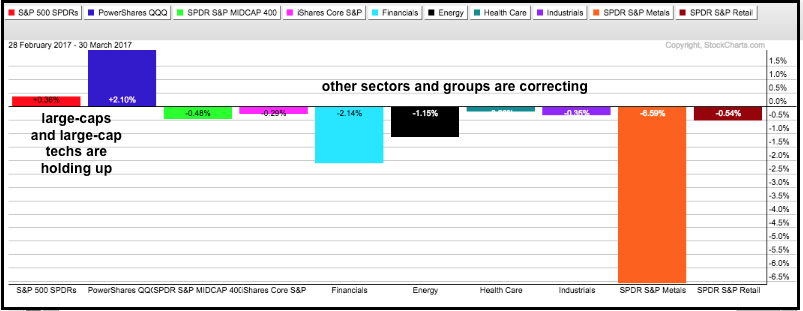
Parts of the stock market are in current in correction mode right now, and parts are holding up. This divided market is keeping the broad index ETFs relatively flat. The PerfChart above shows SPY and QQQ with gains this month, and IJR and MDY with losses. Thus, large-caps and large-cap techs are holding firm, but small-caps and mid-caps are correcting. Similarly, the Finance SPDR, HealthCare SPDR, Industrials SPDR and Energy SPDR are down this month and these four sectors are correcting in some way, shape or form. Elsewhere, the Metals & Mining SPDR is down over 6% and the Retail SPDR is also down.
Breadth Underwhelms on latest Surge
Stocks surged over the last seven days, but this thrust still pales relative to the thrusts in early July and early November. I will start with the breadth indicators for the S&P 1500, which you can learn about with links under the chart. The 10-day EMA of AD Percent surged to 13.61% with a seven day move. Even though this seems impressive, it is not as impressive as the 10-day thrust in late June-early July or the 6-day thrust in early November. This leads me to believe that this week's move does not have enough critical mass to end the correction.
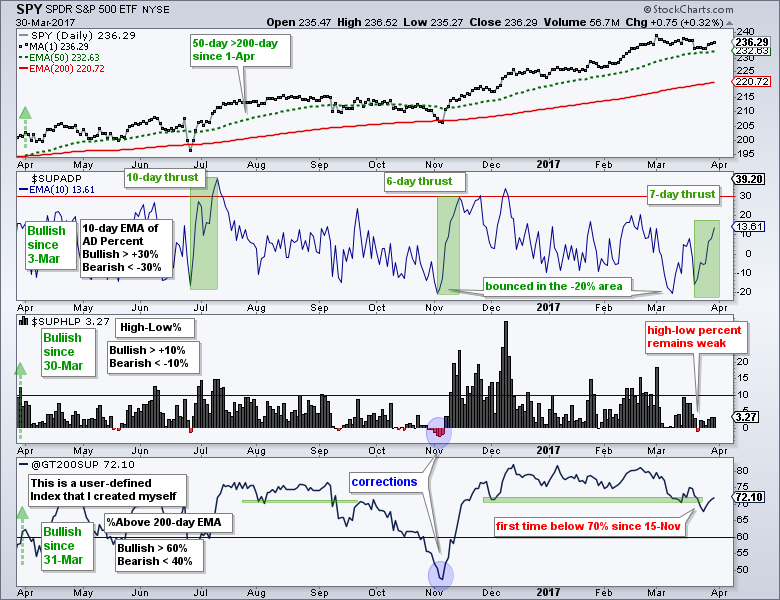 The histogram shows S&P 1500 High-Low Percent ($SUPHLP) struggling this week and failing to exceed +5%, which is not a high hurdle. The indicator has not been above +10% since March 1st, which suggests that we have already see some sort of correction this month. The %Above 200-day EMA dipped below 70%, which was my line-in-the-sand for a correction. It is back above 70% this week, but not far enough above to change my outlook.
Related Links: How to create a user-defined index (@GT200SUP).
Understanding the AD Percent Indicators, High Low Indicators and %Above 200-day EMA Indicators.
SPY Remains in Corrective Mode
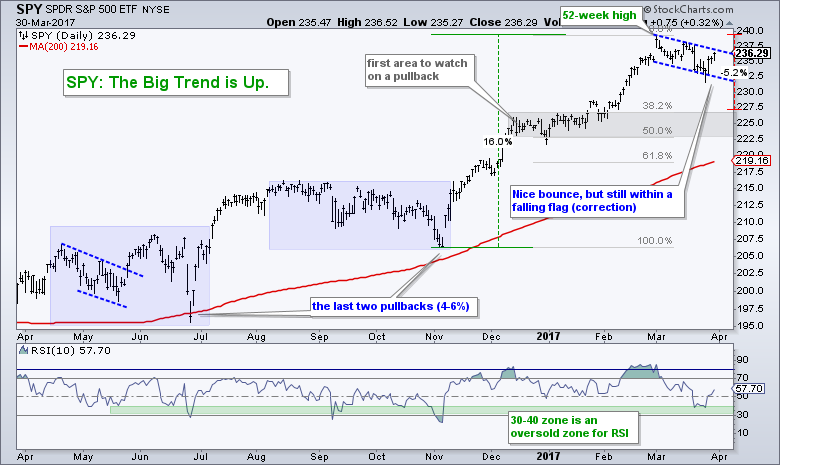
The S&P 500 SPDR (SPY) is used as my benchmark for the stock market. I am also working under the assumption that most indexes, sectors, industry groups and stocks will eventually follow the S&P 500. In any case, SPY surged to the 236 area this week, but remains within a clearly defined decline since early March. This four-week correction could be a bull flag and a breakout would signal a continuation of the January-February advance. As noted above, I do not think breadth was strong enough this week to suggest a sustainable breakout. Thus, I think playing upside breakouts could be dangerous with SPY still up around 15% from its early November low. Disclaimer: Always be careful when I begin a sentence with "I think" because thinking sometimes gets me in trouble (wrong).
IJR Gets a Mini-Breakout within a Consolidation
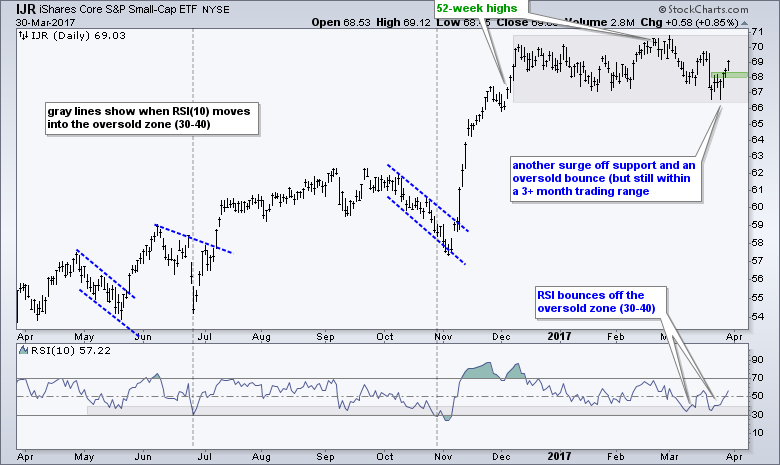
IJR pulled off a five-day reversal in the 67 area. Notice how the ETF plunged below 68 on 21-Mar, firmed for four days and then surged above 68 with a big move a week later (this past Tuesday). Short-term, the breakout at 68 is the first level to watch because a strong reversal should hold. A close back below 68 would negate the breakout. Overall, IJR is still locked in a consolidation and corrected for 3+ months. The break above 68 is the first sign this correction is ending - so it better hold.
Another New High for QQQ, but..,
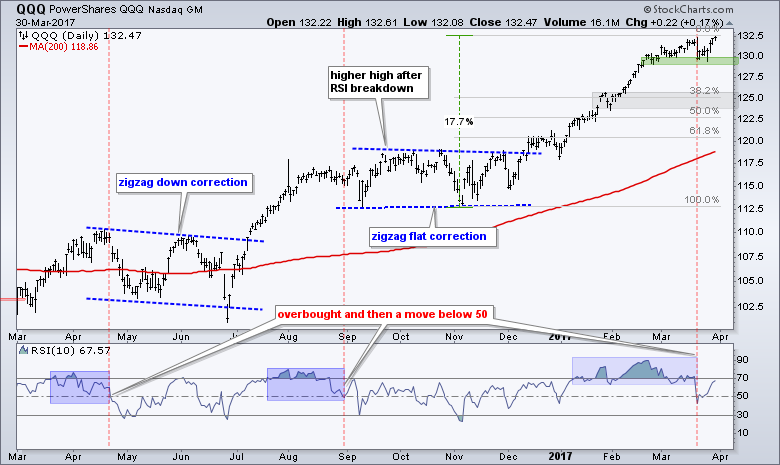
QQQ continues to lead the market with a new high on Thursday. Also note that 10 stocks (10%) in the Nasdaq 100 hit new highs on Thursday. These include Amazon, Apple, Facebook, Microsoft and Netflix. QQQ, however, was the only major index ETF to hit a new high. Big tech remains the strongest group in the market by far, but I am still in the correction camp because of the RSI signal last week. The red dashed lines show when RSI moves below 50 after being overbought (near 70) for an extended period. QQQ moved to a new high after the late August signal, but did end up correcting with flat trading for two months. The green zone marks first support and a break below 129 would provide another signal that the correction has arrived.
Five Sectors Still Holding Up
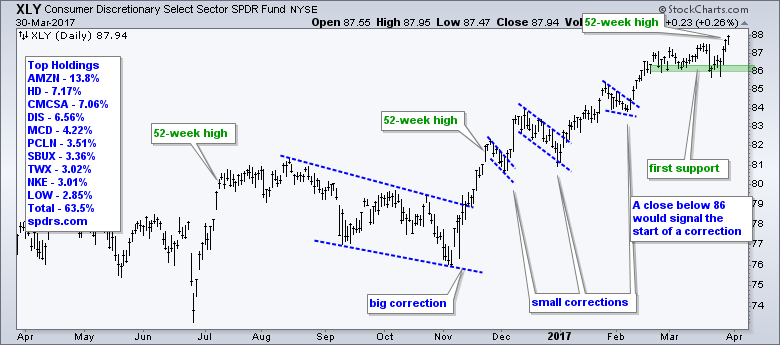
As noted last week, the S&P 500 remains split when we look at the sectors. The numbers in parenthesis show the weighting for each sector in the S&P 500 SPDR. Basically, the Consumer Discretionary SPDR (12.31%), the Technology SPDR (22.09%), the Consumer Staples SPDR (9.36%), the Materials SPDR (2.84%) and the Utilities SPDR (3.19%) are not in corrective mode. Together these five sectors account for 49.79% of the S&P 500 SPDR. The Finance SPDR (14.31%), the Industrials SPDR (10.06%), the HealthCare SPDR (13.96%) and the Energy SPDR (6.57%) are in corrective mode and they represent 44.9%. The other 5% of SPY belongs to REITs and Telecom. At this stage, the market can tread water, and even move higher, as long as the first five sectors hold support. Support breaks by one of the big three sectors (tech, discretionary or staples) would tilt the balance to the bears.
The first chart shows the Consumer Discretionary SPDR (XLY) with support at 86. A close below this level would argue for a correction.
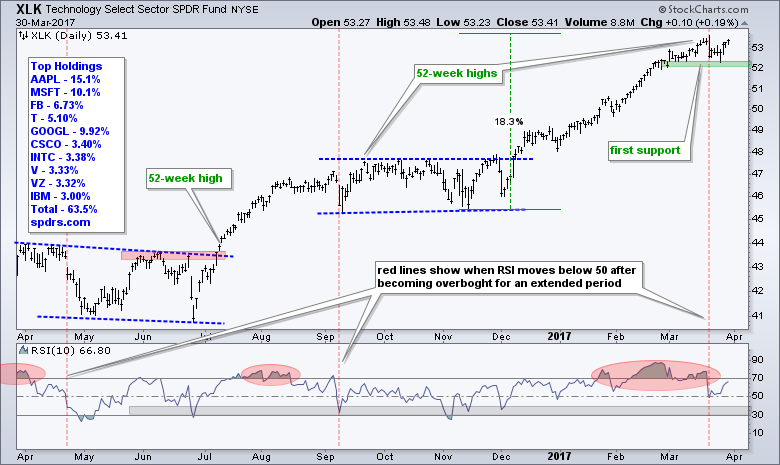
The Technology SPDR (XLK) bounced back above 53 to affirm support in the 52 area. A close below 52 would break support and argue for a broader correction in the market.
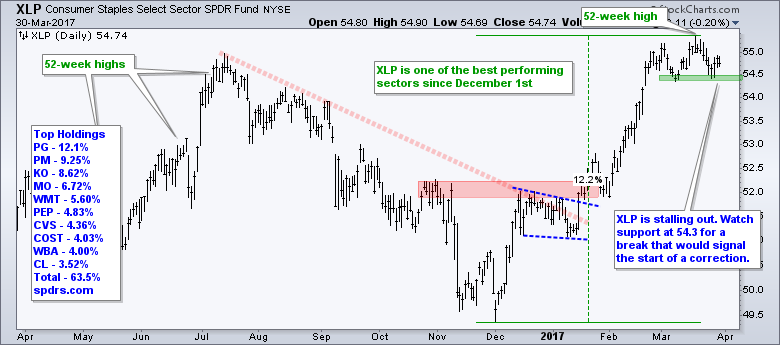
The Consumer Staples SPDR (XLP) stalled in March and established support in the 54.5 area. A close below the mid March low would break support and argue for a correction.
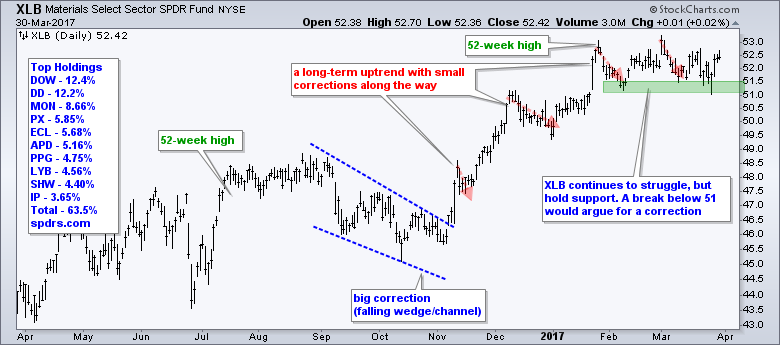
The Materials SPDR (XLB) has been flat since early February, but has yet to actually break down. Watch support in the 51-51.5 area.
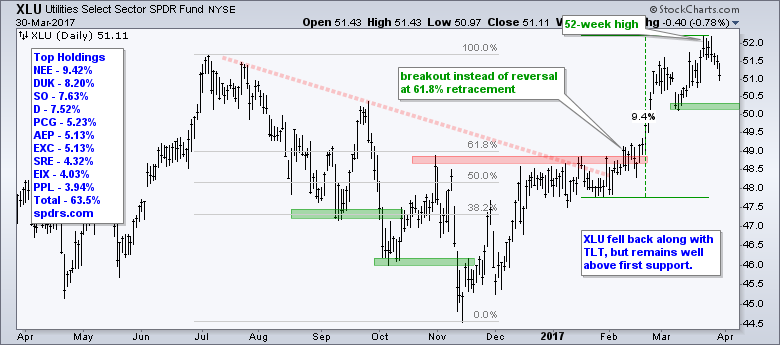
The Utilities SPDR (XLU) fell back this week as the 10-yr T-Yield ($TNX) bounced. The overall trend is up and XLU is not even close to at support test.
Finance and Regional Bank ETFs Reverse
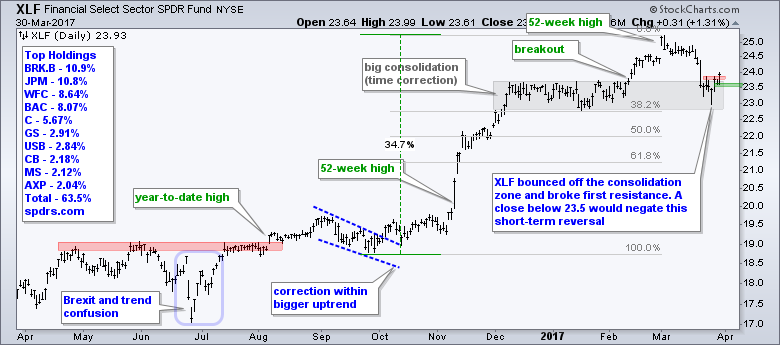
The Finance SPDR (XLF) found support in the prior consolidation zone and surged above short-term resistance on Thursday. This is the first sign that the market-leading pullback is ending, but I would like to see the short-term breakout hold. First support is set at 23.5 and a close below this level would call for a re-evaluation.
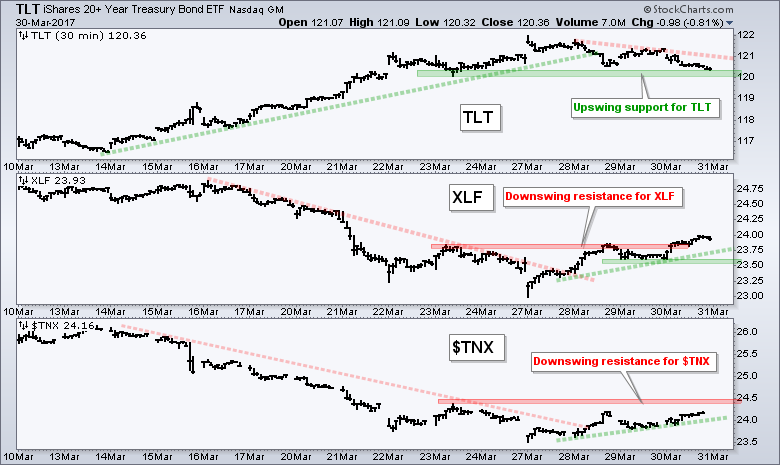
Watch TLT and the 10-yr Yield for Clues
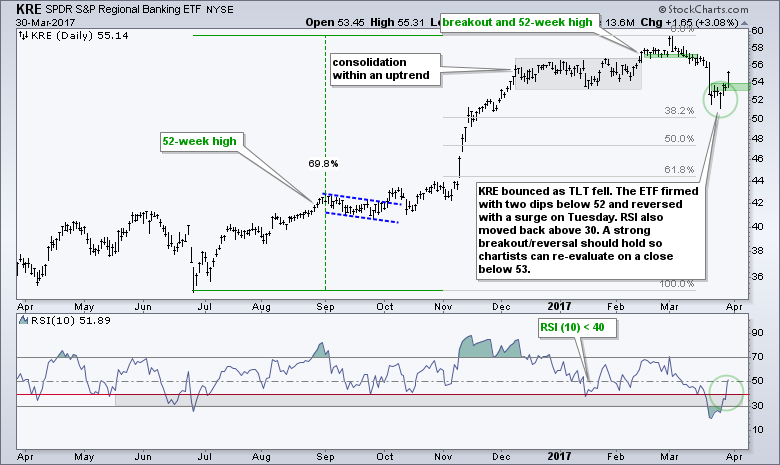
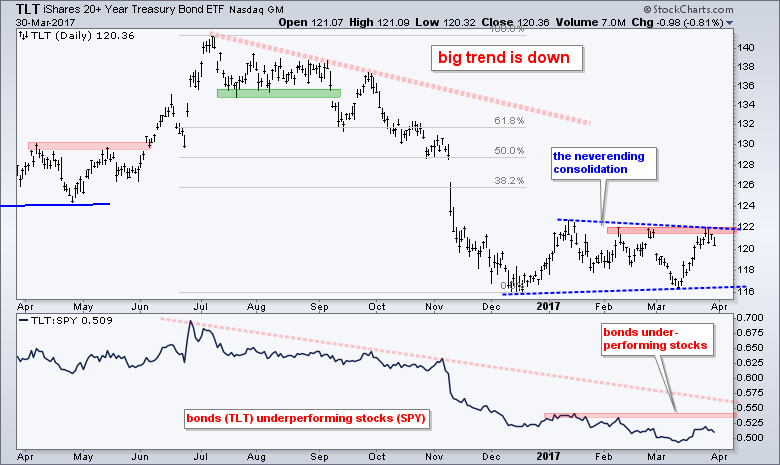
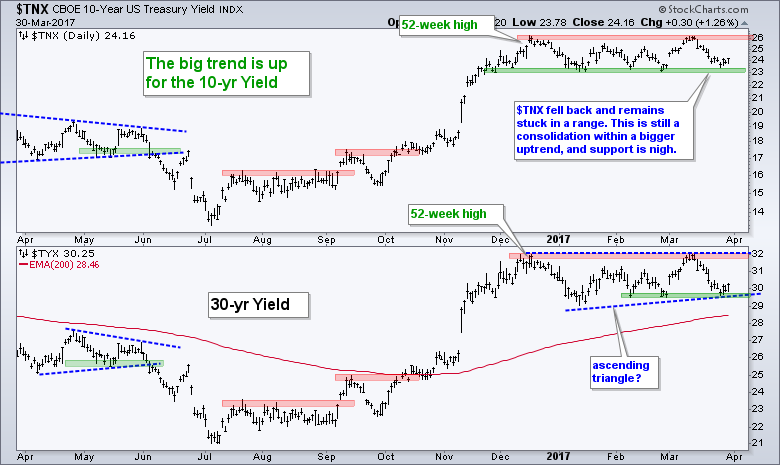
The surge in XLF, the Vanguard Finance ETF (VFH) and the Regional Bank SPDR (KRE) can be attributed to weakness in the 20+ YR T-Bond ETF (and a rise in the 10-yr T-Yield). The chart below shows TLT falling to its first support zone as XLF broke out of its first resistance zone. Note that the 10-yr T-Yield ($TNX) is not challenging resistance just yet. A follow through move above 24.5 (2.45%) in $TNX would be most bullish for banks and could lift small-caps further (Financials account for 17.33% of IJR and 19% of IWM).
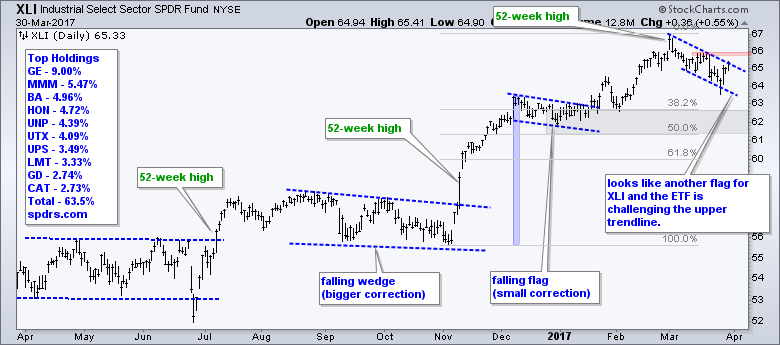
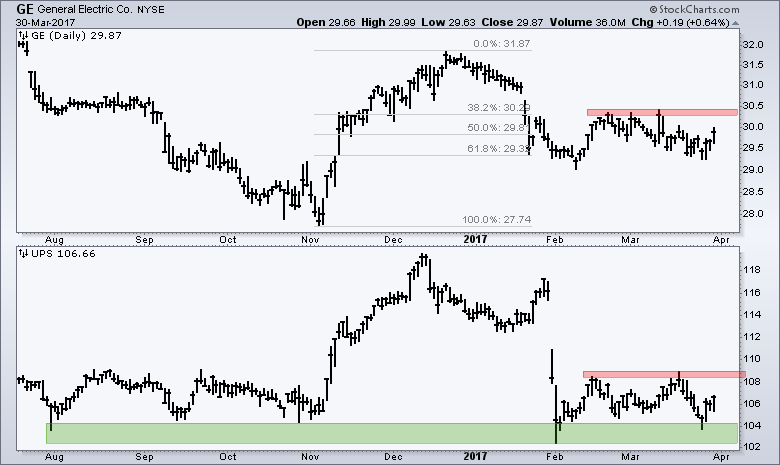
Watch GE for Clues on XLI
The Industrials SPDR (XLI) surged to the upper trend line of a potential bull flag. This flag looks similar to the December-January flag and a breakout would be bullish.
I am watching GE and UPS for clues on the industrials sector. At 9%, GE is the biggest component. UPS is the global delivery service that should be a barometer for the global economy. Both fell in January and then languished in February-March. Upside breakouts would be bullish and could provide a lift to the industrials sector - and perhaps the broader market.
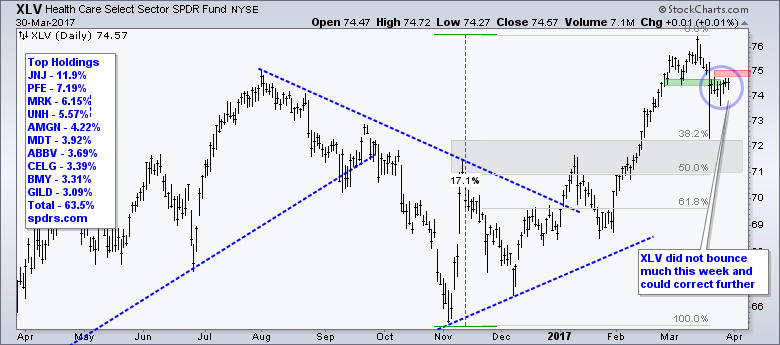
Healthcare Still in Corrective Mode
The HealthCare SPDR (XLV) bounced on Monday, but then stalled the next three days and did not partake in the broad market bounce. Overall, the trend is up, but XLV is one of the sectors that broke short-term support and is considered in corrective mode. Watch for a break above 75 to signal an end to this correction.
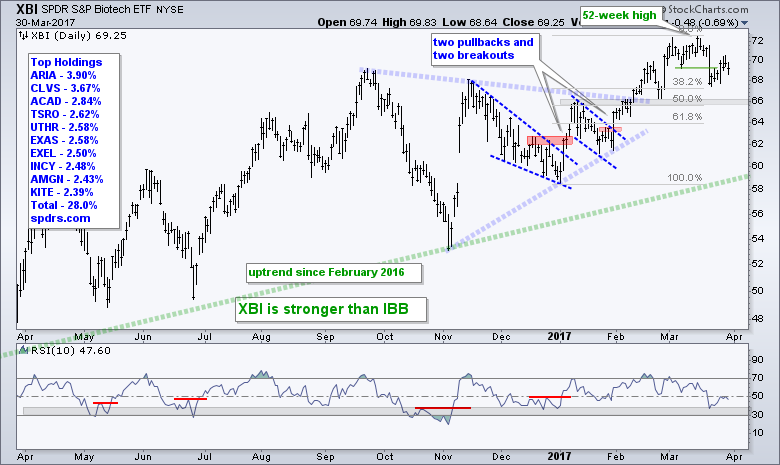
The Biotech SPDR (XBI) remains in an uptrend overall with a fresh 52-week high in mid March. The ETF pulled back sharply last week and rebounded somewhat over the last seven days. The last bullish setup was in January and the last breakout signal was on January 31st. I do not see much to work with on this chart so I will just observe until a setup emerges.
Energy Surges to First Resistance Zone
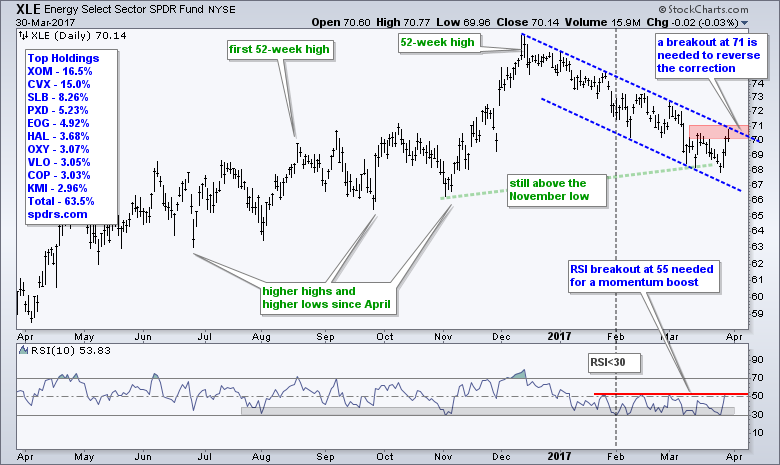
The Energy SPDR (XLE) got a big lift this week and is challenging downswing resistance. The decline from mid December to late March started from a 52-week high and extended some 14 weeks. XLE did not break the November low so we can still make the case for a long-term uptrend. The channel trend line and March highs mark the first resistance zone in the 70-71 area. Look for a follow through breakout here to reverse the decline.
Oil Holds Uptrend with Short-term Reversal
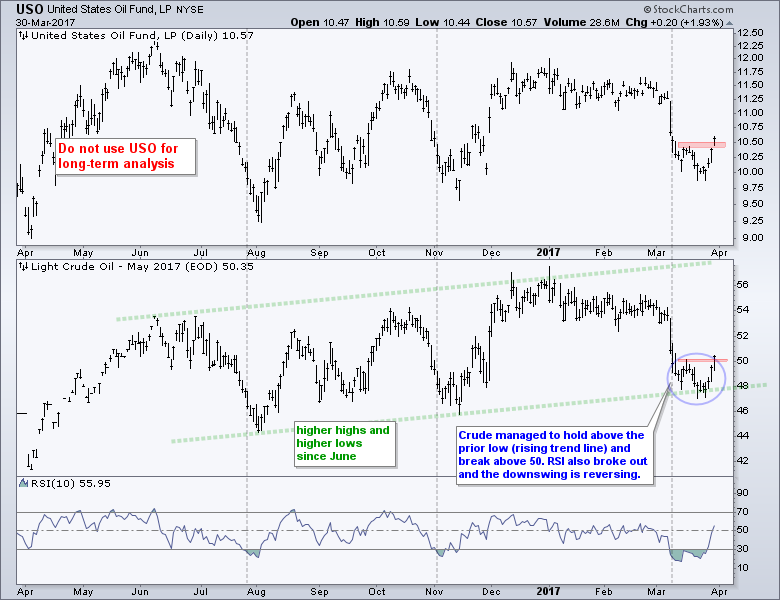
We cannot think about energy stocks without analyzing oil because of the high positive correlation. Note that May Crude (^CLK17) is still in a long-term uptrend with the rising channel since June. Crude hit the lower trend line, firmed for two weeks and bounced with a surge the last three days. This produced a short-term breakout at 50 and USO broke out at 10.50. I will treat these breakouts as bullish until proven otherwise. I don't think a move back below 50 would be enough to negate the breakout, but a close below 48 would warrant a re-evaluation.
20+ YR T-Bond ETF Backs off Resistance
There is no change in my long-term stance on the 20+ YR T-Bond ETF (TLT). The long-term trend is down and the ETF is simply consolidating with a choppy trading range. TLT surged to the upper end of the consolidation and turned down the last three days. This provided a boost for stocks because money moved out of safe-haven bonds. Further weakness in bonds could lift stocks even more. A breakout at 122 in TLT, however, would be bullish for bonds and likely lead to weakness in stocks (risk off).
Gold Cues off Bonds and the Dollar
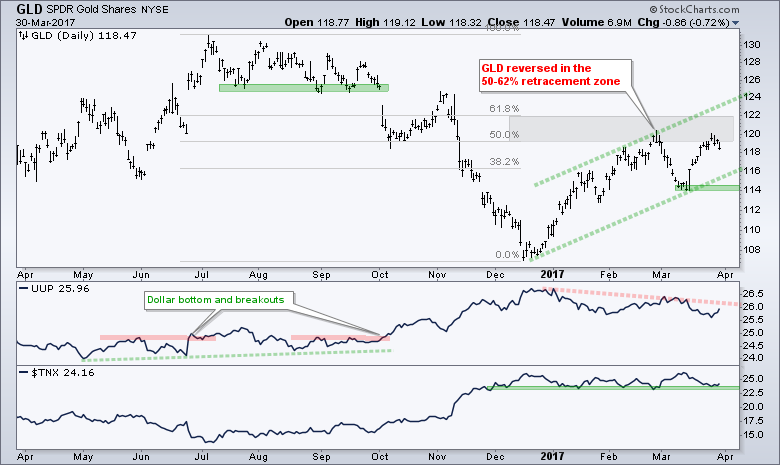
The Gold SPDR (GLD) took a hit this week as the Dollar and 10-yr T-Yield turned up, which is the double negative whammy for bullion. GLD has been moving higher since mid December as the Dollar fell and the 10-yr T-Yield flattened. These two are still driving bullion so we need to watch them closely, especially with GLD stalling near its prior high.
A Correction within a Bigger Uptrend for the Dollar
Chartists should keep in mind that the US Dollar ETF (UUP) hit a 52-week high in December and the Euro ETF (FXE) hit a 52-week low. The Dollar fell back over the last few months and the Euro bounced, but the long-term trends are still in place. It looks like the Dollar is correcting with a falling wedge and a breakout in the 26-26.5 area would be bullish. Euro support is set at 102 and Yen support is set at 83.50.
 ******************************************************
Spotting Pullbacks and Upturns within an Uptrend using RSI and MACD Histogram.
Difference between EMA and SMA - Using %Above 200-day EMA for Breadth Analysis.
Backtesting Different Moving Average Pairs with SPY, QQQ and IWM.
ETF Master ChartPack - 300+ ETFs organized in a Master ChartList and in individual groups.
Follow me on Twitter @arthurhill - Keep up with my 140 character commentaries.
****************************************
Thanks for tuning in and have a good day!
--Arthur Hill CMT
Plan your Trade and Trade your Plan
*****************************************


