 |
.... Market is Clearly Mixed as Some Groups Correct .... Small-caps and Mid-caps Lead the Correction .... New Highs Dry Up, but New Lows remain Low .... Over 70% of Stocks Still above 200-day EMA .... SPY Fills the Gap as QQQ Stalls at High Level .... IJR Falls Back into Corrective Mode .... Consumer Discretionary Sector Reflects Split Market (XRT, ITB) .... Cloud, Internet and Software ETFs Hold Strong (SKYY, FDN, IGV) .... Cyber Security, Networking and Semi ETFs Correct (HACK, IGN, XSD) .... Banking ETFs Hold Breakouts (XLF, VFH, KRE) .... Healthcare Remains the Healthiest Sector (XLV, XBI, IHI) .... It is Still A Pullback within an Uptrend (XLB, XME, SLX, COPX) .... Oil: Just How Bad is It? XLE, XES and XOP Become Oversold. .... Treasury Bond ETFs Break Down as Yields Break Up (TLT, $TNX) .... REITs, Utilities and Gold Hit by Rising Rates (IYR, XLU, GLD) .... Dollar Grinds Higher (UUP, FXE, FXY) |
Market is Clearly Mixed as Some Groups Correct
Large-caps are holding up quite well over the last few weeks, but mid-caps and small-caps are not and continue to bear the brunt of the correction. "Correction" is the key word here. The long-term trends are clearly up and any weakness would be deemed a correction within these bigger uptrends. Even though SPY and QQQ have yet to correct, we can see corrections unfolding in the S&P SmallCap iShares (IJR) and some other ETFs. The PerfChart below shows one-month performance for ten ETFs. Notice that five are up and five are down.
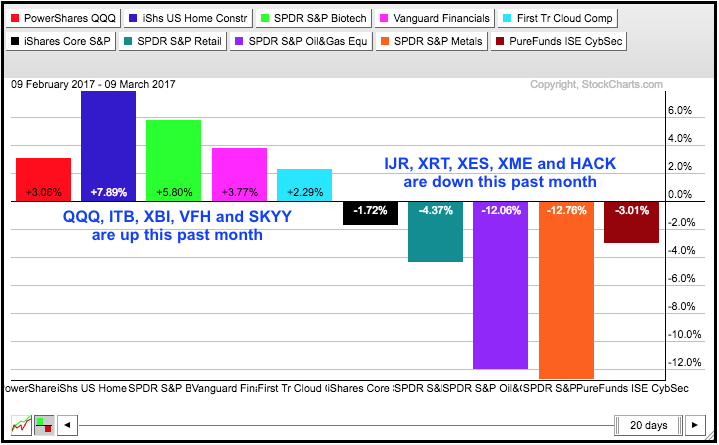
I picked these ETFs to highlight the corrections in certain areas of the stock market. Technology, home construction, biotech, finance and cloud computing are holding up well. Meanwhile small-caps, retail, oil & gas, metals & mining, and cyber security are not. The bulls can argue about strength in healthcare, finance and technology. The bears can argue about weakness in retail, energy and steel. A full-blown correction will not take hold until some of these leaders turn lower.
Programming Note: I am publishing this on Friday because of scheduling issues on Saturday. It is still the Weekly Market Review & Outlook and the analysis should stay fresh until Monday (at least I hope so!).
Instead of a video, I did a webinar with Greg and Tom to discuss the charts in this commentary. We then expand on other items including the VIX, the CRB Index, the long-term Dollar, commodity and commodity-related ETFs. Here is a link to the recording.
Small-caps and Mid-caps Lead the Correction
We can see short-term relative weakness in small-caps and mid-caps by comparing the various breadth indicators. The first chart shows the 10-day EMA of AD Percent for the S&P 1500, S&P 500, S&P MidCap 400 and S&P Small-Cap 600. The top window shows this breadth indicator for the S&P 1500 dipping below -20% for the first time this year. Clearly, there is some sort of selling pressure present when AD Percent breaks below -20%. Notice, however, that the indicator bottomed in early November near the 20% area. This suggests that we could be at a make-or-break level.
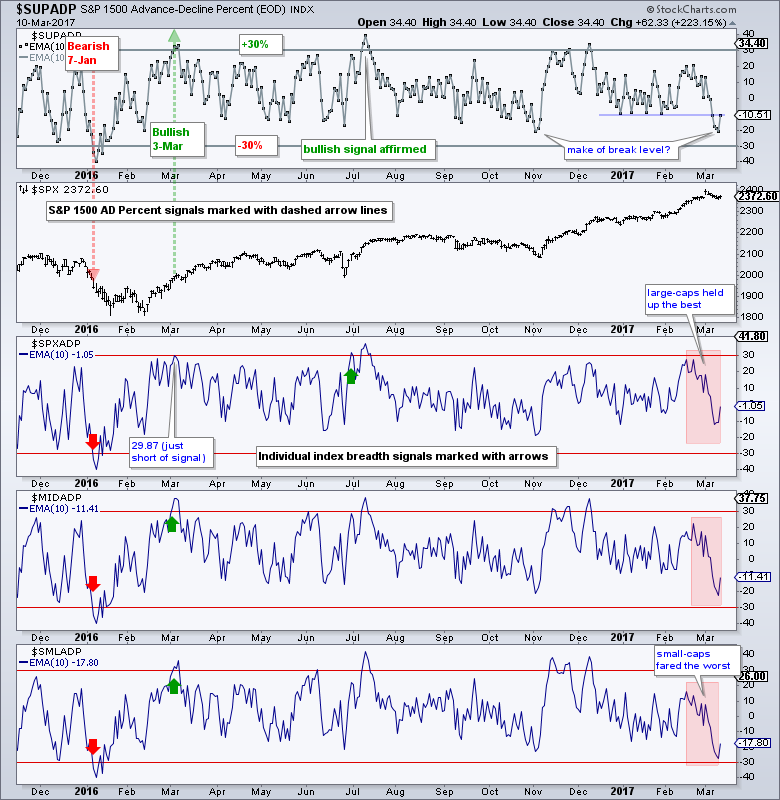 The three lower windows on the chart above show large-caps holding up the best because the 10-day EMA of S&P 500 AD Percent ($SPXADP) is near -10%. The 10-day EMA for S&P MidCap AD Percent ($MIDADP) is near 22% and the 10-day EMA for S&P SmallCap AD Percent ($SMLADP) is around -27%. These numbers confirm broader downside participation in small-caps.
New Highs Dry Up, but New Lows remain Low
The next breadth chart shows the High-Low Percent indicators for the same four indexes (S&P 1500, S&P 500, S&P Mid-Cap 400 and S&P Small-Cap 600). S&P 1500 High-Low Percent ($SUPHLP) is barely positive, but it has yet to actually turn negative. Note that a move below -10% is needed to show broad weakness and trigger a bearish signal.
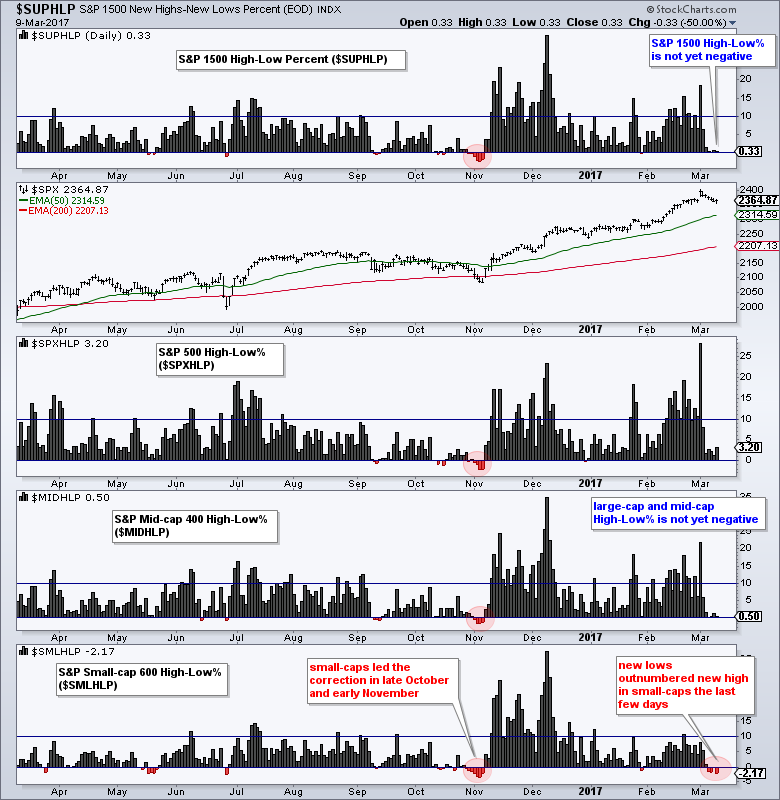
S&P 500 High-Low% ($SPXHLP) and S&P 400 High-Low% ($MIDHLP) surged above +20% last week and this means there are still quite a few stocks near new highs. Even though new highs dried up the last few days, these indicators are nowhere near bearish signals, which would require move below -10%. Again, most of the selling pressure is visible within S&P 600 High-Low% ($SMLHLP) as it turned negative the last few days. Even so, it is only mildly negative and this is expected during a correction.
Over 70% of Stocks Still above 200-day EMA
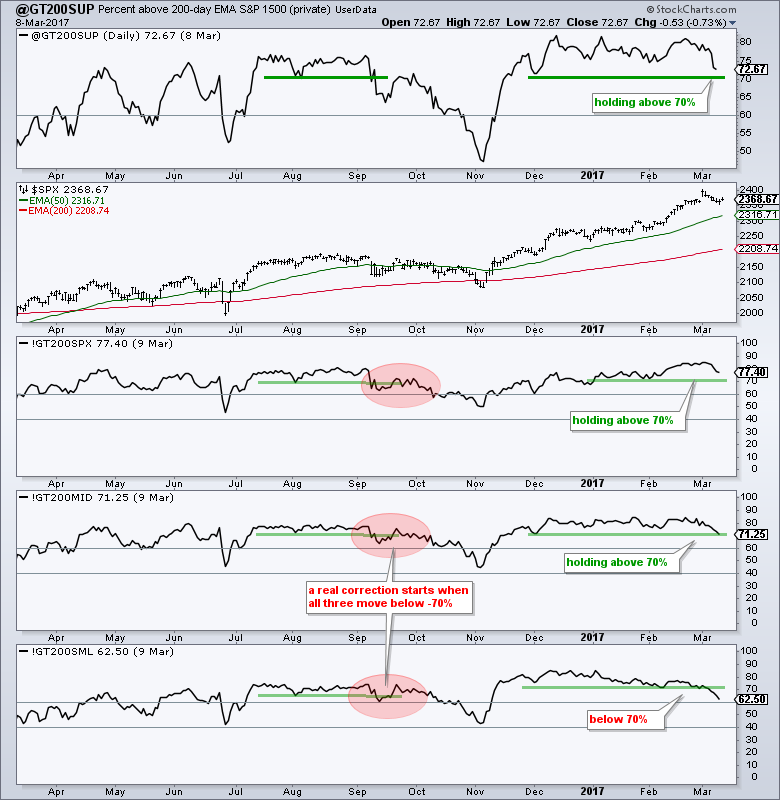
The next chart shows the Percent of Stocks above the 200-day EMA for each index. There are links under this chart to explain the user-defined index (@GT200SUP) and these breadth indicators. Over 70% of stocks in the S&P 1500 are still above their 200-day EMA. A move below 70% would show enough deterioration to suggest a correction. Right now, S&P 500 %Above 200-day EMA (!GT200SPX) and Mid-Cap %Above 200-day EMA (!GT200MID) are above 70%, but Small-Cap %Above 200-day EMA (!GT200SML) is below 70%. Notice that all three moved below 70% in September and all three moved below 60% in October. These moves signaled a "real" correction that affected the whole market. Watch these levels going forward.
Related Links: How to create a user-defined index (@GT200SUP).
Understanding the AD Percent Indicators, High Low Indicators and %Above 200-day EMA Indicators.
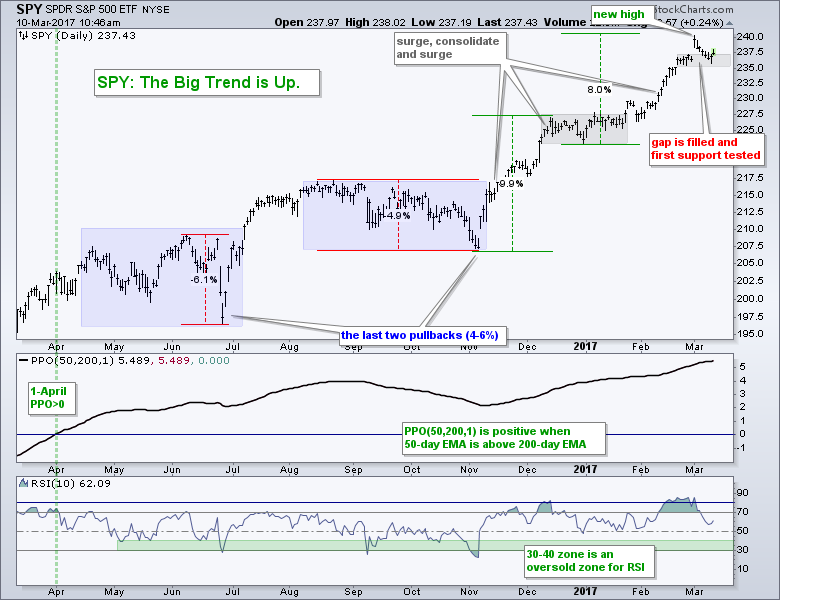
SPY Fills the Gap, but Holds Minor Support
The S&P 500 SPDR (SPY) hit a new high with the gap surge to 240 the previous week and then fell back to the small consolidation zone this week (gray area). We can hardly call this a correction because SPY is still less than 3% from its 52-week high. So far, it is just a small pullback after a sharp advance (8%). I am marking support at 235 and this is based on the small consolidation. A break here would suggest that a deeper correction is unfolding. Note the last two corrections in May-June and October-November (blue areas). These were choppy and drawn out affairs that frustrated short-term traders. Don't be surprised to see the same in the coming weeks. For position traders and medium-term traders, the only real setup comes when RSI dips in the 30-40 zone and starts becoming oversold.
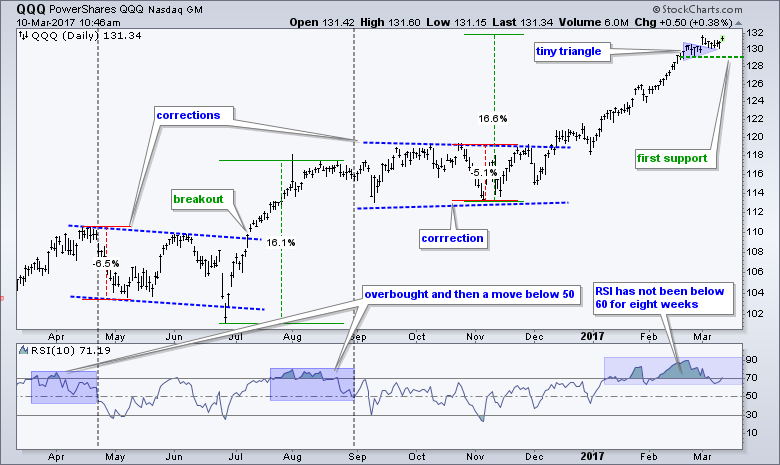
QQQ Stalls at High Level
QQQ remains in a long-term and short-term uptrend. The short-term is getting extended after a 16% advance, but there are simply no serious signs of selling pressure. The ETF stalled around 130 for two weeks and I am watching two things that could signal the start of a corrective period. First, a break below 129 would fill last week's gap and break first support. Second, an RSI move below 50 would signal a downturn in momentum. The blue areas and gray lines mark the last time QQQ became overbought for an extended period and RSI then moved below 50.
IJR Falls Back into Corrective Mode
IJR broke flag resistance with a breakout in mid February, but failed to hold this breakout and fell back below 69. Even though the breakout failed, I am not that bearish on IJR because the long-term trend is still up. Keep in mind that IJR hit a new high just two weeks ago. I could mark support at 67 and say this is a key level, and I could even point out a potential double top. I don't think this should be the focus because I think a break below 67 would be more of an opportunity than a threat. Check out the "support" break just before the big surge in early November.
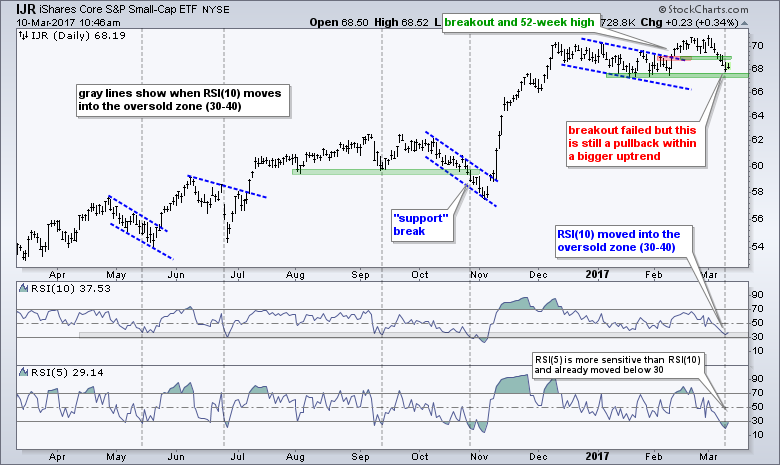
The indicator windows show RSI(10) and RSI(5). Thursday's System Trader article featured a strategy using RSI(5) and the Chandelier Exit for IJR. RSI(5) is more sensitive than RSI(10), but the shape of the lines is pretty much the same. The extremes are the only real differences. RSI(5) exceeds 30 and 70 more often because it is more sensitive. This is why I use oversold zones for RSI(10). A move into the 30-40 area alerts me to oversold conditions and this is when I watch for a bounce.
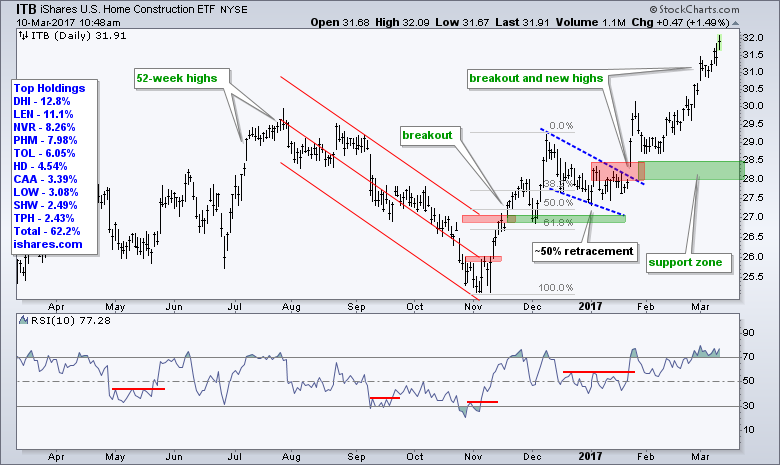
Consumer Discretionary Sector Reflects Split Market
We saw the performance differences with the PerfChart at the beginning of this commentary. Now, let's look at some of the charts. Within the consumer discretionary sector, the Home Construction iShares (ITB) is very strong with a new high this week. The only negative is that the ETF is getting extended on the short-term after a 10+ percent advance.
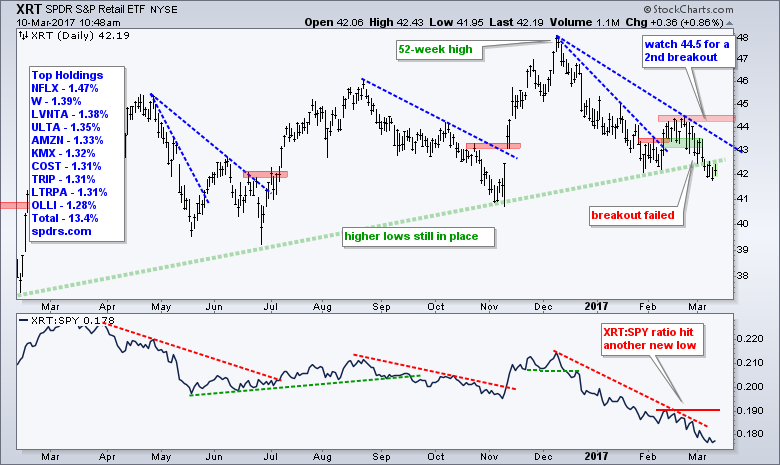
On the reverse, we have the Retail SPDR (XRT) down over 10% from its mid December low. Technically, I can make the case for a long-term uptrend because of the 52-week high in December and the fact that XRT has yet to break the early November low. However, this is one of the weakest groups in the market and it is weighing on the consumer discretionary sector.
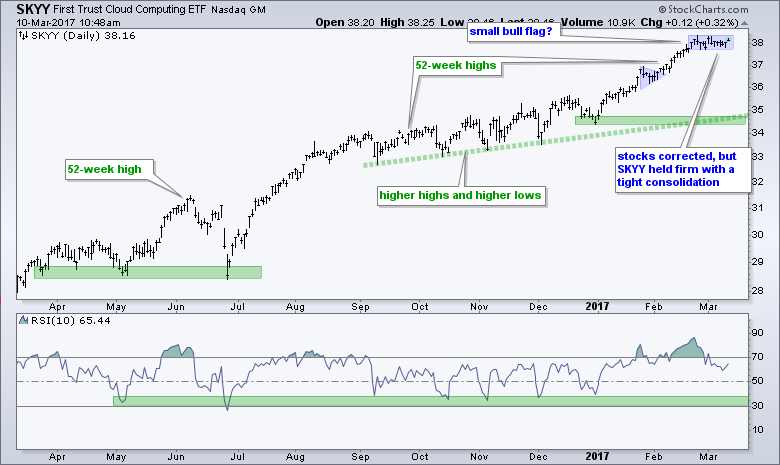
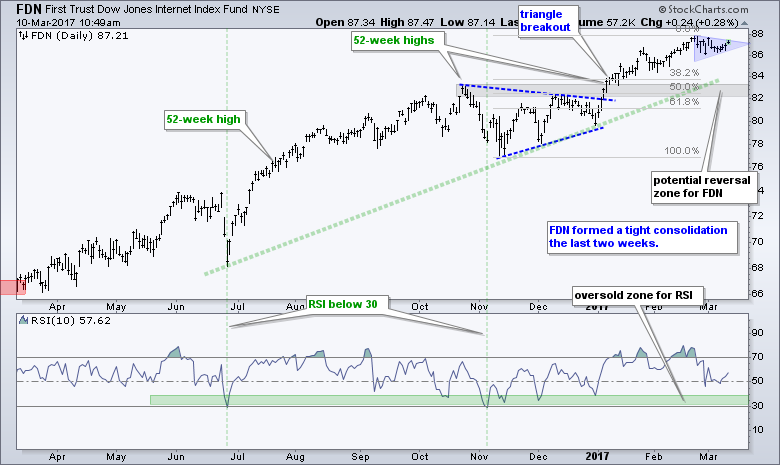
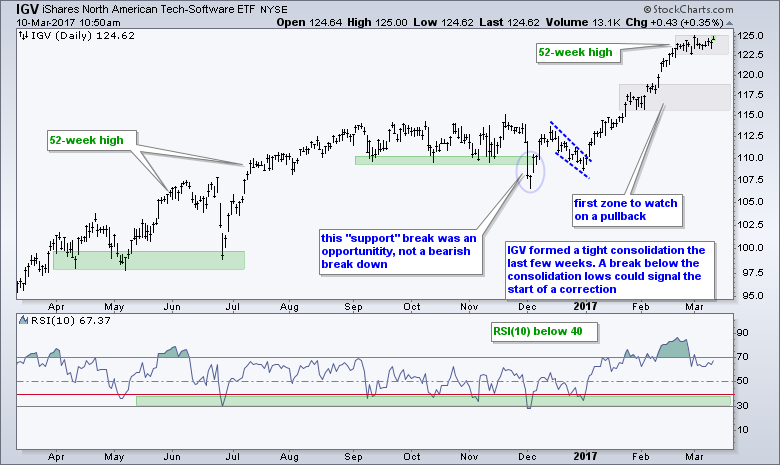
Cloud Computing, Internet and Software ETFs Hold Strong
We can even see splits within the technology sector. The Cloud Computing ETF (SKYY), Internet ETF (FDN) and Software iShares (IGV) are holding strong with flat consolidations the last few weeks. Breaks below the consolidation lows would be short-term negative and suggest a broad correction in the technology sector (QQQ, XLK). For now, these consolidations could be bullish continuation patterns and upside breakouts would signal yet another continuation of the current uptrends.
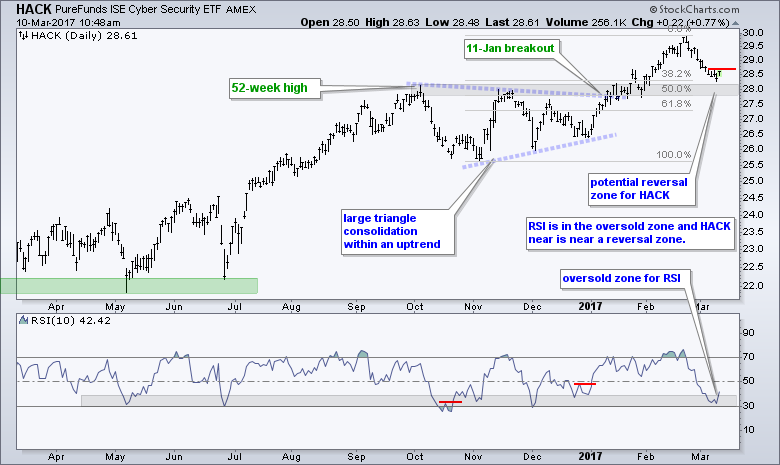
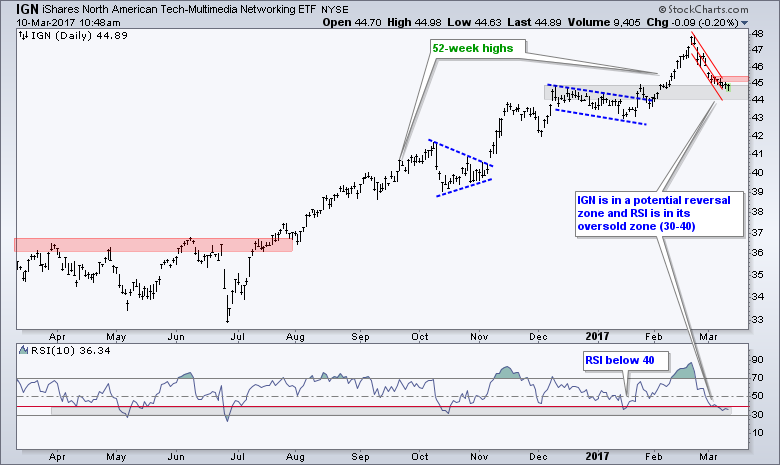
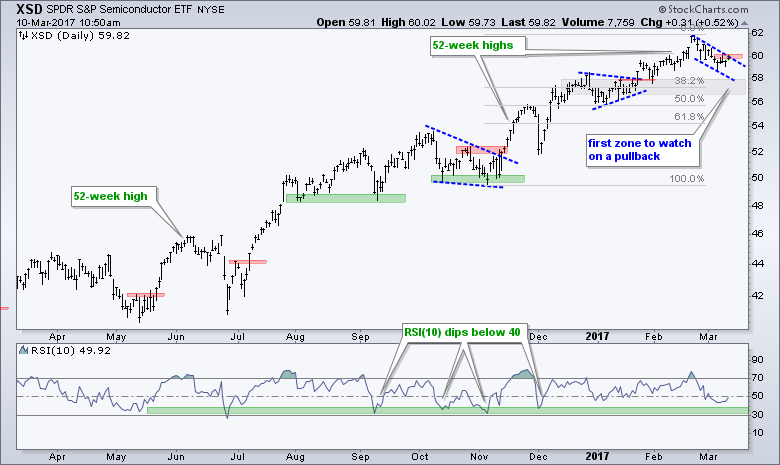
Cyber Security, Networking and Semiconductor ETFs Correct
In contrast to the three ETFs above, the Cyber Security ETF (HACK) Networking iShares (IGN) and Semiconductor SPDR (XSD) pulled back over the last few weeks. RSI entered the oversold zone (30-40) for IGN and HACK as both ETFs pulled back sharply. Also note that both are near potential reversal zones on the chart. The pullback in XSD is more contained as a bull flag takes shape. The red areas mark short-term resistance on each chart.
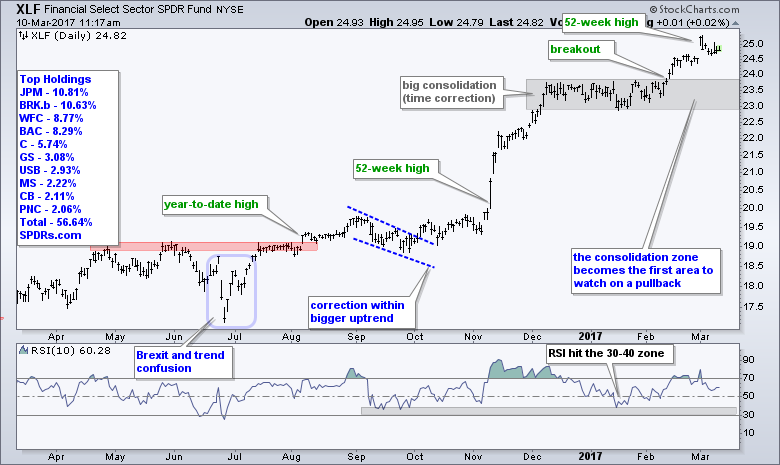
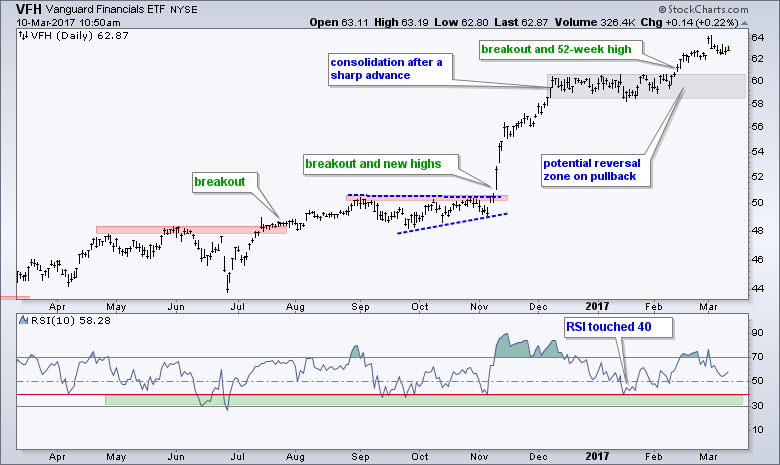
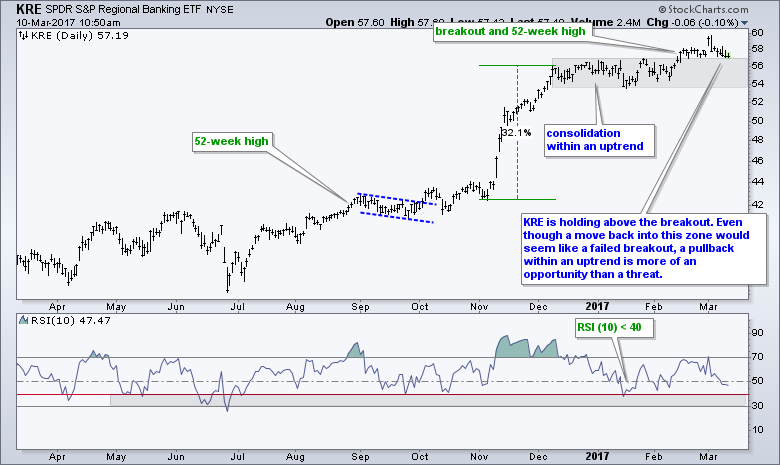
Banking ETFs Hold Breakouts
The Finance SPDR (XLF), Vanguard Financials ETF (VFH) and Regional Bank SPDR (KRE) broke out in mid February and these breakouts are holding. XLF and VFH extended nicely after these breakouts, but KRE is still just above the breakout zone. All three fell back after last week's gaps, but I view this has just short-term noise within a bigger uptrend. The big trends are up and I would not re-evaluate unless all three break their January lows.
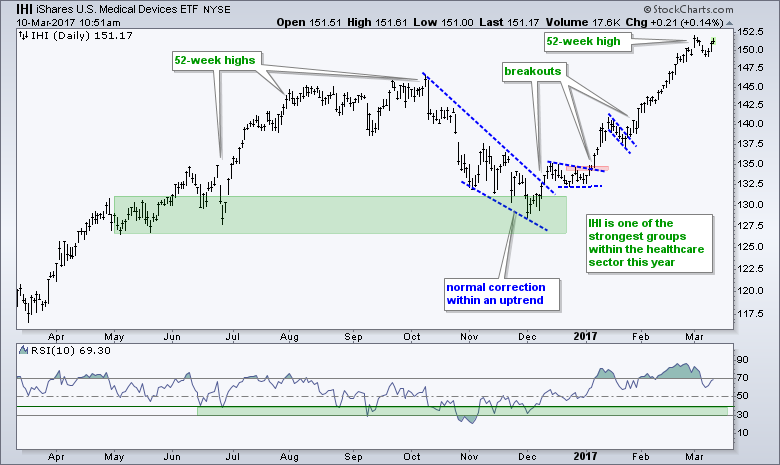
 Healthcare Remains the Healthiest Sector
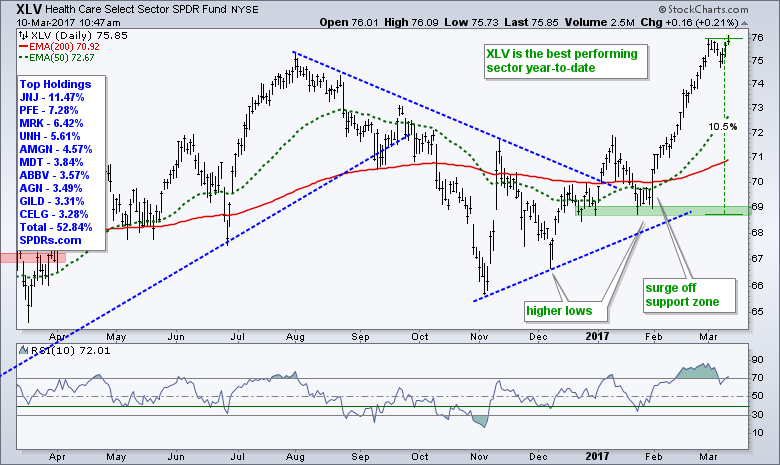
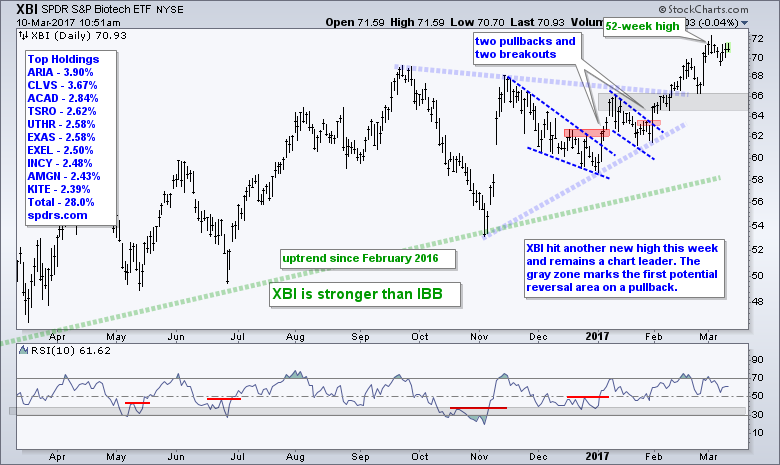
The healthcare-related ETFs may seem extended after big moves the last 5-6 weeks, but this group remains the strongest. Note that High-Low Percent for the healthcare was the highest of the nine sectors on Thursday. As a percent of total issues, the healthcare sector had more new highs than any other sector. Also note that 85% of stocks in XLV are above their 200-day EMA. The HealthCare SPDR (XLV), Biotech SPDR (XBI) and Medical Devices ETF (IHI) hit new highs last week and then pulled back for a few days. All three continued their advance with gains on Wednesday-Thursday and it looks like more new highs are in store. We definitely want to buy the dips in these groups. Now we just need some decent dips.
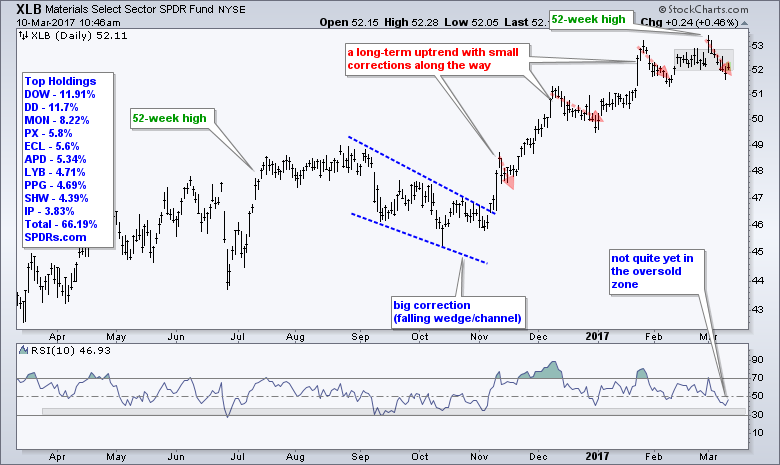
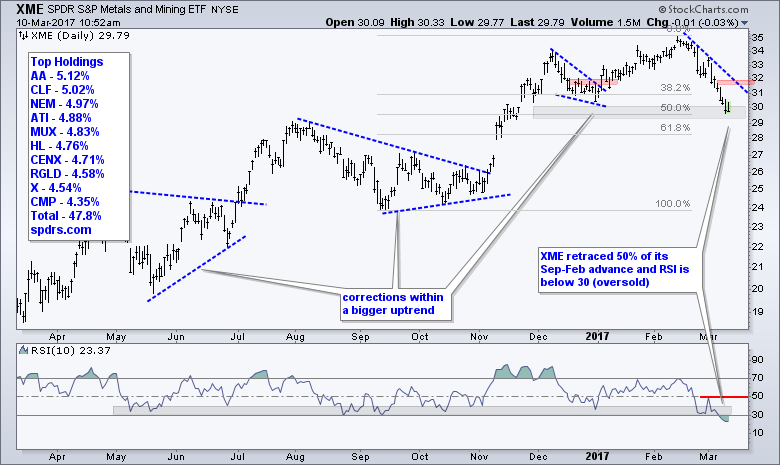
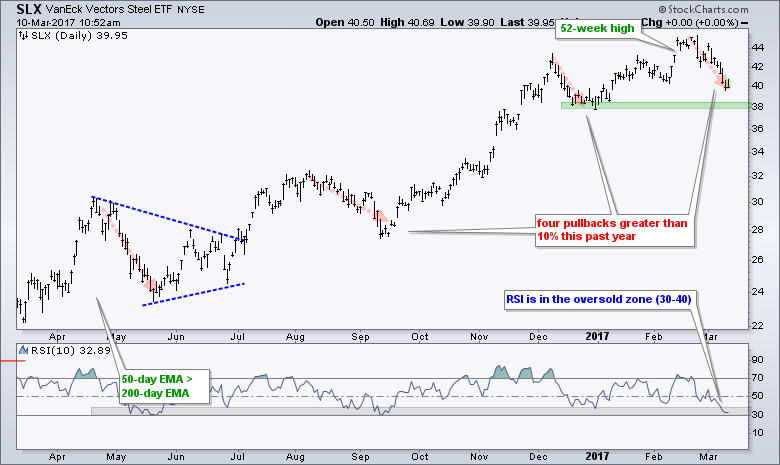
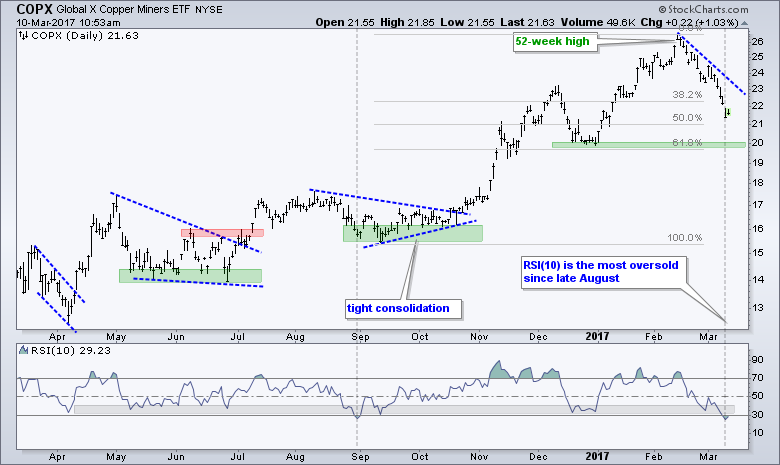
It is Still A Pullback within an Uptrend
The next eight charts highlight ETFs that corrected within their uptrends. Even though these eight are lagging and it seems as if we saw breakdowns in some, I think the long-term trends are up and these are still corrections within these uptrends. The first group shows the Materials SPDR (XLB), Metals & Mining SPDR (XME), Steel ETF (SLX) and Copper Miners ETF (COPX). First and foremost, note that XLB hit a 52-week high two weeks ago and the other three ETFs hit 52-week highs in mid February. I think we can safely assume that the long-term trends are up. This means declines are corrections and corrections within an uptrend present opportunities. XME and COPX are already oversold with RSI(10) dipping below 30.
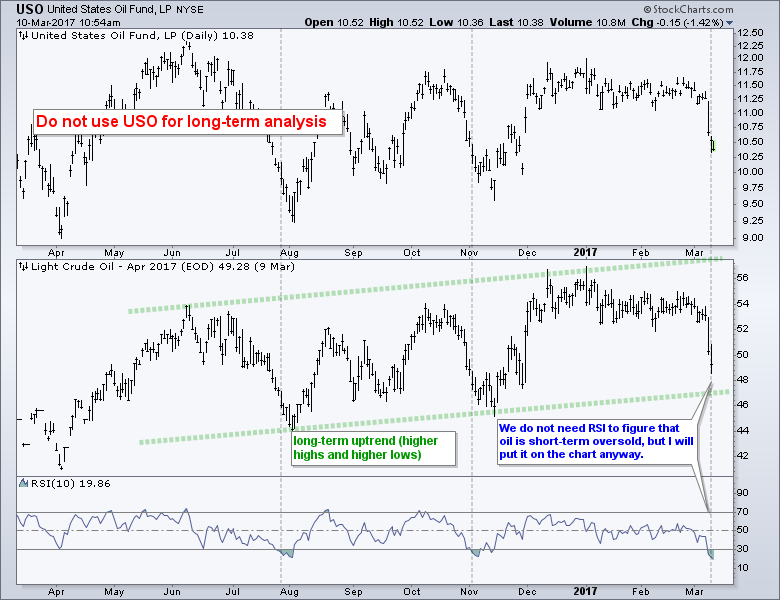
Oil: Just How Bad is It?
Oil stocks were taken out to the woodshed on Wednesday-Thursday as oil fell over 6% in two days. This move was clearly enough to negate the falling wedge that I was focused on the last six weeks or so. However, it was not enough to reverse the long-term uptrend. Huh? We could call the long-term trend flat, but I do not think it is down. April crude remains above the November low and the November low was above the August low. Moreover, crude is now oversold as RSI for USO moved to its lowest level since early November.
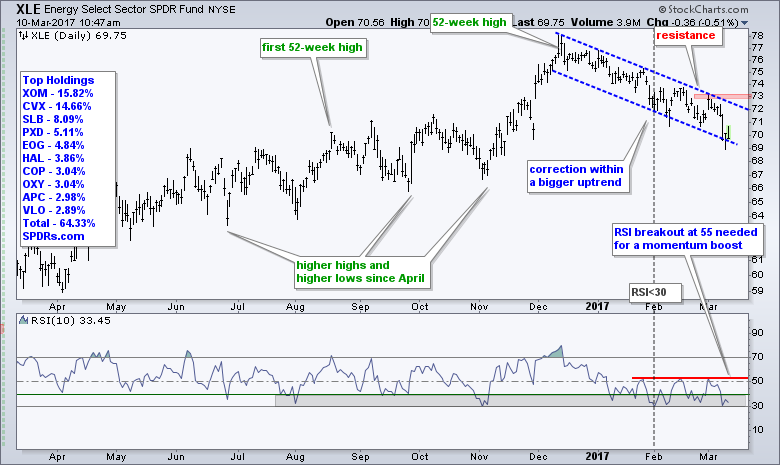
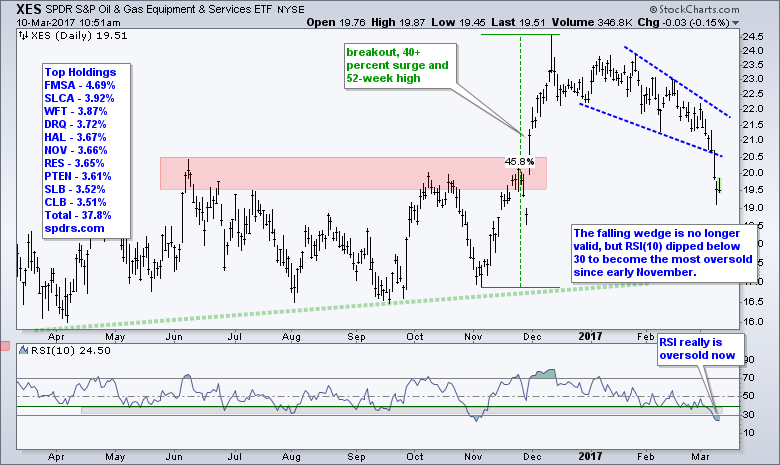
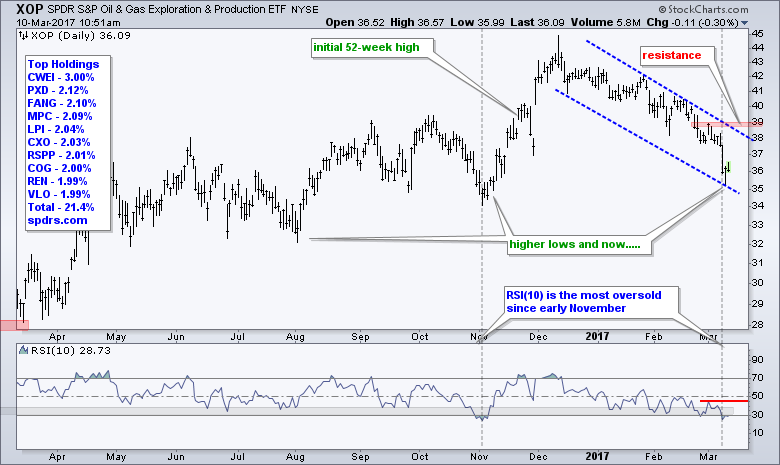
I also think we can make the case for long-term uptrends in the Energy SPDR (XLE), Oil & Gas Equip & Services SPDR (XES) and Oil & Gas E&P SPDR (XOP). Keep in mind that all three hit 52-week highs in December and all three remain above their early November lows. RSI for XLE became oversold at the beginning of February, but RSI has been locked in a range since then. A breakout at 55 is needed for a momentum boost. RSI for XES and XOP dipped below 30 this week and these two are the most oversold since early November.
Treasury Bond ETFs Break Down as Yields Break Up
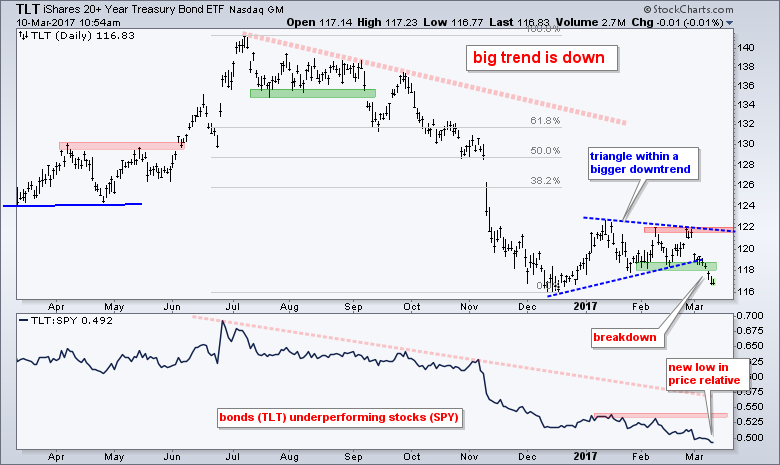
The violent swings in the 20+ YR T-Bond ETF (TLT) finally produced a break. Note that TLT was locked in a triangle consolidation in January and February. Just when it looked as if TLT could possibly break to the upside, it quickly reversed and broke to the downside with a move below 118. This signals a continuation of the bigger downtrend and argues for lower bond prices in the coming weeks. The indicator window shows the TLT:SPY ratio hitting a new low as bonds continue to underperform stocks. This is net positive for stocks.
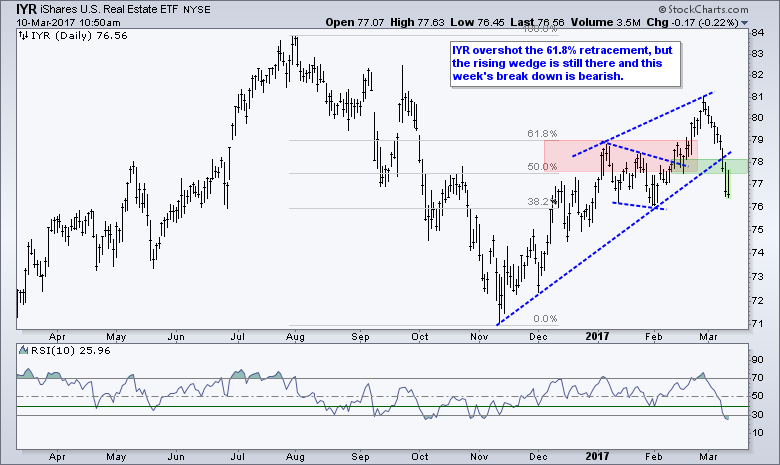
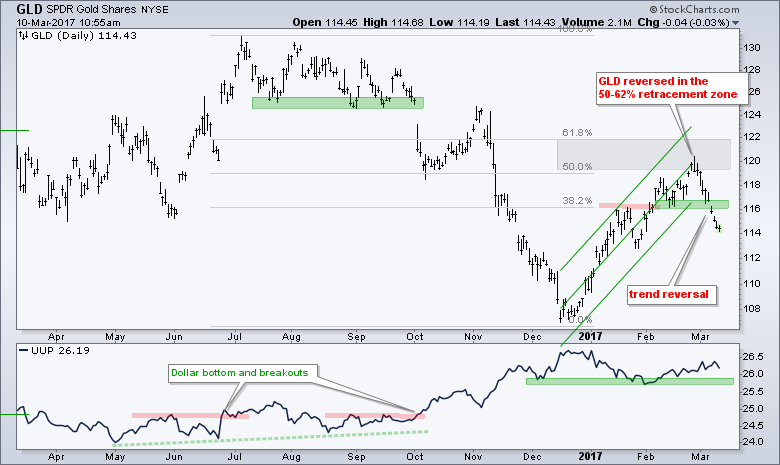
REITs, Utilities and Gold Hit by Rising Rates
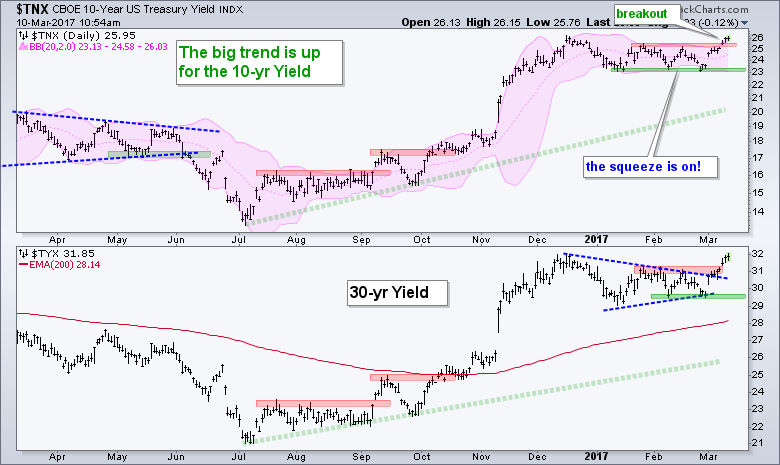
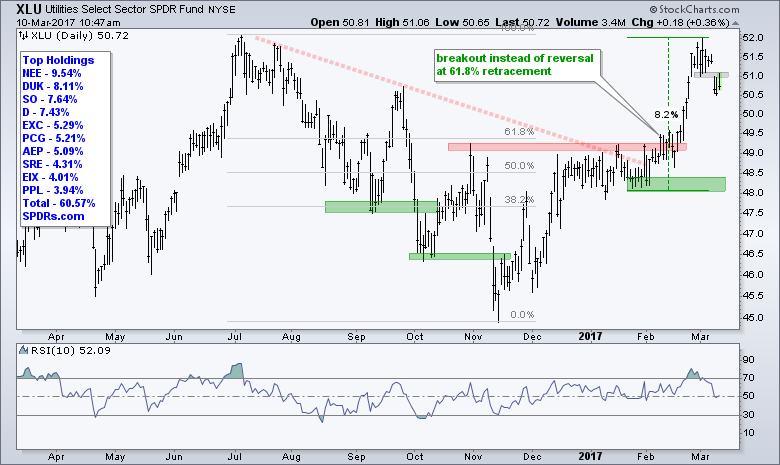
As shown in detail last week, the REIT iShares (IYR), Utilities SPDR (XLU) and Gold SPDR (GLD) are negatively correlated to the 10-yr T-Yield ($TNX). This means they tend to fall when yields rise. The Utilities SPDR (XLU) gapped down on Wednesday and broke short-term support. The REIT iShares (IYR) overshot the 61.8% retracement, but a rising wedge formed none-the-less and the ETF broke down with the move below 77 this week.
GLD continued lower this week and broke support at 116. I am showing the one year chart again and focusing on last week's reversal in the 50-61.8% retracement zone. This week's break down signals a continuation of the prior decline (July-December). I think Treasury yields and the Dollar are driving gold right now. I would re-evaluate my bearish outlook for gold when/if Treasury yields and the Dollar break down.
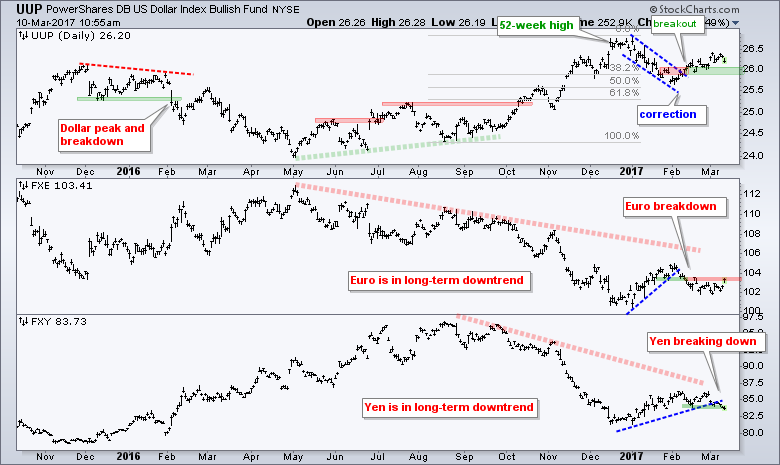
Dollar Grinds Higher
There is no change in the US Dollar ETF (UUP) chart. The mid February breakout was bullish and it is holding. The green support zone marks first support in the 25.8-26 area. In the indicator window, the Euro ETF (FXE) is making a bit of a move the last two days and a breakout at 104 would be positive (Dollar negative). The Yen ETF (FXY) weakened the last few days and broke support.
******************************************************
Spotting Pullbacks and Upturns within an Uptrend using RSI and MACD Histogram.
Difference between EMA and SMA - Using %Above 200-day EMA for Breadth Analysis.
Backtesting Different Moving Average Pairs with SPY, QQQ and IWM.
ETF Master ChartPack - 300+ ETFs organized in a Master ChartList and in individual groups.
Follow me on Twitter @arthurhill - Keep up with my 140 character commentaries.
****************************************
Thanks for tuning in and have a good day!
--Arthur Hill CMT
Plan your Trade and Trade your Plan
*****************************************


