 |
.... Failure for One Trader is Opportunity for Another |
Failure for One Trader is Opportunity for Another
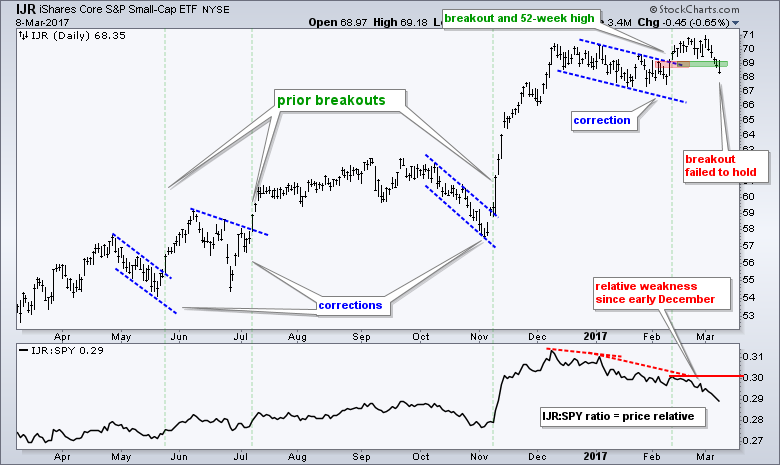
Trading is a funny business because there are two sides to every trade. In general, sellers are motivated because they think prices are going lower or the bullish setup failed. Buyers are motivated because they think prices are going higher and a bullish setup is at hand. These differing motivations are now present on the S&P SmallCap iShares (IJR) chart. Pattern traders saw a bull flag and a breakout in mid February. This breakout failed when IJR closed below 69 on Tuesday.
Mean-Reversion Trades and Setups for IJR
Instead of a failure, mean-reversion traders see a potential bullish setup brewing. First, the long-term trends for the S&P 500 SPDR (SPY) and the S&P SmallCap iShares are up. This means mean-reversion traders are looking for pullbacks within this uptrend. Chartists can define pullbacks with a visual inspection of the price chart or an RSI(5) dip below 30, which occurred on Tuesday. This dip suggests that IJR is short-term oversold and chartists should prepare for a bounce.
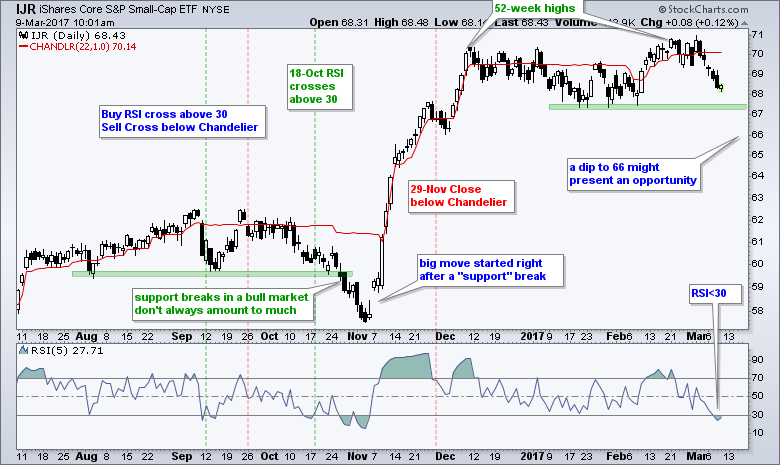
The green lines show when RSI moved back above 30 for a buy signal and the red lines show when IJR closed below the Chandelier Exit. The buy signal on October 18th would have been tough to sit through because the ETF broke below the September lows. RSI also moved below 30 two more times. The exit did not occur until late November when IJR closed below the Chandelier Exit (22,1).
RSI just moved below 30 and this means another setup is in the making. I do not know if IJR will continue to fall (as in October) or if the ETF will bounce immediately. Nobody knows. Before looking at backtest results for this strategy, I would like to rant about the futility of minor support breaks in an uptrend. Notice how IJR broke "support" in late October and then surged over 20%. This suggests that a break below the January lows (current "support") would be more of an opportunity than a threat. Here is an article detailing my thoughts on support and resistance for indexes and ETFs.
Backtesting Two Short-term Mean-Reversion Strategies
The table below shows backtest results for two strategies. The first buys when RSI(5) crosses above 30 and sells when RSI(5) crosses below 70. The second buys when RSI(5) crosses above 30 and sells when price closes below the Chandelier Exit (22,1). There are no stop-losses, just exits. The backtest runs a little over 16 years and includes two bear market periods. The strategy only trades long positions and only trades when the S&P 500 is in a long-term uptrend (50-day EMA is above 200-day EMA). Short positions DO NOT add value and the S&P 500 is the ONLY index we need for broad market timing.
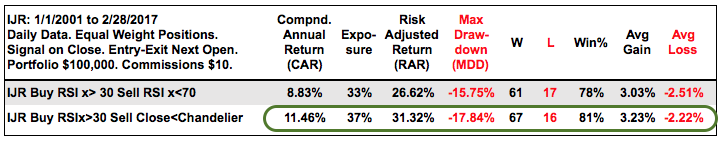
The results are pretty good, especially for the strategy using the Chandelier Exit (Compound Annual Return of 11.46% and a Maximum Drawdown of 17.84%). The Win% was high (~80%) and the system was exposed to the market 37% of the time. Note that the S&P 500 was in an uptrend 69% of the time (50-day EMA above 200-day EMA). This means the system was in the market 53% of the tradable timeframe, which was 69%. This may not seem like much, but it was enough to produce good returns with modest drawdowns.
Completed Trade and Current Setup for MDY
The next step is to expand the ETF universe and test five major index ETFs (SPY, QQQ, DIA, MDY and IJR). I am just testing the strategy that buys when RSI(5) moves above 30 and sells when price closes below the Chandelier Exit. As noted on the tables, the signals are based on closing prices and the entries-exits are based on the next open. The chart below shows a completed trade with MDY.
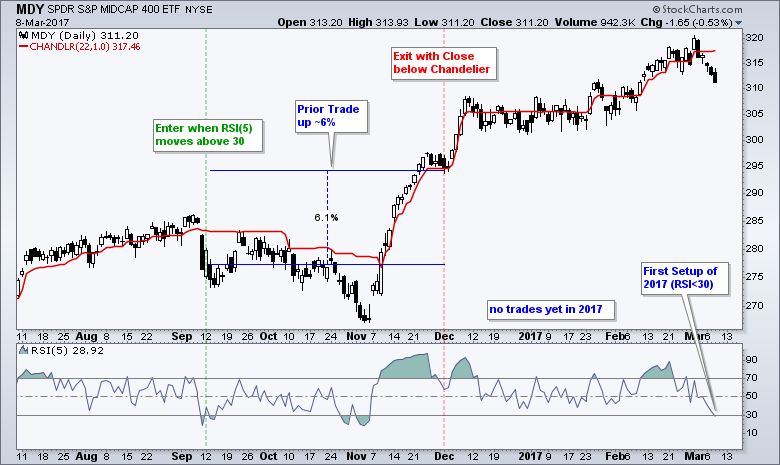
The system buys when RSI dips below 30 and then moves back above 30. The Chandelier Exit is almost always above the buy point. This means prices must rise above the Chandelier Exit before a sell signal is possible. The sell signal triggers when price closes below the Chandelier Exit. It is important to understand how the Chandelier Exit works and you can read more in our ChartSchool article.
Testing Five Major index ETFs
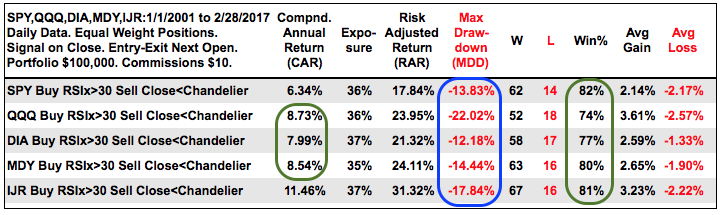
The table below shows backtest results for each ETF. SPY was the worst performer and IJR was the best. QQQ, DIA and MDY returned around 8%. QQQ had the highest Maximum Drawdown, which reflects above average risk. The Win% for each was around 80% and exposure was around 36%. Before leaving this table, note that the Maximum Drawdowns ranged from 12% to 22%.
Trading a Portfolio to Reduce Risk
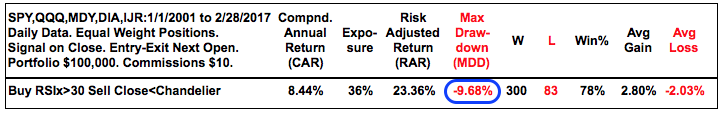
The next step is to treat these five ETFs as part of a portfolio. Using the same buy and sell rules, this strategy can hold up to five equal weigh positions (20% each) and only trades when the long-term trend for the S&P 500 is up. There is not much change in the Compound Annual Return (8.44%), exposure (36%) or Win% (78%). There is, however, a big change in the Maximum Drawdown. The smallest Maximum Drawdown was 12% when trading these ETFs individually. The Maximum Drawdown fell below 10% when trading these five ETFs as a group. I consider this big victory for risk management.
Equity Curve and Drawdown Chart
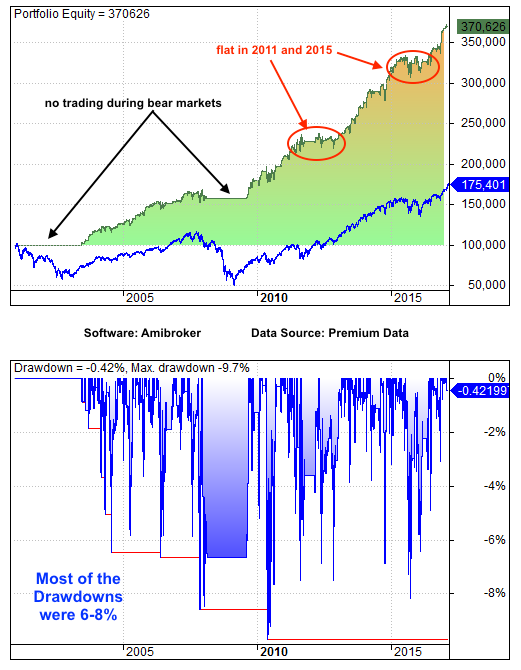
The image below shows the equity curve and the drawdowns from 2001 to 2017. The system did not trade when the 50-day EMA was below the 200-day EMA for the S&P 500. There were two flat periods in 2011 and 2015. Outside of the bear markets and flat periods, the equity curve shows a pretty steady rise. The drawdowns were mostly between 6% and 8%. This seems pretty tolerable for a strategy that generates returns that are around 8% per annum.
Conclusions
The results are pretty typical for mean-reversion trading systems. The Win% is relatively high (~80%), the exposure is relatively low (~36%) and the equity line is pretty stable. The backtest results certainly look good, but keep in mind that this does not guarantee future results. I am not too concerned with slippage because these ETFs are very actively traded. The Average Gain for trades using the 5 ETF Portfolio was 2.8% and the average loss was 2.03% (2.8/2 = 1.4) I am not too thrilled with this ratio, but keep in mind that the Win% was very high (78%) and there were lots of trades (383). Overall, the results for the 5 ETF Mean-reversion are quite impressive because the Maximum Drawdown is only slightly higher than the Compound Annual Return.
******************************************************
All the System Trader Articles so far....
Difference between EMA and SMA - Using %Above 200-day EMA for Breadth Analysis.
Backtesting Different Moving Average Pairs with SPY, QQQ and IWM.
ETF Master ChartPack - 300+ ETFs organized in a Master ChartList and in individual groups.
Follow me on Twitter @arthurhill - Keep up with my 140 character commentaries.
****************************************
Thanks for tuning in and have a good day!
--Arthur Hill CMT
Plan your Trade and Trade your Plan
*****************************************


