 |
.... Small-caps versus Finance and Healthcare .... New Highs Lag, but %Above 200-day Holds Up .... Two Gaps Establish First Support for SPY .... QQQ Continues to Lead and IJR Continues to Lag .... Healthcare, Tech and Consumer Discretionary Lead .... New High Milestones for Healthcare and Consumer discretionary .... Industrials and Finance Pull Back .... Breadth Indicators Turn Net Bearish for XLE .... Telecom iShares Firm at Key Retracement .... Coal ETF Goes for a Breakout .... Oil Remains at an Interesting Juncture .... TLT Remains in Breakdown Mode .... Gold Gets Interesting - Or Does it? .... Dollar Continues on its Way to Nowhere .... Indonesia ETF Surges off Support .... |
----- Video Link ----- Art's Charts ChartList (updated 18-Mar) -----
Small-caps versus Finance and Healthcare
Stocks surged this week with most sectors and industry groups participating. The Finance SPDR and the HealthCare SPDR were noticeably absent from this week's rally. I do not want to debate the reasons, but would note that both are in long-term uptrends and any weakness would be considered a correction. In any case, finance and healthcare may not be the big story. Strength in small-caps was perhaps overshadowed by weakness in finance and healthcare. It is just one week, but it is positive to see small-caps perking up after leading lower the week before. The Russell 2000 iShares (IWM) and the S&P SmallCap iShares (IJR) are both on course to gain around 1.5% this week.
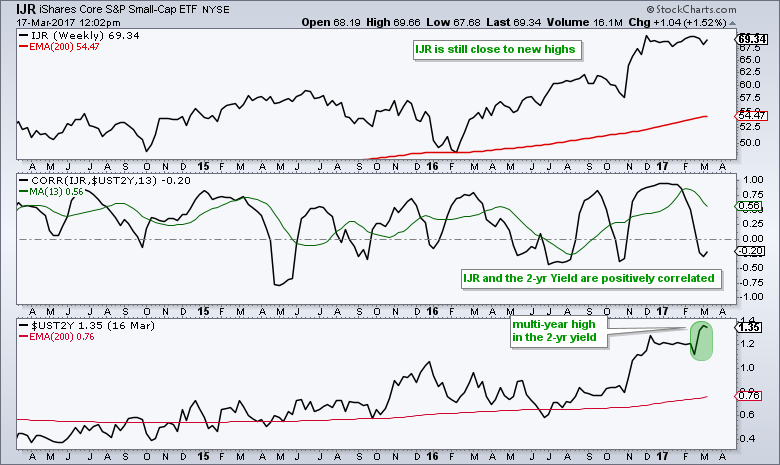
It seems that small-caps are quite happy with the rise in the 2-yr yield. The chart below shows IJR in the top window, the Correlation Coefficient with the 2-yr Yield in the middle window and the 2-yr Yield in the lower window. First, notice that IJR is still pretty darn close to a 52-week high and not really that weak. Second, notice that IJR and the 2-yr yield are positively correlated for the most part. Third, notice that the 2-yr Yield surged to a multi-year high this week. Continued strength in the 2-yr yield could provide the fuel needed for small-caps to break out of their funk.
Programming Note: I will post the Weekly Review & Outlook Video tomorrow. This video will cover everything in this commentary, plus a weekly performance review and over 20 industry group ETF charts.
New Highs Lag, but %Above 200-day Holds Up
The breadth indicators for the S&P 1500 bounced along with stocks, but S&P 1500 High-Low Percent ($SUPHLP) is still not keeping pace. First, notice that the 10-day EMA of AD Percent bounced off the -20% area for the second time since early November (green circles). The November bounce extended to the +30% with strong follow through. The current bounce is just five days and strong follow through is needed to reach 30% again.
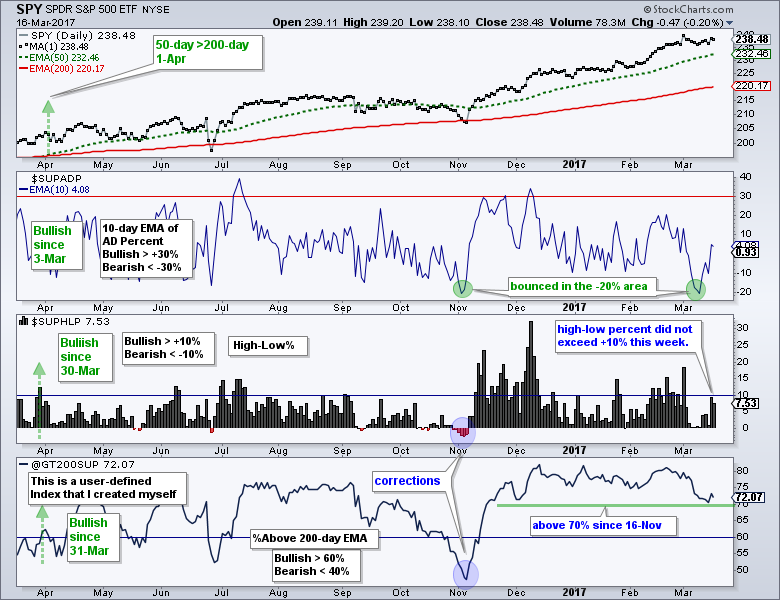
I am concerned with the lack of new highs during this surge. High-Low Percent quickly moved above +20% in early November and High-Low Percent did not exceed +10% this week. Participation is clearly waning and small-caps get the blame. I continue to watch the percentage of S&P 1500 stocks above the 200-day EMA for clues on the elusive correction. Notice that this user-defined index has held above 70% since 16-Nov. A move below 70% would show some weakening within the market that could foreshadow a correction.
Related Links: How to create a user-defined index (@GT200SUP).
Understanding the AD Percent Indicators, High Low Indicators and %Above 200-day EMA Indicators.
Two Gaps Establish First Support for SPY
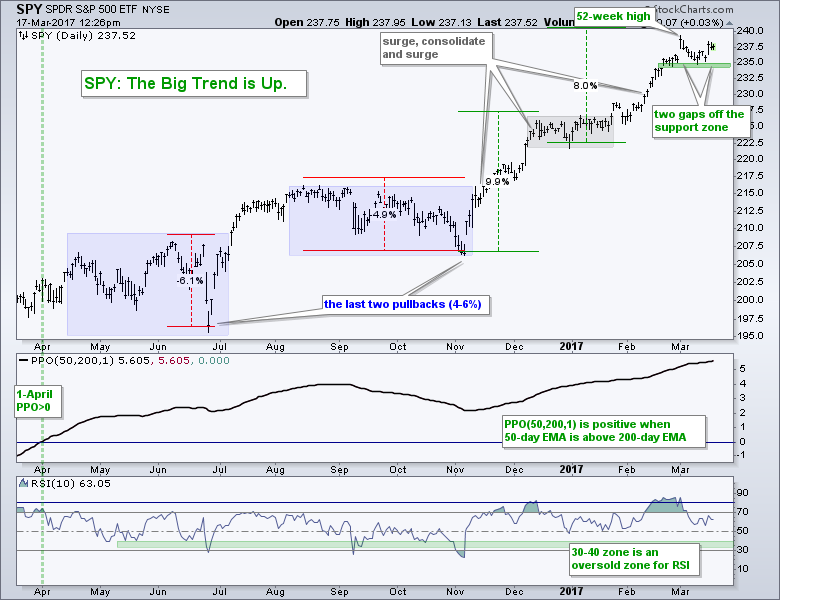
The S&P 500 SPDR (SPY) hit a new high with a gap-surge in early March, fell back to the 236 area and bounced with another gap on Thursday. We have two gaps off the support zone and 235 is the first level to watch. A close below 235 would negate both gaps and provide the first sign of selling pressure worth noting. I will refrain from marking support and adding Fibonacci Retracements until a correction is here. Now that I am refraining, we will probably get the correction.
QQQ Continues to Lead
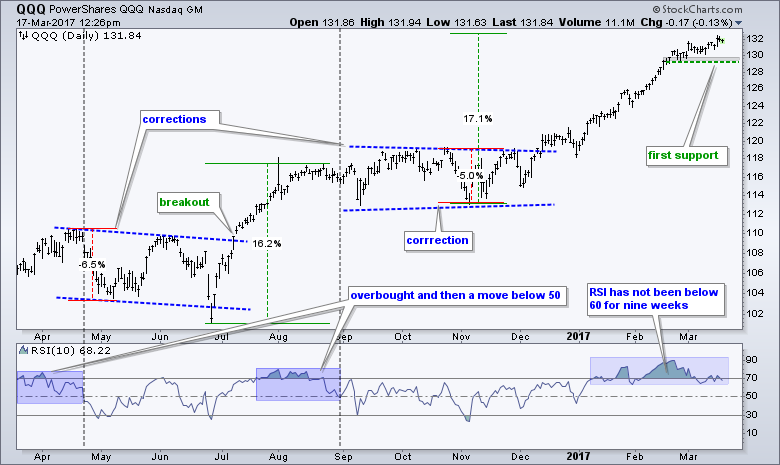
The Nasdaq 100 ETF (QQQ) remains the leader with another new high this week. QQQ is up over 15% from its early November low and the undisputed leader. RSI is back above 70 and has not been below 60 since early January. I am watching two levels that would suggest a correction is unfolding. First, a close below 129 in QQQ would break first support. Second, an RSI close below 50 would show a downturn in momentum. Again, I will not add the Fibonacci Retracements or mark correction targets until the correction actually starts.
IJR Continues to Lag
The S&P SmallCap iShares (IJR) remains the market laggard and stuck in a consolidation. We could call it a rectangle and watch support from the recent lows, but I do not think it is a topping pattern. It is more like a continuation pattern that represents a rest after the 20+ percent surge late last year. In fact, I think a support break and dip to the 200-day EMA would be more of an opportunity than a threat. For now, IJR is holding inside the consolidation and making an attempt to bounce with this range.
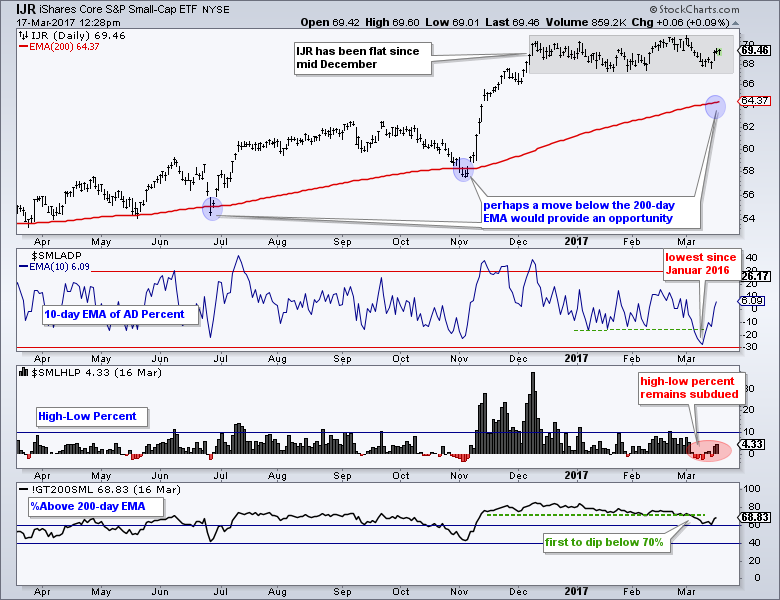
I added the breadth indicators for IJR below the price chart. Notice that the 10-day EMA of AD Percent dipped to its lowest level since January 2016. This showed the most downside participation in over a year, but did not exceed -30% to trigger a bearish breadth thrust. High-Low Percent is not that strong and remains below +5%, but it is back out of negative territory. The Small-Cap %Above 200-day EMA (!GT200SML) broke below 70% and this means more than 30% of stocks in IJR are below their 200-day EMA. It is still a minority, but enough to put a drag on the ETF.
Healthcare, Tech and Consumer Discretionary Lead
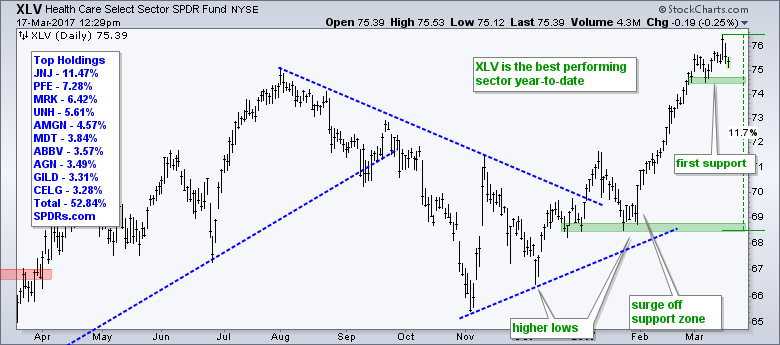
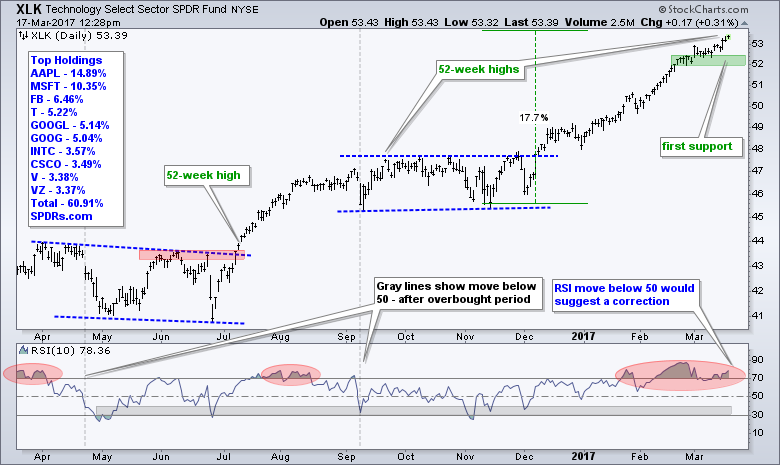
In addition to some performance divergences in the major index ETFs, we can also see some small performance divergences in the key sector SPDRs. These are not long-term issues that suggest a major trend change though. Instead, they are short-term and these declines are corrections within the bigger uptrends. First and foremost, note that the Technology SPDR, HealthCare SPDR and Consumer Discretionary SPDR hit new 52-week highs this week. These three sectors account for 48% of SPY so around half the market is doing just fine. As the PerfChart below shows, these three sectors are also the year-to-date leaders. 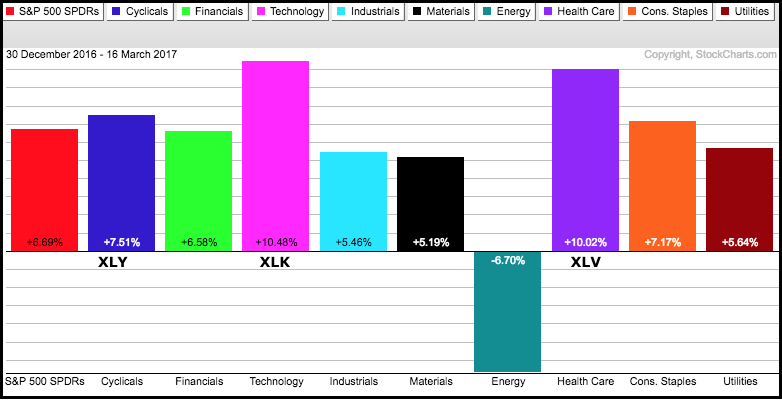
New High Milestones for Healthcare and Discretionary
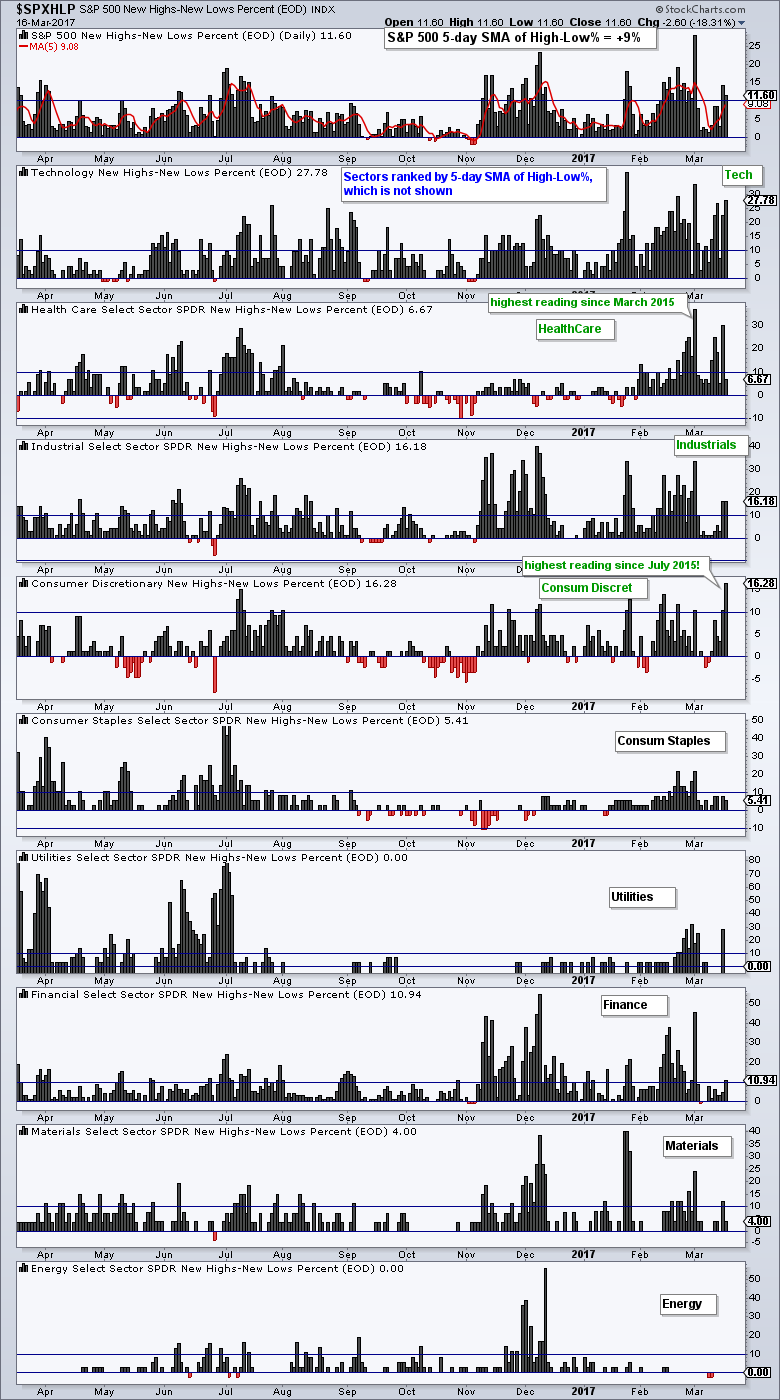
I am also seeing an expansion of new highs in the consumer discretionary sector. Yes, you read right, the consumer discretionary sector, which is the most economically sensitive sector. The chart below shows High-Low Percent for the nine sectors and these histograms are sorted by the 5-day SMA of High-Low Percent. The most new highs can be found in technology, healthcare, industrials and consumer discretionary. Notice that High-Low Percent hit a two year high for healthcare and an eighteen month high for consumer discretionary. This means the consumer discretionary sector is currently seeing the most new highs in over a year and a half and this is clearly positive for stocks.
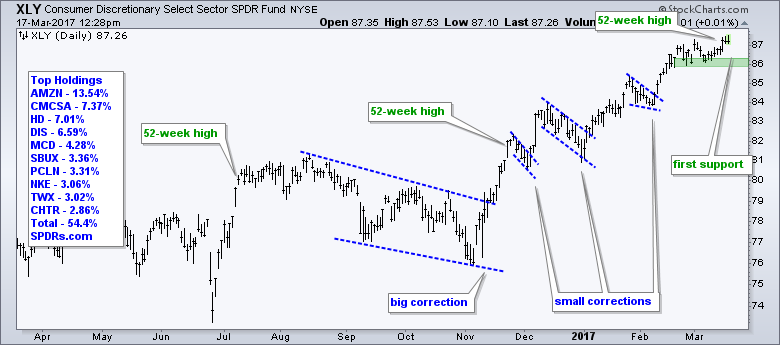
The next three charts show XLY, XLK and XLV with the early March lows marking first support. The long-term trends are up and extended so the only thing to do is watch first support for signs that a correction may be unfolding.
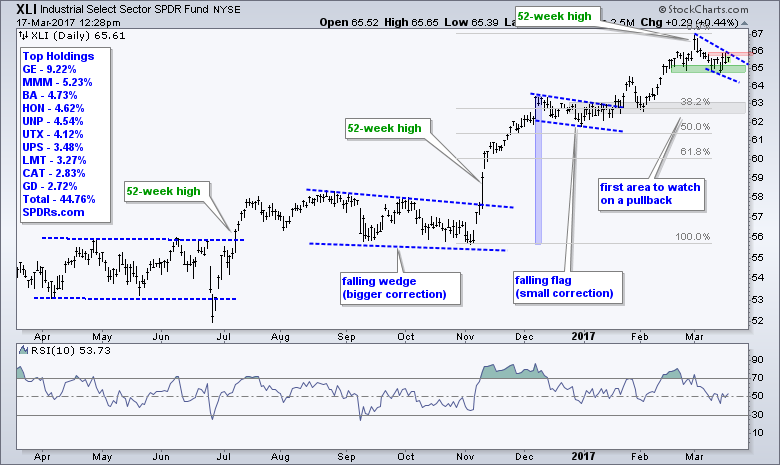
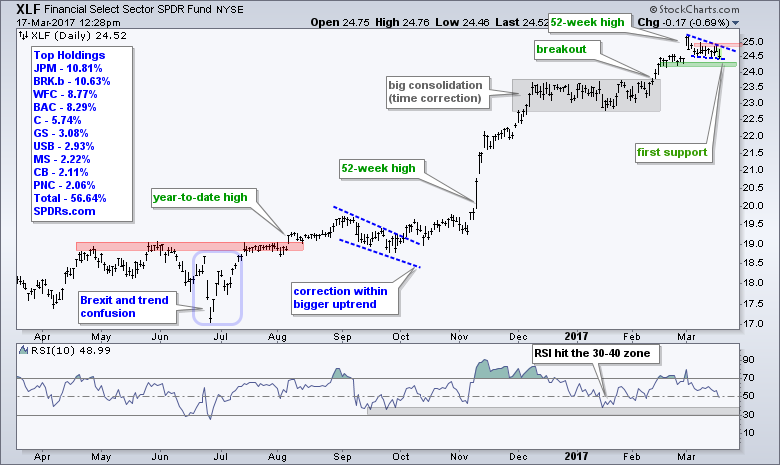
Industrials and Finance Pull Back
The Industrials SPDR (XLI) and the Finance SPDR (XLF) are lagging over the last two weeks. Both hit 52-week highs in early March so the long-term uptrends are not in question, nor are they under threat. Both pulled back with falling wedges and the red areas marks wedge resistance. Upside breakouts would put these two back on track. I also marked short-term support and breaks would argue for a deeper pullback that could weigh on the broader market.
Breadth Indicators Turn Net Bearish for XLE
The Energy SPDR (XLE) hit a 52-week high in early December and then declined steadily the next three months. Even though XLE remains above the early November low, this decline is a bit excessive for a correction within an uptrend. The blue trend lines define the channel and I am marking resistance at 72. XLE needs a STRONG surge above 72 to end the correction and turn bullish again.
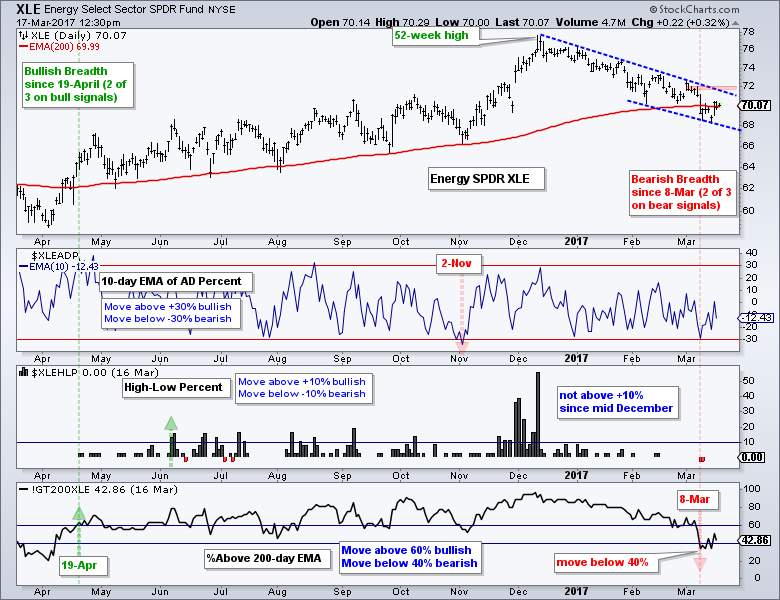
Overall, I am souring on XLE because two of the three breadth indicators are now on bear signals. The 10-day EMA of AD Percent triggered on November 2nd and the Energy %Above 200-day EMA (!GT200XLE) moved below 40% on March 8th. This means two of the three breadth indicators have active bear signals.
Telecom iShares Firms at Key Retracement
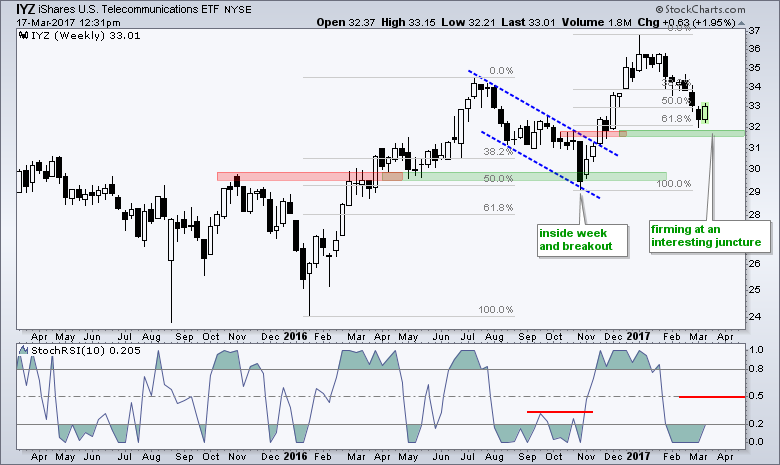
The Telecom iShares (IYZ) was hit hard this year and is one of the worst performing industry group ETFs. Nevertheless, I look at this chart and see a potential bullish setup. First, the ETF hit new highs in July and December last year (long-term uptrend). Second, the decline, while steep, retraced 61.8% of the prior advance. This is normal for a correction within a bigger uptrend. Third, the ETF is firming just above the breakout zone from late November. This is a good spot for a reversal and I would watch StochRSI for a move above .50 (the centerline).
Coal ETF Goes for a Breakout
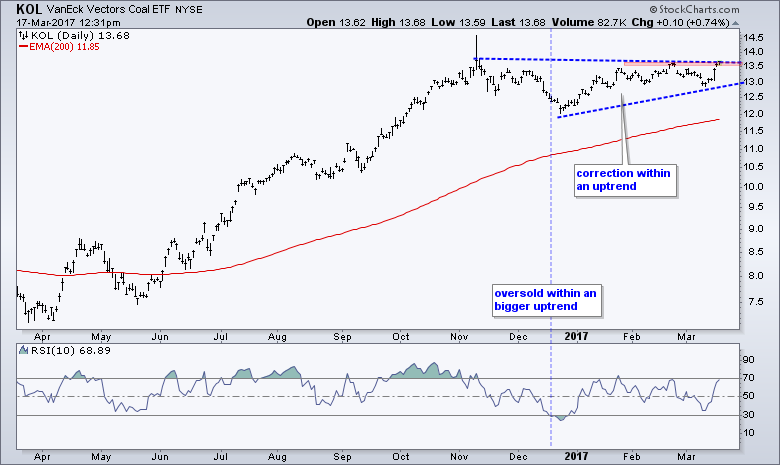
I may be souring on the energy sector, but the Coal ETF (KOL) is bucking the selling pressure and poised for a breakout. The chart shows KOL surging to new highs in October-November and then embarking on a corrective period with a large triangle. I elected to draw through the November spike (fielder's choice). RSI became oversold in late December for a mean-reversion setup. We are now seeing a challenge to triangle resistance and a breakout would signal a continuation of the bigger uptrend. Achtung! Low price = higher volatility and higher risk.
 Oil Remains at an Interesting Juncture
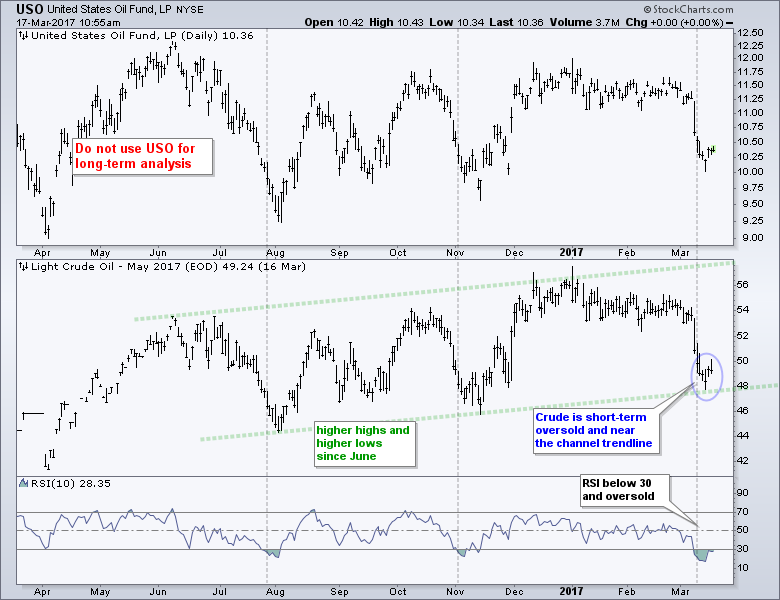
Just what the heck does an "interesting juncture" mean? Unbeknown to most, this is a classic analysis term that is widely used on Saint Patrick's Day. Just kidding. An interesting juncture is a spot on the price chart that could produce at reversal. It is like a make-or-break level and oil is at such a level right now. May Crude (^CLK17) is in a long-term uptrend with higher highs and higher lows since June. Crude plunged last week and firmed near the lower trend line of a rising channel. I do not think trend lines mark "hard" support levels. Instead, the angle of the trend line measures the steepness of the current uptrend, which is also the rate of ascent. Should the current rate of ascent continue, I would expect a bounce off the 48-50 area. Crude is interesting right here because RSI is oversold and the bigger trend is up. Failure to bounce here could have some seriously negative consequences for oil and energy-related stocks.
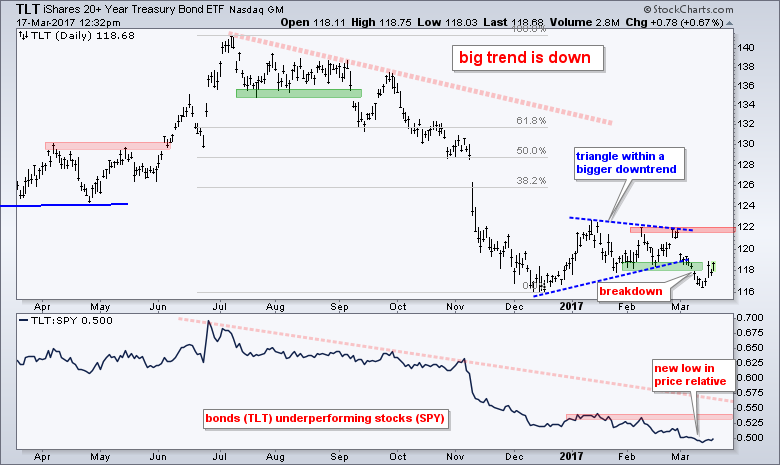
TLT Remains in Breakdown Mode - Despite Bounce
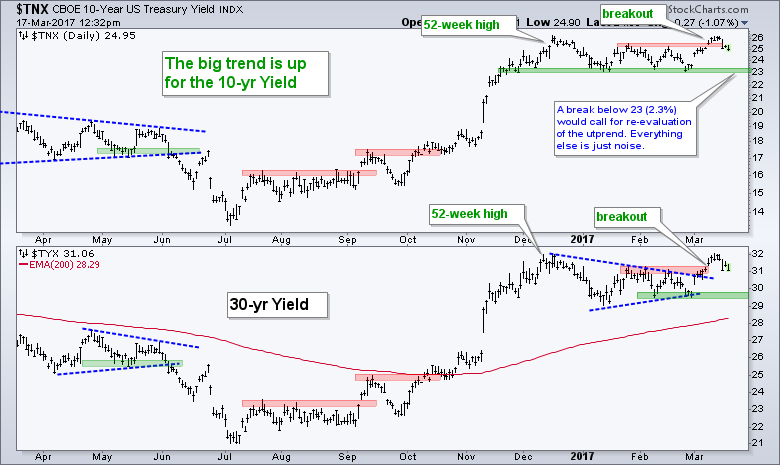
The 20+ YR T-Bond ETF (TLT) plunged last week and then rebounded this week with a surge on Wednesday. It looks like a little sell-the-rumor (Fed hike) and buy-the-news (actual Fed hike). I think the price action over the last three days is just noise and have not changed my overall assessment. First, the long-term trend is down. Second, the triangle was a consolidation within this downtrend. Third, TLT broke support with a sharp move lower. Even though the rebound may seem like a "failed" breakdown, I would not get too caught up in this short-term noise. Treasury bonds are in a downtrend and Treasury yields are in an uptrend. This is what really matters. I am marking resistance at 122 and will not re-evaluate unless there is a close above this level.
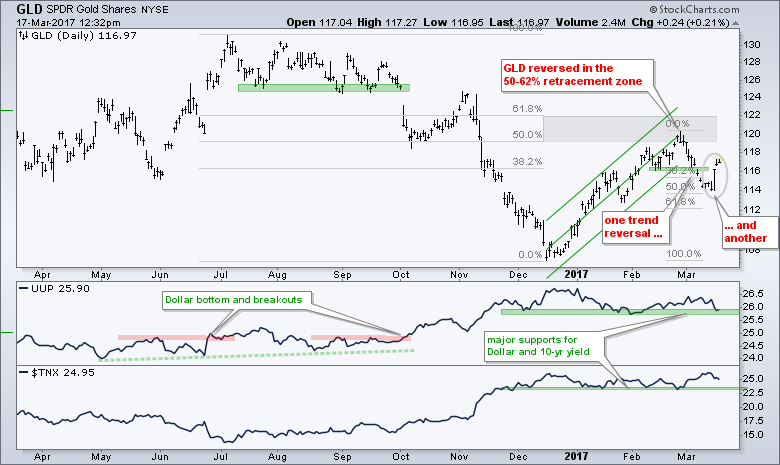
Gold Gets Interesting - Or Does it?
The Gold SPDR (GLD) broke down on March 7th with a sharp decline below 116 and then rebounded sharply this week. The surge can be attributed to sharp declines in the Dollar and the 10-yr T-Yield on Wednesday. At this point, I still think the break below 116 is the dominant chart signal. Even though GLD is back above 116, I am not inclined to bite on this reversal during Fed week because it could be just noise. In addition, the Dollar has yet to break support and the 10-yr yield is in an uptrend.
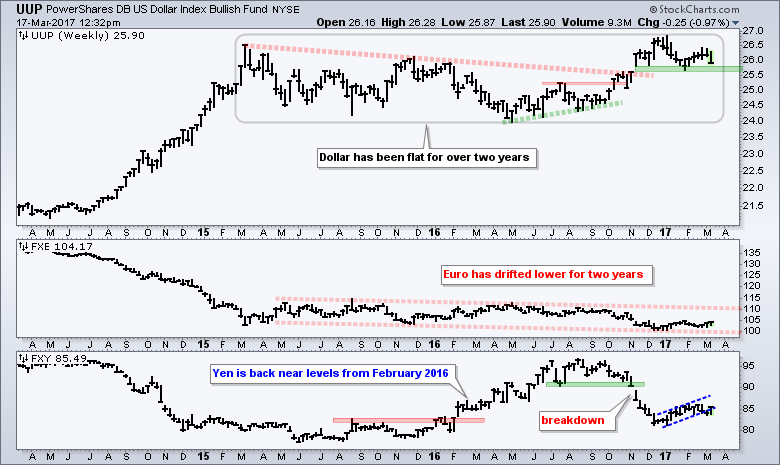
Dollar Continues on its Way to Nowhere
Speaking of the Dollar, today I am showing a weekly chart to emphasize just how little the greenback actually moved the last two years. Notice that UUP surged above 26 in March 2015 and fell back below 26 with a 1% decline this week. The overall trend since May is up with the Dollar testing support from the January low. The first indicator window shows the Euro ETF (FXE) drifting lower the last two years - and I do mean drifting. The second window shows the Yen ETF (FXY) falling sharply at the end of 2016 and rebounding in 2017. Overall the Yen has not moved much since February 2016.
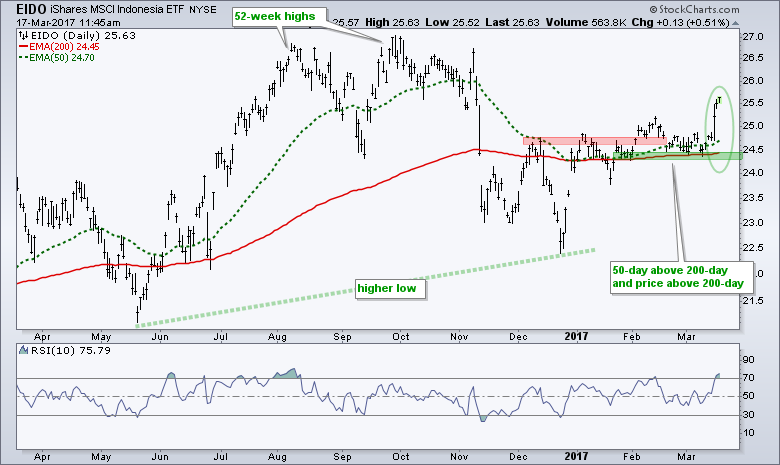
Indonesia ETF Surges off Support
The Indonesia ETF (EIDO) is perking up this week with a big surge off the February low and 200-day EMA (green oval). Note that this is an ETF with dozens of stocks and a currency conversion at work. I would, therefore, take support and resistance levels with a bucket of salt. In any case, the ETF hit 52-week highs in August-September and then corrected hard into November-December. EIDO managed to hold above the May low and forge a higher low with a bounce to 25. After some stalling in February, it looks like the uptrend is resuming with this week's the surge off support. A close below the February lows would call for a re-evaluation.
******************************************************
Spotting Pullbacks and Upturns within an Uptrend using RSI and MACD Histogram.
Difference between EMA and SMA - Using %Above 200-day EMA for Breadth Analysis.
Backtesting Different Moving Average Pairs with SPY, QQQ and IWM.
ETF Master ChartPack - 300+ ETFs organized in a Master ChartList and in individual groups.
Follow me on Twitter @arthurhill - Keep up with my 140 character commentaries.
****************************************
Thanks for tuning in and happy St Patrick's Day!!
--Arthur Hill CMT
Plan your Trade and Trade your Plan
*****************************************


