.... ChartCon Momentum-Rotation Update
.... What can we learn from this?
.... Comparing with the Momentum-Driven ETFs
.... Comparing Performance with PerfCharts
.... Ranking Performance with the Summary View
.... Measuring Relative Performance with RRGs
.... Performance Since Bull Run Began
.... Measuring Rolling Performance
.... Volatility Can Hurt Momentum ....
Today I am going to look at some momentum-style ETFs to see if they can outperform the big three (SPY, QQQ and IJR). Before looking at some performance metrics, I will also review the momentum rotation strategy presented at ChartCon in September.
ChartCon Momentum-Rotation Update
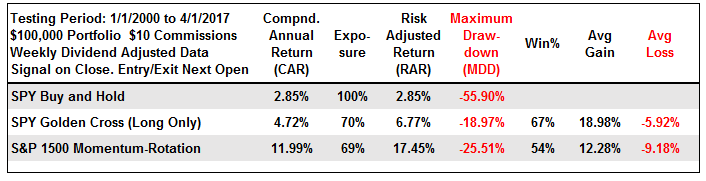
Using the historical constituents of the S&P 1500, the momentum-rotation system buys the 15 stocks with the highest six month Rate-of-Change and sells when they drop out of the top 150, as ranks by the 26-week ROC. Roughly speaking, the system holds until the stock drops out of the top 10 percent. The positions are equally weighted, there is no rebalancing, the portfolio started at $100,000 and commissions were $10 per trade. Full system details and backtest results can be found in this system trader article.
In a nutshell, the system performed well over the last 17+ years, but struggled over the last six months. The table below shows results from 1/1/2000 to 4/1/2017. The Compound Annual Return was around 12% and the Maximum Drawdown was 25.51%, which is just more than double the CAR. The system easily outperformed buy-and-hold and the golden cross over this period.
The next table shows results over the last six months (October 2016 to March 2017). The first line shows buy-and-hold for an equal weight portfolio of four major index ETFs. The second line shows the momentum-rotation system for the S&P 1500 and the last three lines break it down by index. The system buys the top 15 stocks and holds until they drop out of the top 10 percent in performance (26-week ROC). Using the S&P 500 as an example, the system would buy the top 15 and sell when they dropped out of the top 50.
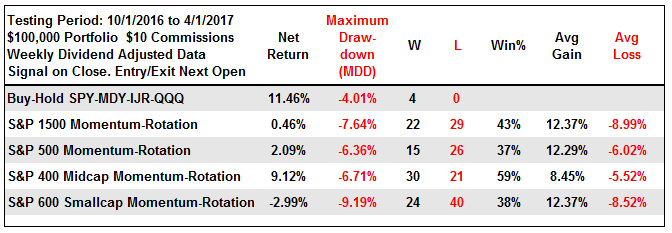
First, buy-and-hold is killing it with an 11.46% return over the last six months. The momentum rotation strategy for the S&P 1500 returned just .46% and this is due to relative weakness in small-caps. Notice that the momentum rotation strategy for the S&P Small-Cap 600 is down around 3%. This reflects weakness in small-caps, energy and finance from mid December to March. Mid-caps are killing it with a 9.12% gain and large-caps are net positive with a 2% gain. This is thanks to big gains in CGNX, SIVB, HBHC and MENT, which was aquired.
What can we learn from this?
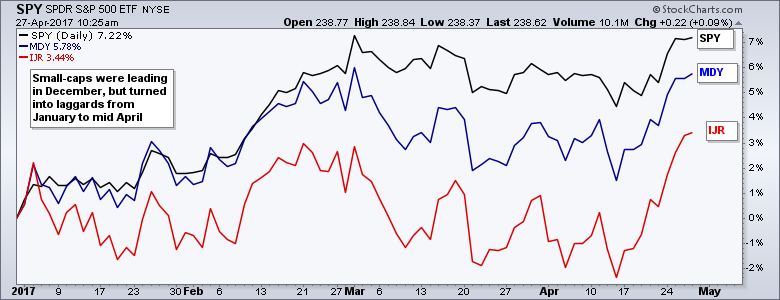
First, a portfolio should not be concentrated in one sector. Small-cap energy stocks were leading the market at the beginning of October and then severely lagging six months later. Second, small-caps in general lagged the market from December to mid April. Small-cap stocks have higher betas and often make up a large portion of a momentum portfolio. Traders can spread the risk by insuring an equal weighting for each group (1/3 small-cap, 1/3 mid-cap and 1/3 large-cap).
Third, a little more diversification in general can help. Traders can consider increasing the portfolio size (20-30 positions) and widening the cut off to the top 20%. In other words, buy the top 30 stocks and hold until they drop out of the top 300 (when ranked by 26-week Rate-of-Change). Making these adjustments produced a 9.39% Compound Annual Return and 24.35% Maximum Drawdown from 1/1/2000 to 4/1/2017. In addition this adjustment returned 3.75% over the last six months. It is just an idea.
Comparing with the Momentum-Driven ETFs
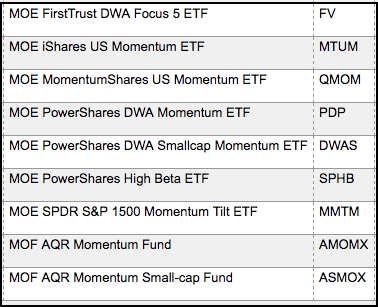
I put together a ChartList with 6 momentum ETFs, a high-beta ETF and 2 momentum mutual funds. The ETFs begin with the prefix (MOE) and the funds begin with the prefix (MOF). Six of the ETFs trade individual stocks and one (FV) trades the top five ETFs. There are others, but I will just stick with these broad market funds for now. You can Google the fund family and symbol to learn more about these ETFs. I am primarily trying to find out how they performed over the last 3-6-12 months and if they outperformed the major index ETFs. Here is a symbol list: PDP, DWAS, MMTM, FV, QMOM, AMOMX, ASOMX, SPHB, MTUM.
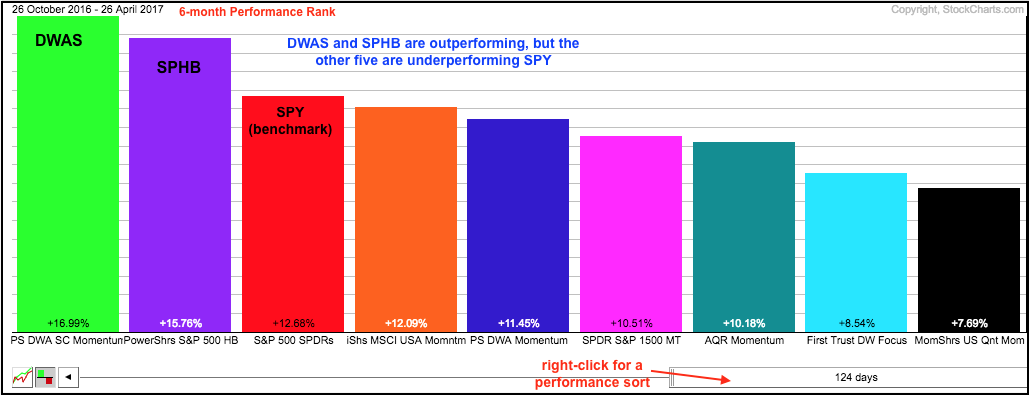
Comparing Performance with PerfCharts
There are a number of ways to compare performance here at StockCharts. Chartists can view up to ten symbols in a PerfChart and right click the slider for a performance sort. The PerfChart below shows six-month performance with the PowerShares DWA Momentum ETF (DWAS) and the PowerShares High-Beta ETF (SPHB) outperforming SPY.
Ranking Performance with the Summary View
The next image shows a table by viewing a ChartList in "summary" format. Click here to learn more about this feature. This summary is sorted by the 3-month Rate-of-Change and there is a big difference in leadership. Notice that the PowerShares Smallcap Momentum ETF (DWAS) is up just 2.6% the last three months and lagging. This same ETF is up 17% over the last six months and leading the longer timeframe. This shows how leadership can change quite drastically from one quarter to the other.
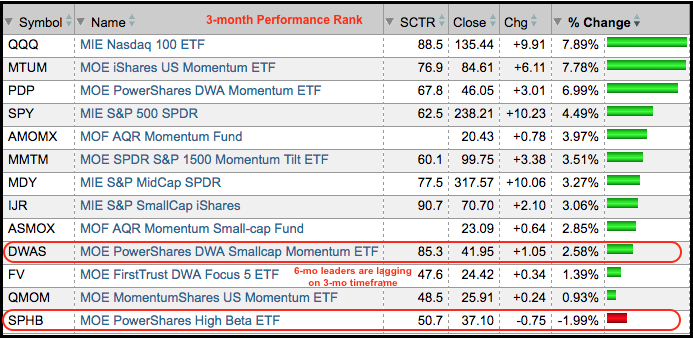
The S&P 500 High Beta ETF (SPHB) is also leading the six-month ROC, but lagging the most recent 3-month ROC. Basically, SPHB was up around 16.5% the first 3 months (26-Oct to 27-Jan) and down around 1.15% the next three months (27-Jan to 26-Apr). SPHB is not a true momentum portfolio, but the ETF reflects the performance of the big moves (stocks with the highest betas).
Measuring Relative Performance with RRGs
Chartists can also view relative performance by looking at a Relative Rotation Graph (RRG). The RRG shown below has the seven ETFs, the 2 momentum funds and four major index ETFs (SPY, IJR, MDY and QQQ). I am using SPY as the benchmark. You can see that almost everything is underperforming SPY and in the lagging quadrant. The iShares US Momentum ETF (MTUM), the PowerShares DWA Momentum ETF (PDP) and the Nasdaq 100 ETF (QQQ) are outperforming SPY (green). You can read more about RRG here. This performance ranking is similar to what we are seeing with the 3-month Rate-of-Change ranking.

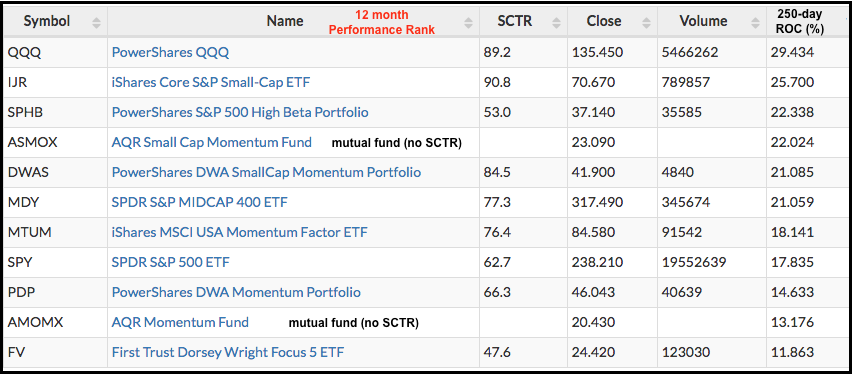
Performance Since Bull Run Began
The final method shows a 250-day Rate-of-Change ranking using the scan engine. This is around one year and captures the performance since the latest bull run began, which was in late March 2016. Notice that QQQ and IJR are leading the pack with the S&P 500 High Beta ETF (SPHB) in third place. The 250-day Rate-of-Change stays above 20% until the iShares Momentum ETF (MTUM).
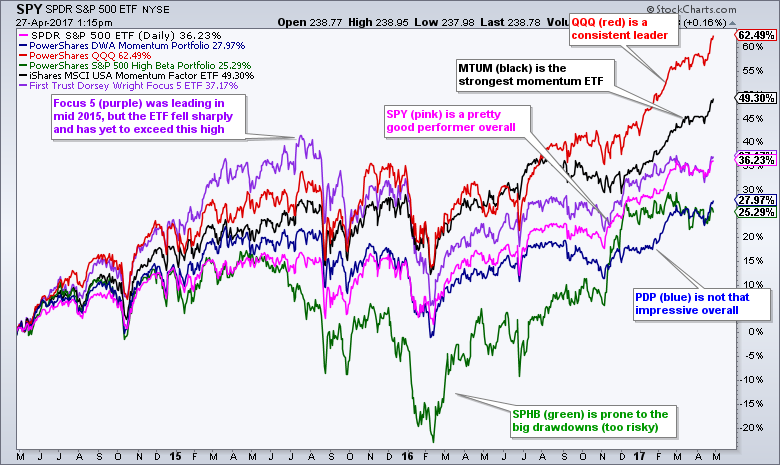
Measuring Rolling Performance
I think we need a Performance SharpChart to get a true performance picture over time. The chart below shows SPY, QQQ and the four ETFs with the highest volume. Four things stand out on this chart. First, the S&P 500 High Beta ETF (green) is subject to some serious drawdowns, which makes sense because high-beta stocks are supposed to overreact. Second, Nasdaq 100 ETF (QQQ) is the undisputed leader and the iShares Momentum ETF (MTUM) is a distant second. Third, the S&P 500 SPDR (pink), even though it is just a broad index ETF, shows a respectable 3-year performance and outperformed SPHB and PDP. Fourth, the FirstTrust Focus 5 (FV), which is purple, experienced a big drawdown from June 2015 to January 2016 and has yet to exceed its 2015 high. All the other ETFs are above their 2015 highs.
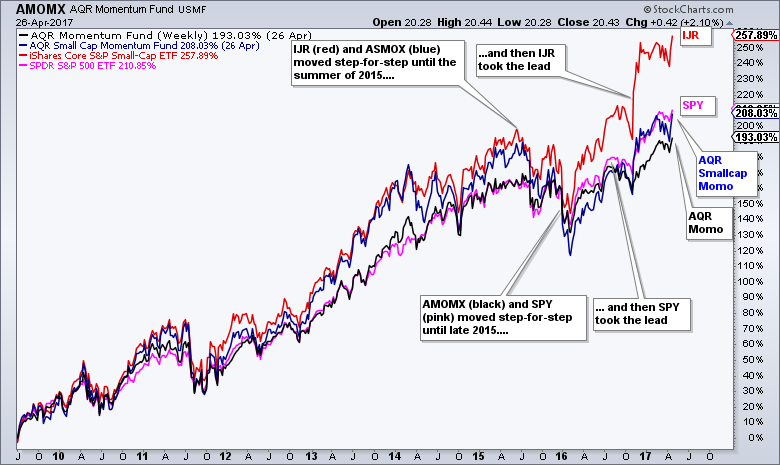
Volatility Can Hurt Momentum
Change is the only constant in this game and momentum is no different. First, sudden and sharp leadership changes within the market will hit momentum strategies. The higher they are the harder they fall. Second, the performance chart below suggests that the two AQR momentum funds are vulnerable to volatility shocks. The chart below shows the S&P SmallCap iShares, the S&P 500 SPDR, AQR Momentum Fund (AMOMX) and the AQR Small-cap Momentum Fund (ASMOX). The tracking was pretty good up until 2015, which is when volatility hit the markets. The AQR funds (black and blue) were hit hard and took longer to recover. IJR and SPY were also hit hard, but both hit new performance highs well before their corresponding momentum funds. As adaptive as these momentum ETFs seem, it is hard to beat a good old fashion index ETF for steady performance.
 ******************************************************
Spotting Pullbacks and Upturns within an Uptrend using RSI and MACD Histogram.
Difference between EMA and SMA - Using %Above 200-day EMA for Breadth Analysis.
Backtesting Different Moving Average Pairs with SPY, QQQ and IWM.
ETF Master ChartPack - 300+ ETFs organized in a Master ChartList and in individual groups.
Follow me on Twitter @arthurhill - Keep up with my 140 character commentaries.
****************************************
Thanks for tuning in and have a good day!
--Arthur Hill CMT
Plan your Trade and Trade your Plan
*****************************************


